
Four years ago, I wrote that interceptions were being returned for touchdowns at a much higher rate. As it turns out, that may have just been a blip: the 2012 season set a record for both pick sixes and pick sixes per interception.
We can look at pick sixes in a few ways. On Monday, I noted that on a per-game basis, interceptions per game were down to near-historic lows. Given that pass attempts are way up, you won’t be surprised to learn that pick sixes per attempt are really, really down.
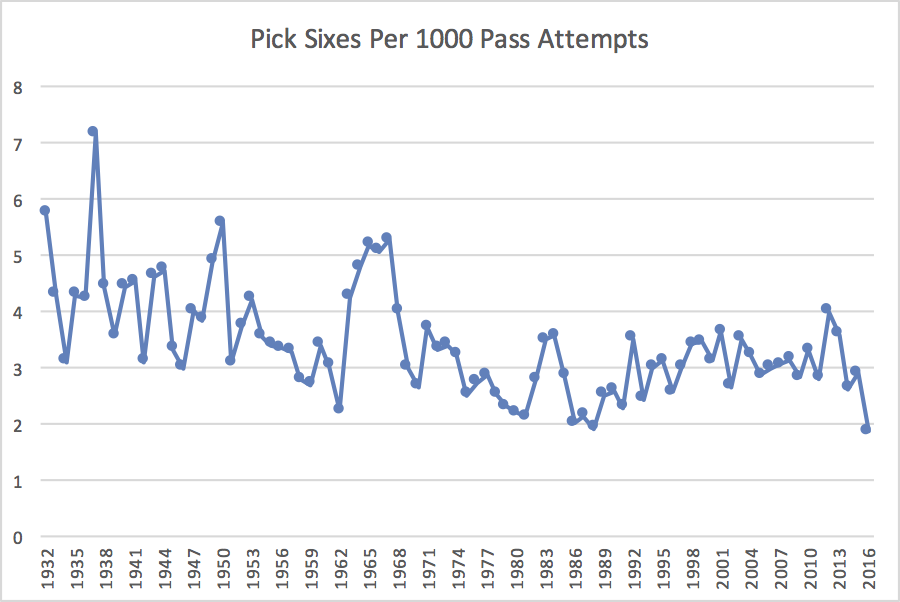
The graph below shows the number of interceptions returned per 1,000 pass attempts throughout NFL history. Last year was the lowest in history, at 1.86; thought of another way, there was just one pick six for every 538 pass attempts.
There’s a third way to measure pick six frequency: what about interceptions returned for touchdowns per interception? Let’s measure that on a per-50 interception basis, which will (as before) give us a number that’s generally between 2 and 7. As you can see, this peaked in the 2012 season — causing me to write that original article — but has dropped noticeably since then.

We can also combine the two charts. Let’s do that, keeping the pick sixes per 1000 attempts line in blue, and the pick sixes per 50 interceptions line in red. You can see that the overall pick six rate on a per attempt basis is generally going down, while the pick six per interception rate is going up, with both metrics decreasing sharply since 2012.

What stands out to you guys?