≡ Menu

This may be my favorite project of the 2015 season. Of course, that may be because it has nothing to do with the 2015 season, but it was a football historian’s dream project: a look at the best plays from each of the 50 yard lines, beginning at the 50 and moving to the opponent’s one-yard line (you can probably guess that one).

With 49 Super Bowls in the history books, the NFL’s biggest game has seen some of football’s biggest plays. To celebrate Super Bowl 50, the following recounts the most exciting, most impactful and most memorable play from each hash mark from midfield to the 1-yard line.

The plays were selected based on a combination of memorable moments, big plays in the biggest game that led to the biggest changes in win probability. Note that only plays from 50 yards and in are included, so plays such as David Tyree’s helmet catch (which started at the Giants 44-yard line) and Los Angeles Raiders running back Marcus Allen running with the night from 74 yards out against the Redskins, are not included. Still, there’s no shortage of sterling Super Bowl moments, including one memorable play with the snap right at midfield.

The graphics team at the Washington Post did a fantastic job, so please take a look. And much credit goes to Pro-Football-Reference.com, and Mike Kania (@zempf) in particular, for helping me narrow down the list of candidates at each yard line.

The toughest choice to make? Three of the most memorable plays happened at the ten yard line: The Tackle, by Mike Jones, Joe Montana to John Taylor to beat the Bengals in Super Bowl XXIII, and the Sickest Man in America, when Jackie Smith dropped a sure touchdown.

Anyway, please take a look: I am sure any historian will enjoy this trip down memory lane.

{ 10 comments }

538: 2013/2015 Broncos and the 1982/1984 Dolphins

The 2013 Broncos had one of the greatest offenses of all time and made it to the Super Bowl.  Two years later, Denver is again in the Super Bowl, on the strength of a superb defense.  How rare is that?  Well, the only team that really fits that profile is the Miami Dolphins, who made the Super Bowl in 1982 and 1984, and had a similar swing (albeit in the other direction).

Over at 538, I look at the  similarities between those two teams, and other teams that have swung from an extreme offensive/defensive identity to an extreme defensive/offensive identity just two years later.  A special thanks to Adam Harstad, who was the one who gave me the simple but creative methodology to display these results.

In the strike-shortened 1982 season, the Miami Dolphins made it to the Super Bowl on the strength of an incredible defense that allowed the NFL’s fewest yards, first downs, passing yards and net yards per pass attempt. The offense wasn’t very good, but the defense — known as the Killer Bees because the last names of six starters began with the letter B — guided the team to the Super Bowl, as Miami ranked second in points allowed and third in takeaways.

Just two years later, the Dolphins were back in the Super Bowl, and once again, the team was one-dimensional. But, remarkably, it was the offense that was the dominant unit, as Miami led the NFL in points, yards, first downs and net yards per pass attempt, while a second-year quarterback named Dan Marino set single-season records for passing yards and passing touchdowns.

You can read the full article here.

{ 8 comments }

Super Bowl Champs By DVOA

After yesterday’s post, I thought it would be fun to look at the DVOA ratings of each Super Bowl champion, using actual numbers from since 1989 and estimated from prior to that.

Here is a graph showing the DVOA of each Super Bowl champion. The Y-Axis shows Defensive DVOA, from negative at the top to positive at the bottom. Remember, for DVOA, negative ratings are better for defenses. The X-Axis shows offensive DVOA from left to right. As expected, most teams are clustered in the upper right corner of the chart.

sb winner dvoa

Here is the same chart but including the remaining eight teams in the 2015 playoffs (DVOA ratings available here). As you can see, the only real outlier would be the 2015 Broncos.

sb winner dvoa den

Thoughts?

Finally, per request, here is a table containing the DVOA (estimated or actual) for each Super Bowl winner:

YearTmOff DVOADef DVOAOff RkDef Rk
2014NWE13.5%-3%2437
2013SEA9.4%-25.8%335
2012BAL3%2.2%3943
2011NYG10.5%2.4%30.544
2010GNB11.5%-13.9%2818
2009NOR24.3%-0.4%939
2008PIT-1.5%-29%452
2007NYG-1.1%-3.8%4336
2006IND28.5%8.5%448
2005PIT12%-13.5%2719.5
2004NWE23.3%-10.7%1225
2003NWE1.2%-18.7%4111
2002TAM-3.8%-31.8%471
2001NWE3.4%-1.5%3838
2000BAL-8.1%-23.8%497
1999STL17.7%-13.5%1919.5
1998DEN34.5%4.3%147
1997DEN19.4%-5.9%1634
1996GNB15.2%-19.3%2110
1995DAL29.6%0.9%242
1994SFO18.9%-7.5%1732
1993DAL21.8%0.8%1341
1992DAL23.6%-9.5%1028
1991WAS27.2%-21.1%58
1990NYG10.5%-14.4%30.517
1989SFO26.2%-11.5%623
1988SFO14.2%-10.6%2226
1987WAS10.1%2.9%3245
1986NYG3.9%-7.9%3730
1985CHI12.5%-26.8%264
1984SFO28.6%0.5%340
1983RAI0.1%-9%4229
1982WAS5.7%-7.3%3633
1981SFO11%-5.8%2935
1980OAK-7.7%-7.6%4831
1979PIT13.9%-20.2%239
1978PIT2.7%-12.4%4022
1977DAL24.8%-9.6%827
1976OAK24.8%9.4%749
1975PIT13.5%-14.4%2516
1974PIT-3.4%-28.9%463
1973MIA19.5%-15.6%1513
1972MIA18.5%-14.8%1815
1971DAL23.3%-11.3%1124
1970BAL-1.1%3.9%4446
1969KAN7.3%-25.6%356
1968NYJ16.8%-15.6%2014
1967GNB8.8%-12.9%3421
1966GNB20.1%-16.2%1412
{ 19 comments }

Antonio Brown caught caught 17 passes (on 23 targets) for an incredible 284 yards today against the Raiders. He also had two carries for 22 yards. But while 306 yards from scrimmage is insane, Brown wasn’t a one-man show: DeAngelo Williams rushed 27 times for 170 yards and two touchdowns, while catching two passes for 55 yards. Together, the duo combined for an insane 531 yards from scrimmage. That’s the most in the NFL by any duo since at least 1960… by a whopping 50 yards!

TeamOppYearDuo YFSPlayer 1YFSPlayer 2YFSBoxscore
PITOAK2015531Antonio Brown306DeAngelo Williams225Boxscore
OAKHOU1963481Art Powell247Clem Daniels234Boxscore
DETDAL2013451Calvin Johnson329Reggie Bush122Boxscore
PHIDET2007442Kevin Curtis221Brian Westbrook221Boxscore
BUFMIA1991422Thurman Thomas268Andre Reed154Boxscore
PITATL2002421Plaxico Burress253Hines Ward168Boxscore
INDBAL1998420Marshall Faulk267Torrance Small153Boxscore
CLENYG1965414Ernie Green222Jim Brown192Boxscore
PHISTL1962411Timmy Brown249Tommy McDonald162Boxscore
RAMMIA1976410Ron Jessie220Lawrence McCutcheon190Boxscore
WASDEN1987402Timmy Smith213Ricky Sanders189Boxscore
NYJBAL1972401Rich Caster204Eddie Bell197Boxscore
CHIMIN2013400Alshon Jeffery249Matt Forte151Boxscore
STLWAS2006400Steven Jackson252Isaac Bruce148Boxscore

But hey, Cleveland fans: the Steelers duo still wasn’t quite as good as Jerome Harrison and Josh Cribbs.

{ 2 comments }

At the start of the new season, every team has hope. Well, just about every team. And that made me wonder: how did Super Bowl champions look in the year before winning the Super Bowl?

The Jets were at -5.0 in the SRS last year: has any team ever been that bad (or worse) and won the Super Bowl the next season? Why yes, one — and only one — team has. The graph below shows the SRS ratings of each Super Bowl champion in the year before they won the Super Bowl. Note that I’m still using the Super Bowl year in the graph below, so if you go to 1972, you’ll see the 1971 Dolphins’ SRS. [continue reading…]

{ 2 comments }

On February 3rd, 2013, the Baltimore Ravens defeated the San Francisco 49ers in Super Bowl XLVII. The next day, I compared Jim Harbaugh’s 49ers to Vince Lombardi’s Packers, who also lost their first appearance in the NFL title game. San Francisco, which made it to the NFC Championship Game the year prior and would again the following season, seemed set up to emerge as one of the dominant teams of the ’10s.

But the amount of roster turnover experienced by the 49ers since February 3rd, 2013, is incredible. Just 2.5 years later, only seven of the 22 starters from that day are still on the San Francisco roster. And even that probably overstates things, as Colin Kaepernick’s career has taken a downward spiral, Vernon Davis may be on his last legs, NaVorro Bowman is a question mark after a brutal knee injury, and Aldon Smith makes more headlines these days off the football field than on it. Oh, and Ahmad Brooks may lose his starting job to Aaron Lynch. [continue reading…]

{ 3 comments }

Last year, I wrote a post on the plays that had the biggest impact on the eventual Super Bowl champion. These were the plays that affected the Super Bowl win probability by the biggest amount among teams that did not win the title. At the time, the Buffalo Bills were on the short end of the most influential play in the Super Bowl era. When Frank Reich put the ball down for Scott Norwood, I estimated that the Bills had a 45% chance on winning the Super Bowl. [1]Recent research by Chase suggests something similar. After the kick went wide right, the Bills’ win probability fell to zero. The 45 percentage point fall was the biggest change for a non-champion of any play in the Super Bowl era. Over 48 years, a bunch of plays fell in that range, but no team could point to a single play as having lowered its championship chances by so large an amount.

A couple weeks ago, that long-held record got broken kind of like Michael Johnson broke the 200-meter record in the Atlanta Olympics. Malcolm Butler’s pick obliterated the old mark. My estimate has the Butler interception as increasing the Patriots’ chances of winning by 0.87. There is no doubt that what some have called the Immaculate Interception is on an island by itself as the most influential play in NFL history.

To get that change in win probability from Butler’s play, I am going to assume that the Seahawks would have run on third and fourth down. I am going to give a run from the one a 60% chance of working. That might seem high, but the Patriots were the worst team in football in stuffing the run in important short-yardage situations either on third or fourth down, or down by the goal line. And their limited success mostly came against terrible running teams. It is not a huge sample, but against teams outside the worst quarter of rushing teams by DVOA, the Patriots had allowed opponents to convert 16 of 17 times with two yards or less to go for a first down or touchdown. If we add the playoffs, they actually had three more stops against good running teams (Baltimore and Seattle), albeit in games where the opponent had a good amount of success on the ground. [2]Note that the stop against Baltimore should not even count. In an otherwise great game for Gary Kubiak, he called for a reverse to Michael Campanaro on third-and-1 in the second quarter. The run was … Continue reading With Seattle being the best rushing team in football by a mile and the Patriots being at best not great in run defense in that situation, it seems hard to think that Seattle had anything less than a 0.60 chance of scoring on a run. [continue reading…]

References

References
1 Recent research by Chase suggests something similar.
2 Note that the stop against Baltimore should not even count. In an otherwise great game for Gary Kubiak, he called for a reverse to Michael Campanaro on third-and-1 in the second quarter. The run was stopped for a loss. The Patriots basically could not stop Justin Forsett, making the reverse call very unnecessary.
{ 31 comments }

How many Super Bowls should the Patriots have won?

Since 2001, New England had made the playoffs twelve times, reaching the Super Bowl, incredibly, in half of those seasons. The Patriots have won the Super bowl four times over this fourteen-year span, which made me wonder: how many Super Bowls *should* the Patriots have won?

This could be measured in a few ways. We could look at say, the team’s pre-season odds of winning it all each year. I don’t have that historical data, but we can be sure that New England significantly overachieved by that measure. We could also look at the team’s Super Bowl chances at the start of each post-season. For example, at the end of the regular season, Bovada had the Patriots at 3/1 to win the Super Bowl. That would imply a 25% chance of winning it all, although after adjusting for the vigorish, the Patriots’ true odds would have been 21.8%. I don’t have historical data of this sort, although I am sure one could use a combination of SRS and home-field advantage to come up with something similar. Hey, if you have ideas, present them in the comments.

Instead, I used the same methodology I used a couple of weeks ago to determine the randomness of each post-season. Remember, a point spread can be converted into an expected winning percentage using the following formula in Excel (if you put the point spread in cell L2): [continue reading…]

{ 8 comments }

Super Bowl XLIX, and Thoughts on ANY/A

Let’s get something out of the way.

In the final minute of the game, the Seahawks had an 88% of winning Super Bowl XLIX. To make grandiose statements about the Patriots passing attack and football analytics based on New England winning the Super Bowl would be silly given the way the game ended.

Okay, whew.  But I do want to talk about the Patriots offense, and more specifically, ANY/A.  As regular readers know, Adjusted Net Yards per Attempt is calculated as follows:

(Gross Passing Yards + 20*PassTDs – 45*INTs -SkYdsLost) / (Pass Attempts + Sacks)

ANY/A correlates very well with winning, and it’s my favorite basic metric of passing play.  But ANY/A, based around yards per attempt, is not perfect.  And I think SB XLIX provides a good example of that.  Tom Brady finished the day with 320 net passing yards, 4 TDs, and 2 INTs on 51 dropbacks, which translates to an ANY/A of 6.08.  Russell Wilson had 234 net passing yards, 2 TDs, and 1 very fateful INT on his 24 dropbacks; that translates to an ANY/A of 9.54. [continue reading…]

{ 36 comments }

This week at the New York Times, a look at the most heartbreaking losses in Super Bowl history.

The Seattle Seahawks were a yard from history. Trailing by 4 points in the final minute of Sunday’s Super Bowl, Seattle had the ball, on second down, at the Patriots’ 1-yard line. According to the website Advanced Football Analytics, that gave the Seahawks an 88 percent chance of winning the Super Bowl.

With a win, Seattle would have become just the ninth team in the Super Bowl era to repeat as champion, and the first since the 2003-4 Patriots. The defense, which had allowed the fewest points in the N.F.L. in each of the last three seasons, would have strengthened its argument to be considered the greatest in football history.

But it was not to be. Brandon Browner jammed Jermaine Kearse at the line, and Malcolm Butler shot in front of Ricardo Lockette to make a game-changing interception. For Patriots fans, it was a play to remember forever. For Seahawks fans, it was one they wish they could forget.

But where does Super Bowl XLIX rank among the most painful Super Bowl losses in history?

You can read the full article here.

{ 17 comments }

The Patriots SRS rating has been inflated in the postseason

The Patriots true SRS rating is deflated if you only use regular season data.

It has always seemed a little strange to me that we think about the regular season and the playoffs separately when evaluating a team’s season. At least, that’s usually what happens in terms of the numbers. We think about a team’s regular season record and we think about where they were eliminated in the playoffs. A team’s Simple Rating System (SRS) rating is based just on their regular season performance. [1]Note that Football Outsiders’ DVOA does update for the playoffs. When we evaluate a team or a matchup, it might make more sense to think about their whole body of work including the playoffs when calculating ratings.

In the table below, I have calculated the SRS of Super Bowl teams according to Pro Football Reference’s (PFR) method that considers just the regular season. [2]It looks like I get the same numbers as PFR in a bunch of cases, but I have not checked all of them. In any event, it looks like my program works. I have also added adjusted ratings that include the playoff games leading up to the Super Bowl. These set of adjusted ratings help to identify the Super Bowls that were the closest and best matchups based on teams’ performances over the entire season including the playoffs. [continue reading…]

References

References
1 Note that Football Outsiders’ DVOA does update for the playoffs.
2 It looks like I get the same numbers as PFR in a bunch of cases, but I have not checked all of them. In any event, it looks like my program works.
{ 10 comments }

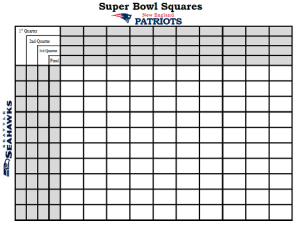
super-bowl-squares-xlixFor the last two years, I’ve written about Super Bowl squares. Well, it’s that time of year again, so here’s your helpful cheat sheet to win at your Super Bowl party.

Every Super Bowl squares pool is different, but this post is really aimed at readers who play in pools where you can trade or pick squares (surely no pool has a prohibition on this!) I looked at every regular season and postseason game from 2002 to 2013. [1]Yes, this means your author was too lazy to update things for the 2014 season, because frankly, the extra work isn’t worth it. The table below shows the likelihood of each score after each quarter, along with three final columns that show the expected value of a $100 prize pool under three different payout systems. The “10/” column shows the payout in a pool where 10% of the prize money is given out after each of the first three quarters and 70% after the end of the game; the next column is for pools that give out 12.5% of the pool after the first and third quarters, 25% at halftime, and 50% for the score at the end of the game. The final column is for pools that give out 25% of the pot after each quarter — since I think that is the most common pool structure, I’ve sorted the table by that column, but you can sort by any column you like. To make the table fully sortable, I had to remove the percentage symbols, but “19, 6.7, 4.1, 2” should be read as 19.0%, 6.7%, 4.1%, and 2.0%. [continue reading…]

References

References
1 Yes, this means your author was too lazy to update things for the 2014 season, because frankly, the extra work isn’t worth it.
{ 0 comments }

The physicist Werner Heisenberg (this guy, not this guy) found that observers affect the systems they attempt to measure, something that is related to but actually separate from his Uncertainty Principle. Even if Heisenberg was thinking about submicroscopic particles whizzing around, his ideas can still apply to writing about NFL betting. Writing about my bets could change the sequence of events that follow, at least in theory, just like all the other actions people take everywhere that put the world on a different course. The NFL season that just unfolded was just one of an infinite number of potential seasons that could have happened. In what share of the possible seasons did my pick for the NFL’s worst team start the season 9-1? Am I just the worst predictor ever, someone dumb enough to underestimate the great Arians and the new great HC of the NYJ? Or was I tempting fate by writing about real bets?

Since I am supposed to be a coldly-rational, data-driven guy, I am going to chance it and review my NFL betting this year. This is risky since my betting year could still be saved by events yet to be determined. Before I get to all that, I am hoping that maybe my writing about football can influence something much more plausible, namely whether I attend the Super Bowl next week. Apologies for this distraction, but I could really use some help.

***HUMBLE REQUEST BEGIN***

If you have read any of my stuff here or on Football Outsiders, you may know that I am a Patriots fan. Sufficiently dedicated to have flown from Los Angeles to Boston for the Ravens game, then back to LA for the first week at Loyola Marymount, before flying back to Boston for the Colts game. Now I am hoping to obtain two tickets to the Super Bowl. Here is what I can offer: [continue reading…]

{ 6 comments }

Last weekend, we looked at the team with the most Pro Bowlers to win a championship. Today, we look at the reverse: the team with the fewest Pro Bowlers to win it all.

As a technical matter, the Pro Bowl hasn’t always been around, so some pre-1950 teams and the 1960 Oilers (there was no Pro Bowl in the AFL’s first season) had zero Pro Bowlers. But only one team has had exactly one Pro Bowler and won the title. Here are some hints:

Trivia hint 1 Show


Trivia hint 2 Show


Trivia hint 3 Show

[continue reading…]

{ 5 comments }

The NFL Draft is this week, which means we have something resembling real football to talk about. But how much impact will the players who hear their names called during the 2014 Draft have on the 2014 season? Here’s the short answer: as a group, they will make up about 10% of games played by all players and 8% of all starts.

What do I mean by that? Each year, every team’s players start 352 games, which is the product of 16 (games) and 22 (starters). Players selected during the 2013 Draft started 27 games per team last year, which is in line with the recent average of eight percent. I also looked at the number of games played by all drafted rookies, and divided that by the number of games played by all players on that team. Take a look: the blue line represents games played by drafted rookies and the red line represents games started; both numbers on shown on a percentage basis for the league as a whole. [continue reading…]

{ 9 comments }

Ranking The Almost Dynasties

A couple of weeks ago, Andrew Healy contributed a guest post titled, “One Play Away.” He’s back at it today, and we thank him for another generous contribution. Andrew Healy is an economics professor at Loyola Marymount University. He is a big fan of the New England Patriots and Joe Benigno.


What teams do we remember the most? Going back to the merger, the 1970s Steelers, the 1980s 49ers, the 1990s Cowboys, and the 2000s Patriots seem to stand above the rest. Each of these teams earned that place in our collective memory by winning the most Super Bowls in the decade.

How different could it have been? In other words, were the dynasties that happened by far the most likely ones? Or were there others that were equally, or even more likely? Think of teams that have suffered unusually cruel sequences of defeats (cue nodding Vikings, Bills, and Browns fans). We all know that those teams could have won Super Bowls. But maybe the more interesting question is whether those teams realistically could have won multiple Super Bowls, or even have become the dominant team of the era.

Today, I estimate the chances that different teams had of becoming the Team of the Decade (the TOD) for the ’70s, ’80, ’90s, and ’00s. Some of the results are surprising. One of the teams that became the TOD was actually much less likely than another to dominate that decade. Only two of the four teams truly stand out as being clearly the single most-likely team to be the TOD.

Even more interesting are the teams that might have been dynasties instead of the ones we’ve come to know. In most cases, these teams won at least one Super Bowl. In one case, though, a team that became famous for losing easily could have been not just a one-time winner, but a team that became a dynasty and dominated the decade.

To come up with the estimates of a team’s chances of winning Super Bowl, I simulated the playoffs 50,000 times. I used the actual playoff brackets and then created win probabilities for each game based on team strength. In tables that follow below, I’ll describe the probabilities that teams won multiple titles in a decade. I’ll also pick a True Team of the Decade (most expected Super Bowl wins), a What-Might-Have-Been-Dynasty that Won Nothing, a Team that Wasn’t as Good as We Remember, and a A Bottom-Feeder Team(s) for each decade.

First, a brief description of how I performed the simulations before getting to the rankings:

  • The playoffs were run under the rules in a given year: All rules relating to seeding, home field, and number of teams were used. If there was a rule in place preventing matchups between divisional opponents in a given round, I also applied that rule. To some extent, the fewer teams in earlier years helped make dynasties more likely in those decades.
  • Pro Football Reference’s Simple Rating System was used to measure team strength: I used PFR’s for all years to be consistent. It’s worth noting that their ratings and DVOA usually match up closely. Another possibility is to try to simulate DVOA ratings, but it seems simpler to just use SRS throughout. In some cases, there are some differences, such as for the 1998 Broncos and 1999 Titans.
  • I used the beginning of the NFL season to define the decades: So 1970-79 means Super Bowls V-XIV. An interesting thought experiment is to consider Super Bowl time instead of calendar decades. Then the Raiders would have been the team of Super Bowls XI-XX. Anyway, I’ll stick with the convention. It’s worth noting that my results suggest the Raiders were not as good as we might remember.

1970s

The table below shows each franchise’s probability of having won 0, 1, 2, 3, 4, 5, or 6 Super Bowls during the decade according to the methodology described above. The final column shows the expected number of Super Bowl wins for the decade.

Team0123456E(Wins)
PIT0.1450.330.3120.1560.0490.0080.0011.659
DAL0.2090.3770.2750.1110.0240.00401.377
MIN0.2360.4070.2610.0810.0130.00101.232
MIA0.3430.4220.1910.0390.004000.941
RAM0.390.3990.1690.0370.005000.87
OAK0.3950.4020.1650.0340.005000.853
BAL0.5610.3550.0760.0080000.532
WAS0.6010.3330.0610.0050000.469
SD0.6410.359000000.359
DEN0.6540.320.0250.0010000.373
SF0.7430.2350.0220.0010000.281
DET0.7620.238000000.238
NE0.8320.1610.00700000.175
CIN0.8820.1140.00400000.123
KC0.8920.108000000.108
STL0.90.0970.00300000.103
GB0.9050.095000000.095
PHI0.9240.0750.00100000.077
CLE0.9650.035000000.035
HOU0.9720.028000000.028
TB0.9740.026000000.026
BUF0.9750.025000000.025
CHI0.9820.018000000.018
ATL0.9980.002000000.002
NYG10000000
NYJ10000000
SEA10000000

The True Team of the Decade: Pittsburgh Steelers
The Steelers had only a 14.5% chance of winning no Super Bowls in the ’70s and a 4.9% chance of winning the four that they did. The expected value of SB wins for Pittsburgh was 1.67, the highest value for any team in any decade.

The What-Might-Have-Been-Dynasty that Won Nothing: Minnesota Vikings
The Vikings are not too far away from the Steelers and Cowboys. There was only a 23.6% chance the Vikings would have won nothing in the ’70s. And they certainly could have won multiple championships. There was over a 35% chance the Vikings would have won at least two titles and a 9.6% chance they would have won at least three. Of all the teams that won nothing, the 1970s Vikings are the best candidate for the team that could have been the TOD.

The What-Might-Have-Been Dynasty that Won Nothing, Part 2: Los Angeles Rams

A little bit behind the Vikings are the Rams. Los Angeles had only a 39% chance of winning no Super Bowls in the ’70s and a 20.3% chance of winning multiple titles.

The Team that Wasn’t as Good as We Remember: Oakland Raiders
When I starting working with the data, I expected the Raiders to challenge for the TOD. Five losses in the AFC championship to go with the one title. Seven playoff appearances. Despite all that, the Raiders only had the sixth-most expected titles in the decade. In fact, they didn’t really underperform at all in terms of titles. They had a 39.5% chance of winning none at all. The Raiders’ SRS ratings explain this. Oakland was never really great, only passing +10.0 in a year (1977) where they finished second in the division.

Bottom-Feeder Teams: New York Giants, New York Jets
Only two teams played the entire decade and missed the playoffs every single year. They happened to be the two teams that played in New York. The chance that two teams would miss the playoffs every year and New York would happen to miss playoff football entirely: about 0.2%.

1980s

Team0123456E(Wins)
SF0.1460.3370.310.1560.0420.0070.0011.637
CHI0.2890.4810.1980.030.002000.975
MIA0.4160.3970.1540.0290.003000.805
WAS0.3920.450.1410.0170.001000.785
DEN0.4730.4020.1120.0120000.664
CLE0.5370.3710.0830.0090000.565
PHI0.5850.3550.0560.0030000.478
DAL0.6010.3290.0650.0050000.475
CIN0.6080.340.0510.0010000.446
NYG0.6250.3320.0420.0010000.419
OAK/LA0.6430.3020.050.0050000.417
SD0.70.2710.0280.0010000.329
BUF0.7070.2620.030.0010000.324
MIN0.7560.2250.0180.0010000.263
NYJ0.7720.210.01800000.247
ATL0.7840.2160.00100000.217
RAM0.8370.1520.0100000.174
NE0.8690.1290.00200000.134
NO0.8720.128000000.128
SEA0.9010.0970.00300000.102
GB0.9020.098000000.098
PIT0.9090.0880.00300000.094
TB0.930.07000000.071
HOU0.940.0590.00200000.062
BAL/IND0.9570.043000000.043
DET0.9720.027000000.028
KC0.9830.017000000.017
STL/PHX0.9970.003000000.003

The True Team of the Decade: San Francisco 49ers
Unlike the 1970s, the ’80s weren’t close. The Niners were similar to the ’70s Steelers with an expectation of 1.64 Super Bowl wins in the decade. The ’80s 49ers had about a 4.2% chance of winning the four Super Bowls they did and 51.7% chance of winning at least two. And, while not shown in the table above, it’s exciting to note that the Niners had a 0.004% chance of winning seven Super Bowls in the 1980s.

The What-Might-Have-Been-Dynasty that Won Nothing: Miami Dolphins
I was really surprised by this one. The Dolphins come in third in the 1980s in expected SB wins with 0.81. Based on their consistency in the first half of the decade, the Dolphins had an 18.6% chance of winning multiple Super Bowls in the 1980s. That’s substantially higher than the 12.4% chance for their nearest competitor: the much better-remembered Denver Broncos who were annihilated in three Super Bowls.

The Team that Wasn’t as Good as We Remember: Oakland/LA Raiders
Despite never being close to dominant, the Raiders won two Super Bowls in the 1980s. According to the number of SB wins we would have expected them to have, the Raiders actually rank 11th, behind six teams that won none in the decade. They had about a 5.5% chance of winning multiple titles in the decade.

A Bottom-Feeder Team: Houston Oilers
For teams that played every season since the merger, the Oilers had the least hope of winning a title over the 1970s and 1980s combined. That’s a little surprising given that they had at least one memorable moment in the playoffs during that stretch, unlike some of the teams ahead of them.

1990s

Team0123456E(Wins)
SF0.1510.3310.3080.1560.0460.0070.0011.639
DAL0.3120.4160.2160.0510.005001.023
GB0.3630.4870.1380.0110000.799
WAS0.3950.5630.0410.0010000.647
BUF0.5190.3710.0960.0140.001000.607
KC0.5130.3830.0950.0090000.601
DEN0.5520.3510.0860.010000.557
MIN0.550.3990.0490.0020000.504
PIT0.5930.3280.0720.0070000.495
RAM/STL0.5780.422000000.422
HOU/TEN0.6580.3010.0390.0020000.386
NYG0.7640.2260.0100000.247
JAC0.8020.1920.00600000.204
MIA0.8130.1730.0130.0010000.202
NYJ0.8010.199000000.2
LA/OAK0.830.1670.00300000.173
NE0.8420.1510.00700000.166
ATL0.850.1490.00100000.151
SD0.8660.1290.00500000.139
IND0.8660.1330.00100000.135
NO0.8710.1250.00300000.132
DET0.8860.110.00400000.118
CAR0.8990.101000000.101
PHI0.9050.0920.00300000.097
TB0.9160.0830.00100000.086
CLE/BAL0.9190.081000000.081
CHI0.9560.043000000.044
SEA0.9590.041000000.041
CIN0.9930.007000000.007
PHX/ARI10000000

The True Team of the Decade: San Francisco 49ers
This one almost leaps off the page. Not only were the Niners on top in the 1990s in terms of expected SB wins, they were way on top. Given the Cowboys’ relatively short run, it’s not surprising that they would do worse here, but they’re closer to the 10th place Rams on this list than they are to the 49ers. Even though they only won one in the decade, the Niners had the same number (1.64) of expected titles in the ’90s as they did in the ’80s, and a 51.7% chance of multiple titles.

The What-Might-Have-Been-Dynasty that Won Nothing: Buffalo Bills
The Bills actually do worse on this list than I would have expected. They were about even money to win the zero titles that they did in the ’90s. They had an 11.0% chance of winning multiple titles, making them the top-ranked no-title team of the ’90s, but ranking them well behind the ’70s Vikings, the ’70s Rams, and the ’80s Dolphins.

The What-Might-Have-Been-Dynasty that Won Nothing, Part 2: Kansas City Chiefs
On the field, the ’90s Chiefs only went to one AFC Championship game and no Super Bowls. Nevertheless, they’re about even with the Bills in terms of the Super Bowls they could have won. They had a 10.4% chance of winning multiple titles in the ’90s.

The Team that Wasn’t as Good as We Remember: Pittsburgh Steelers
I’m not sure there’s a great candidate in this category, so I was tempted to just pick the Raiders again to keep the pattern. You could go with Broncos here, but the 1998 Broncos are one case where there’s a clear gap between SRS and DVOA, which gives them more credit. The ’90s Steelers had four playoff byes in a run of six straight playoff appearances. Still, they had a 59.3% chance of winning no Super Bowls and only a 7.9% chance of winning multiple titles.

A Bottom-Feeder Team: Phoenix/Arizona Cardinals
The worst team in two consecutive decades. Over twenty years, the Cardinals had 0.003 expected titles. That’s only 0.003 more expected titles than the Houston Texans and they weren’t even in the league yet.

2000s

Team0123456E(Wins)
NE0.170.4160.2990.0980.0160.00101.38
IND0.4150.4020.1480.0310.004000.807
PHI0.4280.3990.1430.0270.003000.78
PIT0.4630.3990.1220.0160000.693
OAK0.4690.4320.0970.0020000.633
STL0.4940.4320.0720.0020000.584
TEN0.5780.3470.070.0050000.501
SD0.5890.3470.060.0040000.48
BAL0.6220.3160.0570.0050000.445
CHI0.6390.3190.0410.0010000.404
NYG0.6470.3070.0440.0030000.403
NO0.6410.3260.0330.0010000.393
GB0.6990.260.0380.0030000.344
TB0.710.2650.0240.0010000.316
DEN0.7160.2680.0160.0010000.3
SEA0.740.250.0100000.27
DAL0.7870.1990.01400000.227
MIN0.7880.1970.01400000.226
KC0.8010.1980.00100000.199
CAR0.8560.140.00400000.149
NYJ0.8690.1240.00600000.138
ATL0.9140.0830.00300000.088
MIA0.920.0790.00100000.082
WAS0.9520.048000000.049
SF0.9630.037000000.038
JAC0.9710.029000000.029
CIN0.9750.025000000.025
CLE0.9910.009000000.009
ARI0.9910.009000000.009
BUF10000000
DET10000000
HOU10000000

The True Team of the Decade: New England Patriots
Less dominant than the other True TODs, the Patriots of the aughts still have a healthy gap over their closest rival, the Colts. There was only a 17% chance the Patriots would have gotten shut out in the ’00s. There was a 41.7% chance that the Pats would win multiple titles in the decade, more than double the chance of any other team.

The What-Might-Have-Been-Dynasty that Won Nothing: Philadelphia Eagles
The Eagles rank third in expected titles in the ’00s with 0.78, just a hair behind the Colts for second. They also look similar to the 1970s Rams and 1980s Dolphins in terms of multiple-title potential. They had about a 17.4% chance of winning multiple titles in the aughts.

The Team that Wasn’t as Good as We Remember: Tampa Bay Buccaneers
Hopefully, it’s not too hard to remember a decade that ended with President Obama in the White House, but the Bucs come in lower here than I might have guessed. They made the playoffs five times, but still are only 14th in expected SB wins. They actually had a 71% chance of winning no titles in the decade. Even in their best year, 2002, where they ranked #2 in SRS and #1 in DVOA, they were far from dominant and so had only about a 21% chance of winning the title.

Bottom-Feeder Teams: Buffalo Bills, Detroit Lions
Neither team made the playoffs in the decade, a more impressive accomplishment than the ’70s Giants and Jets in an era of expanded playoffs. Both cities also suffered through deindustrialization and so seemed to deserve better football as a compensating differential.

Closing Thoughts

I was excited to check this out because I wanted to compare teams like the ’90s Bills and the ’70s Rams. That comparison makes it pretty clear that the ’70s Vikings are hands-down the clearest What-Might-Have-Been-Dynasty that Won Nothing. This is all post-merger, so arguably the best Vikings team of that era (the ’69 edition) doesn’t even count in the calculation. If you count the 1969 Vikings, there was only about a 1-in-6 chance that those Vikings would end up with no Super Bowls.

Maybe the most remarkable regularity over the years is how the Cardinals have been so bad for so long. Even though Arizona came close in 2008, the Cardinals had only an 11.2% chance of winning any of the last 44 Super Bowls. In fact, they were lucky just to make the one Super Bowl that they did (in more ways than one).

Finally, a couple of thoughts about this decade. While we’re only four years in, this decade could wind up resembling the 1990s. The Patriots right now are playing the role of the ’90s Niners, while the Seahawks may be the best candidate to be the Cowboys. So far, the Patriots have been (perhaps surprisingly) dominant. There’s only about a 27% chance that New England would have no titles in the 2010s and there was even a 28.5% chance that the Patriots would have already won multiple titles; that likelihood is more than four times more as any other team. Despite having none on the field through four seasons, the ’10s Patriots are on pace through four years to have the most expected SB wins for any decade. They already have 1.07 expected wins, more than double their nearest competitor.

{ 21 comments }

One Play Away

Football Perspective accepts guest posts, and Andrew Healy submitted the following post. And it’s outstanding. Andrew Healy is an economics professor at Loyola Marymount University. He is a big fan of the New England Patriots and Joe Benigno.


The Browns were one play away from the Super Bowl

How much did this player lower Cleveland's Super Bowl odds?

The Catch. The Immaculate Reception. The Fumble. We remember all these plays, but which mattered the most? More specifically, what plays in NFL history had the biggest impact on who won the Super Bowl?

The answer to this question is kind of surprising. For example, two of those famous plays are in the top 20, but the other wasn’t even the most important play in its own game. Going all the way back to Lombardi’s Packers, the memorable and important plays overlap imperfectly.

Here, I try to identify the twenty plays that shifted the probability of the eventual Super Bowl winner the most. According to this idea, a simple win probability graph at Pro-Football-Reference.com identifies a not-surprising choice as the most influential play in NFL History: Wide Right. What is surprising is that they give Buffalo a 99% chance of winning after Jim Kelly spiked the ball to set up Scott Norwood’s kick. Obviously, that’s way off. [1]I think it happens because their model basically gives you credit for your expected points on the drive, which is enough to win since Buffalo was down by a point.

A better estimate would say him missing the kick lowered the Bills chances of winning from about 45% to about 0%. Norwood was about 60% for his career from 40-49 yards out, and 2 for 10 from over 50. Moreover, he was 1 for 5 on grass from 40-49 before that kick. But the conditions in Tampa that night were close to ideal for kicking. It’s hard to put an exact number on things, but around 45% on that 47-yard kick seems about right.

So that 45 percentage point swing in a team’s chances of being the champ is what I’m going to call our SBD, or Super Bowl Delta, value. I’m going to identify the twenty plays with the biggest SBD values, the ones that swung the needle the most.

Here are the ground rules for making the cut. [continue reading…]

References

References
1 I think it happens because their model basically gives you credit for your expected points on the drive, which is enough to win since Buffalo was down by a point.
{ 20 comments }

Super Bowl XLVIII Denver/Seattle Preview

Before we get to my preview, I want to point you to some excellent Super Bowl previews I saw this week:

Last week, I went into the film room and recapped the preseason matchup between these two teams. Today, I’m going to analyze the six — yes, six! — different matchups to watch in Super Bowl XLVIII.

Seattle Pass Defense vs. Denver Pass Offense

I’ve written many glowing articles about the Seattle pass defense, and we all know about the Broncos record-setting offense. Super Bowl XLVIII is the greatest offense/defense showdown since 1950 and the greatest passing showdown ever. Denver’s pass offense is historically great, and Seattle’s pass defense is historically great. But beyond being a great defense, there are reasons to think the Seahawks present a particularly tough challenge for Manning and company. [continue reading…]

{ 4 comments }

sb xlviii squaresLast year, I wrote an article about Super Bowl squares. Well, it’s that time of year again, so here’s your helpful cheat sheet to win at your Super Bowl party.

Every Super Bowl squares pool is different, but this post is really aimed at readers who play in pools where you can trade or pick squares. I looked at every regular season and postseason game since 2002. The table below shows the likelihood of each score after each quarter, along with three final columns that show the expected value of a $100 prize pool under three different payout systems. The “10/” column shows the payout in a pool where 10% of the prize money is given out after each of the first three quarters and 70% after the end of the game; the next column is for pools that give out 12.5% of the pool after the first and third quarters, 25% at halftime, and 50% for the score at the end of the game. The final column is for pools that give out 25% of the pot after each quarter — since I think that is the most common pool structure, I’ve sorted the table by that column, but you can sort by any column you like. To make the table fully sortable, I had to remove the percentage symbols, but “19, 6.7, 4.1, 2” should be read as 19.0%, 6.7%, 4.1%, and 2.0%. [continue reading…]

{ 2 comments }

Regular readers know I’m not prone to exaggeration. I’m more of a splits happen kind of guy. But Super Bowl XLVIII will, in my opinion, be the greatest passing showdown ever. This year’s Super Bowl checks in as the greatest offensive/defensive showdown in Super Bowl history (and the greatest of any game, regular or postseason, since 1950). That’s because the passing showdown between Denver and Seattle is arguably the greatest of any game in all of pro football history.

How can we quantify such a statement? I’m glad you asked. If you recall, I labeled the 2013 Seahawks as one of the five greatest pass defenses since 1950. For new readers, Adjusted Net Yards per Attempt is calculated as follows:

[math]
(Gross Pass Yards + 20 * PTDs – 45 * INTs – Sack Yds)/(Attempts + Sacks)[/math]

In 2013, the Seahawks allowed 3.19 Adjusted Net Yards per Attempt (Seattle allowed 3,050 gross passing yards and 16 TDs, while forcing 28 interceptions and recording 298 yards lost on sacks, all over 524 pass attempts and 44 sacks.). The other 31 pass defenses allowed an average of 5.98 ANY/A, which means Seattle’s pass defense was 2.79 ANY/A above average. Over the course of the 568 opponent dropbacks, this means the Seahawks provided 1,582 adjusted net yards of value over average. In other words, the Seattle pass defense provided 99 adjusted net yards over average on a per game basis. Let’s be clear: the Legion of Boom is not just a hype machine, and Richard Sherman, Earl Thomas, Kam Chancellor, and company form the best secondary in the league.

All other passing attacks are pushed aside when Manning is involved.

All other passing attacks are pushed aside when Manning is involved.

Denver’s offense was even more dominant, although that’s to be expected: in general, the spread in offensive ratings is a bit wider than it is on the defensive side of the ball. Denver threw for 5,572 gross passing yards and 55 touchdowns, while throwing just 10 interceptions and losing only 128 yards to sacks. The Broncos had 675 pass attempts and were sacked just 20 times, giving them an 8.77 ANY/A average. The other 31 offenses averaged only 5.79 ANY/A, meaning the Broncos were 2.98 ANY/A better than average. Over the 695 dropbacks the team had, that means Denver provided 2,072 adjusted net yards of value average average. On a per-game basis, that’s 130 yards of value each game!

So, how do we judge the greatest passing showdowns in football history? Denver’s passing offense gets a rating of +130, while Seattle’s pass defense gets a rating of +99. Those two numbers have a Harmonic Mean of 112. That’s easily the most in Super Bowl history. In fact, it’s the third most in any playoff game ever, and those other two games each have asterisks.

In the 1961 AFL, the Houston Oilers behind George Blanda, Bill Groman, and Charley Hennigan possessed an incredible passing offense (rating of +167), while the San Diego Chargers had a dominant pass defense (+129). But in the early days of the AFL, the talent pool was diluted; this would be akin to comparing two teams in non-BCS conferences with out-of-this-world statistics to a matchup between champions in two power conferences. For what it’s worth, Houston won the game — played in San Diego — but with a catch. The Oilers offense was shut down, as Blanda went 18/40 for 160 yards with 1 touchdown and 5 interceptions…. but Houston won 10-3, as Jack Kemp threw four picks for the Chargers. [continue reading…]

{ 1 comment }

Earlier this week, I looked at how likely or unlikely the playoffs were in each of the last 25 seasons. Today, we look at each Super Bowl winner since 1978, and calculate their odds of winning each playoff game, and by extension, how likely (or unlikely) it was that that team wound up winning the Super Bowl.

As you might expect, no team was as unlikely to win the Super Bowl at the start of the playoffs as the 2007 New York Giants. If we know the points spread for a given game, we can derive the team’s probability of winning by using the following formula, assuming the spread (with a negative number for the favorite) is in cell C2 in Excel:

=(1-NORMDIST(0.5,-(C2),13.86,TRUE)) + 0.5*(NORMDIST(0.5,-(C2),13.86,TRUE)-NORMDIST(-0.5,-(C2),13.86,TRUE))

New York was a 3-point underdog in Tampa Bay in the Wildcard round (41.4%), a 7-point dog in Dallas (30.7%), and a 7.5-point underdog in Green Bay in the NFC Championship Game (29.4%). Then, in the Super Bowl against the 18-0 Patriots, the Giants were 12.5-point underdogs, implying an 18.4% chance of victory. The odds of New York winning all four of those games was less than one percent! I don’t think this was a case where the oddsmakers were off, either. Remember that in 2007, Eli Manning led the league in interceptions and the Giants were significantly worse in the regular season than Dallas, Green Bay, or New England. Even in retrospect, the Giants run was remarkable, but even unlikely events are likely to happen given a long enough time period. Of course, it sure seemed like unlikely events were becoming the norm in the playoffs, at least until 2013. [continue reading…]

{ 6 comments }

SB XLVIII Is The Best Offense/Defense Super Bowl Ever

This year, the Broncos averaged 37.9 points per game, 14.5 points more than league average. Seattle, meanwhile, allowed just 14.4 points per game, 9.0 points better than league average. That means this is a true clash of the titans in one sense: when the Broncos offense is on the field against the Seattle defense, the two units will have been a combined 23.4 (difference due to rounding) points better than average during the regular season.

As it turns out, that’s the greatest disparity between any two units in Super Bowl history. One nice aspect of comparing a team’s offense to an opponent’s defense is that you don’t need to adjust for era, since a high (or low) scoring environment will equally help and hurt each pairing. You can simply subtract Seattle’s 14.4 PPG average from Denver’s 37.9 PPG average to get that same 23.4 PPG difference. The table below shows the differential between each team offense and opposing defense — measured by points scored and points allowed per game — for each of the 48 Super Bowls. That means the Denver/Seattle battle will replace Super Bowl I for the greatest offense/defense showdown in Super Bowl history.

Here’s how to read the table below. In 1966, the Kansas City offense faced the Green Bay defense in Super Bowl I (hyperlinked to the boxscore at PFR). The Chiefs quarterback was Len Dawson, and Kansas City averaged 32 points per game that year. Meanwhile, the Packers allowed only 11.6 points per game, providing a difference of 20.4 points. In Super Bowl I, however, the Chiefs lost to the Packers, 35-10. This is the first time since Super Bowl XXV that the number one scoring offense is facing the number one ranked scoring defense, but frankly, the Bills/Giants showdown pales in comparison to this one. The difference there was nearly ten points narrower than the Denver/Seattle disparity. [continue reading…]

{ 11 comments }

Better than Elway?

Better than Elway?

Today’s title gives a pretty good hint as to what today’s post is about. The table below shows the career Approximate Value for the top 50 players whose last game happened to be a Super Bowl victory. For reference, I’ve also includes things like number of games, Pro Bowls, 1st-team All-Pro selections, and number of seasons starting.

In addition to Lewis, Matt Birk of the Ravens also joins the list, and for the heck of it, I’ve included Anquan Boldin, who has hinted that he might retire. Full disclosure: I defined a player as “retiring after winning the Super Bowl” if his last season came during a year in which he played for the eventual Super Bowl champ. So Wes Chandler, who played for the ’88 49ers but retired in mid-season, is included in this list even though he shouldn’t be. Ditto Michael Dean Perry, who was on the Broncos in 1997 but actually finished the season with the Chiefs. I could filter out all the Chandlers and Perrys of the world, but my time is better spent elsewhere (for that matter, just about every person’s time is better spent elsewhere), and therefore I’ll present the full, overinclusive list instead of spending an extra hour of time fixing it and possibly not presenting it at all.

The table is sorted by the Career AV column; the AV column shows the player’s AV in his final season.
[continue reading…]

{ 11 comments }

Emmitt knows the point of a good fullback.

Emmitt knows the point of a good fullback.

Ever wonder what percentage of Super Bowl champions had a Pro Bowl quarterback? Can you get by without a star-studded secondary? The table below shows the number of Pro Bowlers made at each position for each Super Bowl champion.

As it turns out, 30 of 47 Super Bowl champions saw their quarterback made the Pro Bowl. That doesn’t include the 2012 Ravens, as Joe Flacco was not a Pro Bowl selection, but it does include the ’69 Chiefs, the only team with two quarterbacks to make the Pro Bowl (Len Dawson and Mike Livingston). The Ravens did have two Pro Bowl running backs, though (Ray Rice and Vonta Leach), joining the ’93 Cowboys (Emmitt Smith, Daryl Johnston) and the ’72 and ’73 Dolphins (Larry Csonka, Mercury Morris) as the only Super Bowl champs with multiple Pro Bowl running backs.

Arguably the least represented position is cornerback, which might be relevant to yesterday’s post: the average Super Bowl champion had just 0.45 Pro Bowl cornerbacks, the lowest average among positions that always have multiple starters (as opposed to defensive tackles or inside linebackers). Both Charles Woodson and Tramon Williams made the Pro Bowl for the 2010 Packers, but eight of the last nine Super Bowl champions failed to place a single cornerback in the Pro Bowl in that season. The full table, below:
[continue reading…]

{ 6 comments }

Now that we live in a world where Joe Flacco and Eli Manning have quarterbacked 3 of the last 6 Super Bowl-winning teams, you might be tempted to think that winning a Super Bowl as a QB doesn’t mean what it used to. After all, the playoffs are getting more random — as Aaron Schatz pointed out last night, four of the last six Super Bowl champs have finished the regular season with 10 or fewer wins. So it stands to reason that, as the championship teams themselves post less-remarkable seasons, so too would their quarterbacks not be the cream of the crop. And for all of his postseason brilliance, Flacco was just the league’s 17th-best quarterback during the regular season. Does his ascendancy, coming on the heels of Manning’s, signal a new trend?

To answer that question, I turned to a methodology I’ve used many times before. The basic premise is that, to put modern and historical quarterbacks on an even playing field (no pun intended), you must translate their stats into a common environment. To do this, you take the quarterback’s stats from a given season, pro-rate to 16 scheduled games, and multiply by the ratio of the league’s per-game average during the season in question to that of a common reference season. For instance, if I’m adjusting Terry Bradshaw’s 1977 passing yards to the 1991-2012 period, I would multiply his actual total of 2,523 by (16/14) to account for the shorter season that year, then multiply that by (225.1/162.2) to account for the change in the league’s passing environment, giving an adjusted total of 4,001 yards.

After doing that for every QB season since the merger, I then plugged the translated stats into a regression formula that predicts Football Outsiders’ Yards Above Replacement based on the QB’s box score stats (including the standard cmp/att/yds/td/int, plus sacks, fumbles, and rushing stats). This gives us Estimated Yards Above Replacement (eYAR) a measure of total value for each QB season, adjusted for schedule length and league passing conditions, which is perfect for historical analysis.

To get an idea of what we’re talking about, here are Flacco’s career translated stats and eYAR numbers:
[continue reading…]

{ 6 comments }
Next Posts