≡ Menu

When Miami was blown out by Tennessee this weekend, I was shocked. So I cooked up a quick little way to measure how shocked I should have been. First, here are the SRS standings for the NFL through 10 weeks:

RkTeamGMOVSOSSRS
1Houston Texans911.6-0.311.3
2Chicago Bears911.8-0.910.9
3Denver Broncos99.41.310.7
4New England Patriots911.2-0.910.4
5San Francisco 49ers99.20.49.7
6Green Bay Packers95.41.77.1
7Atlanta Falcons98.4-2.36.1
8Seattle Seahawks103.72.15.8
9New York Giants105.105.1
10Baltimore Ravens96.1-2.33.8
11Tampa Bay Buccaneers95.3-2.23.1
12Dallas Cowboys9-0.83.62.8
13Pittsburgh Steelers93.7-3.30.4
14Detroit Lions90.3-0.30.1
15Minnesota Vikings101.1-10.1
16New Orleans Saints9-1.10.5-0.6
17San Diego Chargers92.3-3.4-1.1
18Washington Redskins9-2.10.9-1.2
19Carolina Panthers9-6.24.8-1.5
20St. Louis Rams9-5.84.1-1.7
21Arizona Cardinals9-3.61.6-2
22Cincinnati Bengals9-1.6-1.2-2.8
23Miami Dolphins9-1.1-3.1-4.2
24New York Jets9-6.21.9-4.3
25Indianapolis Colts9-2-3.4-5.4
26Buffalo Bills9-7.21-6.2
27Cleveland Browns9-5-1.3-6.3
28Philadelphia Eagles9-7.61-6.5
29Tennessee Titans10-9.21.6-7.6
30Oakland Raiders9-10-0.7-10.7
31Kansas City Chiefs9-11.9-0.7-12.6
32Jacksonville Jaguars9-13.60.6-13

Now the SRS weighs each game equally. This means that we can come up with a projected game score for each week, and see how close the actual result came to meeting our projection. For this iteration of the SRS, I am not using any caps or floors, and am giving the home team three points.
[continue reading…]

{ 7 comments }

Week 11 College Football SRS Ratings

Johnny Football, with his shirt on (for now).

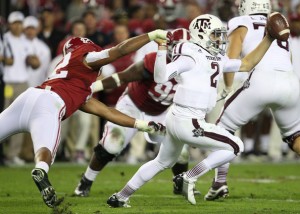
For the second straight season, the game of the year took place in Tuscaloosa. A week after Alabama eeked out a victory over LSU, and 53 weeks after Alabama loss to LSU in last year’s “Game of the Century”, Johnny Manziel produced one of the performances of the season in leading Texas A&M to an incredible upset victory. I have been a believer in the Aggies — they ranked 4th in my SRS ratings last week and remain there this week — but make no mistake, this was still an incredible upset. For a true freshman, on the road, against a Nick Saban defense, to go 24/31 for 253 yards and 2 TDs and to run 18 times for 92 yards is outstanding.

For now, the upset means we’re likely headed towards an SEC-free national championship game. This will anger some in the South, so I’ll take this time to remind you that the SEC’s record this year against the other BCS conferences is an incredibly dominant 4-5. Yes, the SEC has a losing record against the other top conferences in college football in 2011.

The bottom of the SEC has struggled considerably both in and out of conference — Auburn lost to Clemson, Vanderbilt to Northwestern, Kentucky to Louisville (and also to Western Kentucky), Ole Miss to Texas, and Arkansas to Rutgers (and also Louisiana-Lafayette). The positive side of the ledger isn’t all that impressive, unfortunately. Sure, Tennessee beat N.C. State, which would be impressive if not for the fact that the Wolfpack are 68th in the SRS. Yes, LSU beat Washington at home, but it’s LSU against the 8th best team in the Pac-12. Missouri over Arizona State and Alabama over Michigan are basically the two nonconference games the SEC can hang its hat on.

If Oregon wins out, they seem assured of getting one of the two golden tickets to Miami. Who will get the other? Obviously an undefeated Kansas State or Notre Dame would take one of the other spots. For now, K-State is ahead in the polls and the BCS standings, and gets the benefit of playing a streaking Texas team after the Fighting Irish have hung up their cleats for the year. According to the BCS Guru, Notre Dame is the clear third wheel.

But what if both Kansas State and Notre Dame lose? At that point, a one-loss SEC Champ — presumably Alabama — likely rises to number two. To that end, Alabama’s biggest friend right now is Lane Kiffin, who could knock off both Oregon and Notre Dame if USC wins out, setting up a Kansas State-Alabama title game.

And with that, a look college football’s SRS ratings after 11 weeks:
[continue reading…]

{ 6 comments }

A guide to Saturday’s games

The game of the day is in Tuscaloosa, as the #4 team in the SRS tries to ruin the perfect season of the best team in the country. Here’s a look at the weekly results for Alabama and Texas A&M, sorted from highest to lowest SRS score:

DateTeamPFOppPAH/RW/LDiffMOVSOSSRS
09-15-2012Alabama52Arkansas0RoadWin5239.542.782.2
09-01-2012Alabama41Michigan14Arlington TXWin2725.551.877.3
09-29-2012Texas A&M58Arkansas10HomeWin4834.542.777.2
10-13-2012Alabama42Missouri10RoadWin3229.547.376.8
09-15-2012Texas A&M48SMU3RoadWin453638.674.6
10-27-2012Alabama38Mississippi St7HomeWin312647.773.7
11-03-2012Texas A&M38Mississippi St13RoadWin252647.773.7
10-20-2012Alabama44Tennessee13RoadWin312944.773.7
10-27-2012Texas A&M63Auburn21RoadWin4234.537.672.1
09-08-2012Alabama35Western Kentucky0HomeWin352839.867.8
11-03-2012Alabama21LSU17RoadWin4757.164.1
09-29-2012Alabama33Mississippi14HomeWin191647.163.1
09-22-2012Alabama40Florida Atlantic7HomeWin332729.456.4
09-08-2012Texas A&M17Florida20HomeLoss-3-761.854.8
10-13-2012Texas A&M59Louisiana Tech57Shreveport LAWin2747.554.5
10-06-2012Texas A&M30Mississippi27RoadWin3747.154.1
09-22-2012Texas A&M70South Carolina St14HomeWin5638.514.553
10-20-2012Texas A&M19LSU24HomeLoss-5-857.149.1

Both teams blew out Arkansas in September and then embarrassed Mississippi State the last two weeks. Both Alabama and Texas A&M played their worst games of the year against LSU. The Aggies are a 13.5-point underdog, and it seems absurd to think that college football’s version of what it would look like if the Eagles and Chargers could have a baby could upend the mighty Crimson Tide, but it’s November. That generally means expect the unexpected.

Louisville @ Syracuse

The Cardinals look to keep their dream season alive in what looks to be an easy matchup on paper. Louisville is 9-0 and Syracuse is 4-5, so this should be a gimme, right? Except in Vegas, the line is just Syracuse -1.5. Many college football fans are calling this the oddest line of the week, but fans of the SRS would disagree. The SRS is predictive and doesn’t care about your record; it is intended to tell us how well teams will play in the future, and as a result, often mirrors the point spread in a game. Well, the SRS says Louisville should be favored by just 2.4 points despite the much more impressive record. You can view every college football game score here, which helps explain why Syracuse isn’t the pushover you might expect them to be. Syracuse has lost just one home game this season, a 42-41 game against Northwestern that ended in controversial fashion. Against the other cream of the conference, the Orange lost on the road by 8 against Rutgers and 11 against Cincinnati.

Meanwhile, Louisville beat Cincinnati at home by 3, and defeated North Carolina two months ago, but otherwise, doesn’t have any impressive wins on its resume. And it was only three weeks ago that Louisville was trailing in the final two minutes, at home, to South Florida. The Cardinals have played just three road games this season, against teams that are a combined 6-22. I think Vegas has this line appropriately placed; it’s close to a toss-up game, although I’d obviously favor the Cardinals.
[continue reading…]

{ 1 comment }

Sunday morning, I noted that the Falcons had a 2.4% chance of going undefeated and that the team most likely give them their first loss was the Dallas Cowboys. After Atlanta’s victory on Sunday night, they halfway to perfection. This is the first time in franchise history the Falcons have started off 8-0, although star tight end Tony Gonzalez once played on a 9-0 team and Matt Ryan went 8-0 in 2007 at Boston College. After the victory over the Cowboys, what is the current probability that Atlanta goes 16-0?

First, we need to calculate SRS standings. Neil gave us his Weighted SRS Ratings earlier today, but the table below shows the vanilla SRS ratings:

RkTeamGMOVSOSSRS
1San Francisco 49ers810.81.111.8
2Chicago Bears814.5-2.811.7
3New England Patriots812.3-1.510.7
4Houston Texans811.8-2.19.6
5Denver Broncos87.51.69.1
6New York Giants97.318.4
7Atlanta Falcons89.6-2.37.4
8Green Bay Packers95.41.67
9Seattle Seahawks92.13.25.3
10Tampa Bay Buccaneers85.1-1.83.3
11Dallas Cowboys8-3.15.72.6
12Pittsburgh Steelers84.1-2.12.1
13Miami Dolphins83.4-2.31
14Detroit Lions81.3-0.50.7
15Baltimore Ravens82.9-2.20.7
16Carolina Panthers8-3.94.50.6
17Washington Redskins9-2.11.2-0.9
18Minnesota Vikings90.4-1.3-0.9
19Arizona Cardinals9-3.62.1-1.5
20New Orleans Saints8-1.4-0.3-1.7
21San Diego Chargers83.5-5.3-1.8
22New York Jets8-4.82.6-2.1
23St. Louis Rams8-6.94.3-2.6
24Philadelphia Eagles8-6.31.1-5.2
25Cincinnati Bengals8-3.6-1.9-5.5
26Indianapolis Colts8-4.8-1.9-6.6
27Cleveland Browns9-5-2.6-7.6
28Oakland Raiders8-7.3-0.7-7.9
29Buffalo Bills8-7.8-0.8-8.5
30Jacksonville Jaguars8-12.81-11.7
31Tennessee Titans9-14.31.9-12.4
32Kansas City Chiefs8-13.4-1.3-14.7

[continue reading…]

{ 3 comments }

Here’s my weekly set of power ratings, according to a weighted version of the Simple Rating System:

RkTeamWLTalentPWAGOffDefSRSwpa_locwpa_vegwpa_1stwpa_2ndwpa_3rdwpa_4ot
1Chicago Bears710.65867.7%6.0-6.012.00.0000.9220.802-0.3490.4581.167
2San Francisco 49ers620.60562.3%0.3-11.511.70.0001.2350.0880.1890.576-0.087
3New England Patriots530.55366.7%9.6-1.010.7-0.0671.4080.7120.3040.368-1.724
4Houston Texans710.65864.1%4.1-5.69.70.1351.6480.0740.7800.2540.110
5Denver Broncos530.55350.1%6.0-3.39.30.0000.213-0.398-0.6040.2081.581
6New York Giants630.57560.4%7.8-0.68.40.0670.5280.2520.450-0.2070.410
7Green Bay Packers630.57566.0%6.6-0.67.20.0671.4310.7560.011-0.463-0.302
8Atlanta Falcons800.71175.4%3.8-3.27.10.0000.6880.7350.4840.4181.675
9Seattle Seahawks540.52550.1%-1.2-6.14.9-0.067-0.2920.770-0.4240.1510.362
10Tampa Bay Buccaneers440.50048.4%4.30.63.70.000-0.5540.831-0.2201.095-1.153
11Pittsburgh Steelers530.55363.6%-1.8-4.02.2-0.1350.6250.2480.2460.0070.010
12Dallas Cowboys350.44742.7%-1.5-3.62.1-0.1350.160-0.322-0.5750.531-0.658
13Carolina Panthers260.39531.6%-2.6-3.81.20.000-0.439-0.7660.8030.153-1.751
14Miami Dolphins440.50046.8%-2.4-3.41.0-0.135-0.3710.1581.2010.945-1.799
15Detroit Lions440.50049.6%2.82.00.8-0.1350.335-0.426-0.728-0.4811.435
16Baltimore Ravens620.60568.0%1.41.5-0.10.0000.678-0.1170.429-0.0371.047
17New Orleans Saints350.44753.8%4.45.3-0.90.0000.425-0.152-0.350-0.078-0.846
18Minnesota Vikings540.52544.9%-0.10.9-1.10.0670.2380.301-0.344-0.2830.520
19Washington Redskins360.42537.7%1.83.0-1.2-0.067-0.410-0.2210.3281.173-2.303
20New York Jets350.44748.7%0.11.8-1.70.135-0.642-0.396-0.278-0.5150.695
21San Diego Chargers440.50051.2%-3.3-1.4-1.90.0000.5380.6390.2740.319-1.771
22Arizona Cardinals450.47544.0%-5.7-3.2-2.50.067-0.935-0.356-0.125-0.3561.205
23St Louis Rams350.44738.0%-4.2-1.4-2.80.067-1.223-0.1240.027-0.2950.548
24Cincinnati Bengals350.44741.3%1.26.3-5.10.000-0.0440.6590.152-1.164-0.604
25Philadelphia Eagles350.44747.5%-6.1-0.6-5.50.0000.452-1.300-0.5860.675-0.241
26Indianapolis Colts530.55351.3%-4.11.7-5.80.135-0.8120.623-0.7970.3391.512
27Cleveland Browns270.37531.5%-6.80.4-7.20.067-1.406-0.514-0.7010.163-0.109
28Oakland Raiders350.44745.1%-0.37.3-7.50.000-0.298-0.1940.182-1.9581.268
29Buffalo Bills350.44738.4%-0.28.6-8.8-0.135-0.4750.1910.1150.035-0.731
30Jacksonville Jaguars170.34232.8%-9.12.6-11.70.000-1.202-0.242-0.449-0.187-0.921
31Tennessee Titans360.42541.6%-2.010.2-12.10.067-1.401-0.9790.688-0.7050.830
32Kansas City Chiefs170.34236.9%-8.86.3-15.00.000-1.021-1.332-0.132-1.1400.626

KEY:
Talent – Regressed WPct talent for 2012; Talent = (W + 5.5) / (G + 11)
PWAG – Probability of Winning Any Game
Off – Offensive SRS (positive = better)
Def – Defensive SRS (negative = better)
SRS – Simple Rating System (Off + Def)
wpa_loc – Win Probability Added from location of games
wpa_veg – Win Probability Added from Vegas lines
wpa_1st – Win Probability Added in 1st quarter
wpa_2nd – Win Probability Added in 2nd quarter
wpa_3rd – Win Probability Added in 3rd quarter
wpa_4ot – Win Probability Added in 4th qtr/overtime

{ 4 comments }

There were close calls in Baton Rouge and in South Bend, but all six undefeated teams escaped week 10 without a blemish. Ohio State is now the first team to win 10 games in 2012, although the Buckeyes are not eligible to participate in postseason play. Louisville ran its record to 9-0 yesterday, with winnable games against Syracuse and Connecticut before a season-defining finale in Piscataway on November 29th.

However, the eyes of the country are now focused on Notre Dame, Kansas State, Oregon, and Alabama. Last weekend, I said there was only a 10% chance that Oregon, Kansas State, and Notre Dame would finish the season undefeated. That was with 13 games left for those teams to win; now those odds are close to 17%. Kansas State has the easiest remaining path, although all three of its remaining opponents have realistic chances of pulling an upset. Oregon has a relatively easy game against Cal this week while Notre Dame shouldn’t have any problem with Boston College.

Alabama has another tough challenge this week in Texas A&M, although it is hard to imagine college football’s most inconsistent team of the last two years winning a close match-up against the country’s most consistent and brutal opponent. If Alabama can defeat the Aggies this weekend, a perfect regular season is all but assured, with the Crimson Tide’s final two games coming against Western Carolina (SRS of 11.6) and Auburn (37.6). The Iron Bowl this year should be more coronation than battle, which leaves just Texas A&M and Georgia — the likely opponent in the SEC Championship Game — as the two remaining hurdles for Alabama to clear.

Here are the week 10 SRS ratings: [continue reading…]

{ 2 comments }

In this post by Neil, he provided a formula to predict each team’s likelihood of winning a game based on the Vegas point spread. With the help of the SRS, we can come up with a projected point spread for each game, and therefore figure out which team is most likely to give the Falcons their first loss.

The table below shows the SRS rating for Atlanta and each of their remaining opponents, along with the projected point spread in the game (based on the difference between the two SRS scores and home field) and the concomitant projected win probability. Note that in the Dallas game, the projected line is Atlanta -8.6, which would yield a 73.2% win probability; since the actual line is Atlanta -4, for the purposes of that game, I will be using the real line and not the projected one.

WkOppATL SRSOPP SRSProj LineWin Prob
9Dallas Cowboys7.51.9-461.3%
10@New Orleans Saints7.5-3.3-7.871.3%
11Arizona Cardinals7.5-0.6-11.178.8%
12@Tampa Bay Buccaneers7.53.1-1.454%
13New Orleans Saints7.5-3.3-13.884%
14@Carolina Panthers7.5-1-5.565.4%
15New York Giants7.510-0.551.4%
16@Detroit Lions7.5-0.5-564.1%
17Tampa Bay Buccaneers7.53.1-7.470.3%

As you can see, the Falcons are projected to be a favorite in every remaining game, with the Giants game looming as the most difficult challenge. The probability of Atlanta winning each of their remaining 9 games is only 2.4%.

But figuring out which team is most likely to be the first to defeat the Falcons is a trickier question. The Cowboys are the obvious pick, in part because they’re up first and in part because they’re one of the most challenging remaining opponents for the Falcons. What are the odds that the Giants become the first team to knock off the Falcons, like they did to the Patriots in ’07 and the Broncos in ’98? For that to happen, the Giants would need to beat Atlanta (51.4%) plus the Falcons would need to beat Dallas, Arizona, Tampa Bay, Carolina, and New Orleans twice before their game with New York. The probability of Atlanta winning all of those games is just 10.2%, so there is only a 1-in-20 chance that New York performs its giant-killer act again.

To calculate the odds of the opponent in each week being “the team” to knock off the Falcons, we simply have to perform the same math. Therefore, the table below shows the likelihood of Atlanta first losing (in each week) to each team:

WkOpponentProb
9Dallas Cowboys38.7%
10New Orleans Saints17.6%
12Tampa Bay Buccaneers15.9%
11Arizona Cardinals9.3%
14Carolina Panthers5.4%
15New York Giants5%
13New Orleans Saints3%
16-0Undefeated2.4%
16Detroit Lions1.9%
17Tampa Bay Buccaneers1%

Even though they’re not favored to win the game, since we can’t pick “the field”, the Cowboys are the team most likely to ruin the Falcons’ perfect season. As of today, New Orleans is next with a 20.6% chance thanks to two bites at the apple; meanwhile, the Falcons are more likely to go undefeated than they are to go 14-0 only to have the Lions ruin perfection.

{ 2 comments }

November 3rd has been circled on the calendars of college football fans for nearly a year. Unfortunately, the two biggest games of the day — Alabama/LSU and Oregon/USC — will compete for the eyeballs of the nation. The Ducks and Trojans kick off at 7PM on the East Coast, with the Crimson Tide stealing our attention one hour later. Making matters worse, the #3 team in the country will be playing in the 8PM time slot, too, as Kansas State hosts Oklahoma State. So with a lot of interesting games this weekend, I thought I’d take a look at my thoughts on each game involving an eligible, undefeated team on Saturday in relation to two key metrics: the SRS ratings and the Vegas lines. I’ll also make heavy use of the Game Scores page, which lists every game from this season for all FBS teams.

Temple at Louisville, 12PM (all times Eastern)

Louisville SRS: 43.7
Temple SRS: 31.5
Projected SRS line: Louisville -15.2
Actual line: Louisville -16.5

Temple had been respectable early this year (minus an ugly home loss to Maryland) but has been miserable the last two weeks, likely driving this line up. The Owls were up 10-0 at halftime being being routed 35-10 by Rutgers at home two weeks ago, and then last week lost by 30 at a terrible Pittsburgh team. Louisville is not great, but they should be able to handle Temple with ease. No thoughts on the point spread, though, which seems right to me.

Pittsburgh at Notre Dame, 3:30PM

Notre Dame SRS: 63.1
Pittsburgh SRS: 37.5
Projected SRS line: Notre Dame -28.6
Actual line: Notre Dame -16.5

Why is this line the same as Louisville-Temple? The only explanations I can think of are: (1) Pittsburgh just played its best game of the week (SRS score of 57.0) in a win over Temple and (2) Notre Dame hasn’t earned the public’s trust just yet. But with the exception of a squeaker over Purdue in week two, the Fighting Irish have been very good each week. They beat Michigan State by 17 (SRS score of 67.5), Michigan by 7 (58.2), Miami by 38 (73.0), Stanford by 7 (60.8), BYU by 3 (51) and Oklahoma by 17 (82.9). Maybe some of those scores are a little inflated — the Hurricanes have several drops and an injured quarterback, the Stanford game was in overtime, the Oklahoma game was closer than the score — but that’s picking nits, in my opinion. This is a ridiculously good defense playing a Pittsburgh team that scored 20 points in its last road game, which was at Buffalo. The Panthers were horrrrrrrrible with probably more Rs than that the first two weeks of the season, losing to FCS Youngstown State and Cincinnati by a combined 38 points. But even if we threw those games out, the SRS would still say the Fighting Irish should be favored by at least three touchdowns.

The pick: Notre Dame -16.5

[continue reading…]

{ 1 comment }

Neil once pointed out, that you can approximate a team’s odds of winning a game by using the point spread and the following formula:

p(W) = 1 – (1-NORMDIST(0.5,SPREAD,13.86,TRUE))+0.5*(NORMDIST(0.5,SPREAD,13.86,TRUE)-NORMDIST(-0.5,SPREAD,13.86,TRUE))

For college football games, there is research by Wayne Winston and Jeff Sagarin that the standard deviation in the above formula should be 16 instead of 13.86. One of the nice things about the SRS is that it comes very close to approximating the point spread in each game. If we give 3 points to the home team, we can then approximate each team’s likelihood of winning in their remaining games.

For example, here is a look at Oregon’s remaining schedule and their likelihood of winning each game. Note that for now, I am assuming that the Ducks host the Trojans in the Pac-12 Championship Game:

TmOppLocSRS TmSRS OppProj SpreadWin Prob
OregonSouthern CalRoad65.953.9-8.971.2%
OregonCaliforniaRoad65.942.3-20.690.1%
OregonStanfordHome65.953.8-1582.6%
OregonOregon StRoad65.955.2-7.768.4%
OregonSouthern CalHome65.953.9-14.982.5%
Total29.9%

Winning five games in a row isn’t easy, even for a team as good as Oregon. With four difficult games left, the odds of them going 5-0 are just 29.9%. Things are much more favorable for Kansas State:

TmOppLocSRS TmSRS OppProj SpreadWin Prob
Kansas StOklahoma StHome66.352.5-16.985.4%
Kansas StTCURoad66.346.2-17.185.7%
Kansas StBaylorRoad66.346-17.486.1%
Kansas StTexasHome66.352.1-17.285.9%
Total54.1%

The Big 12 has some good teams, but Kansas State appears to be an elite one. My gut tells me the SRS is underrating the likelihood of one of those teams pulling off an upset, but there’s no doubt that Kansas State would be a double-digit favorite against each of those teams right now. Of course, one thing the SRS ignores in all of these instances is the possibility of a key injury affecting any team.

Notre Dame has a history of dropping games to bad teams, but I don’t think there’s much of a chance the Fighting Irish lose any of their next three games. That means the USC game should have national title implications:

TmOppLocSRS TmSRS OppProj SpreadWin Prob
Notre DamePittsburghHome63.137.2-28.996.5%
Notre DameBoston CollegeRoad63.131.1-29.196.5%
Notre DameWake ForestHome63.127.9-38.399.2%
Notre DameSouthern CalRoad63.153.9-6.265.1%
Total60.1%

There is only a 10% chance (29.9% * 54.1% * 60.1%) that Oregon, Kansas State and Notre Dame all finish the season undefeated, at least according to the assumptions in this post. If you want to look at how all three teams got here, you can check all the NCAA game scores here.

{ 7 comments }

Week 9 SRS Ratings: When Will Oregon Stop Scoring?

Oregon’s offense is ridiculous, and its defense and special teams aren’t far behind. Entering this weekend, Oregon had outscored opponents 234-46 … in the first half. Prior to their game against Colorado, Bill Connelly ranked Oregon as the third best defense in college football. Against the horrible Buffaloes, the Ducks didn’t disappoint.

Oregon jumped out to a 28-0 lead after the first quarter, and led 56-0 by halftime. Backup quarterback Bryan Bennett led the team with three touchdowns in the 70-14 rout. De’Anthony Thomas rushed for 97 yards on five carries and scored on a 73-yard punt return. Kenjon Barner had 9 carries for 104 yards and 2 touchdowns, and if not for the one-yard score, would have averaged 12.9 yards per carry; he also caught a 48-yard pass.

For the Ducks, this was a going-through-the-motions victory against a very overmatched opponent. Soon, though, we’ll find out a little more about the Ducks. On Saturday, they go to Los Angeles to face a talented but inconsistent USC team. And while California isn’t a serious threat, the Ducks close with games against Stanford and Oregon State, who may at least be able to slow down the mighty Ducks offense. For now, though, Oregon looks like the one hope to make for an exciting BCS National Championship Game.

We can assume Alabama will take one spot, with Oregon, Kansas State and Notre Dame battling for the other golden ticket. The odds of another all-SEC title game dropped with the Florida loss to Georgia. That’s because the Bulldogs now have the inside track on winning the SEC East, with a head-to-head victory over Florida. South Carolina beat Georgia, but UGA will essentially win the division due to luck of the draw. South Carolina drew Arkansas and LSU in Baton Rouge from the SEC West this year, while Georgia gets to play Ole Miss and Auburn — their final two conference opponents. Assuming the Bulldogs can take care of business against Ole Miss next week, their ticket to Atlanta should be secure. Considering Florida could have boosted their SOS against Florida State — and also faced and defeated LSU — replacing Florida with Georgia as the SEC East champion lowers the odds of that division sending a team to Miami.

Without further ado, below are the week 9 SRS ratings. As always, thanks to Dr. Peter R. Wolfe for publishing his game results.
[continue reading…]

{ 3 comments }

Here are the current SRS Ratings, weighted for the recency of each game, along with each team’s quarter-by-quarter Win Probability Added (WPA) so far this season:

RankTeampfr_idOSRSOSOSDSRSDSOSSRSSOSwpa_locwpa_vegaswpa_1stwpa_2ndwpa_3rdwpa_4th/ot
1Chicago Bearschi7.91.08.0-1.415.9-0.4-0.0680.4760.1280.0170.7290.219
2San Francisco 49erssfo-0.2-0.111.42.211.22.00.0680.956-0.0660.0590.566-0.083
3Houston Texanshtx6.9-1.04.2-0.211.1-1.20.0681.419-0.0380.9430.127-0.020
4Green Bay Packersgnb7.53.92.81.910.45.7-0.0680.9260.596-0.011-0.446-0.498
5New York Giantsnyg7.71.62.3-1.610.0-0.10.0680.351-0.0600.2780.0290.834
6Denver Broncosden5.2-0.11.61.56.81.40.000-0.060-0.644-0.8160.1831.338
7New England Patriotsnwe7.4-0.4-0.7-0.36.7-0.7-0.0681.2090.737-0.0170.363-1.724
8Seattle Seahawkssea-2.74.18.70.75.94.8-0.068-0.3350.708-0.588-0.0940.877
9Atlanta Falconsatl2.5-2.53.2-1.25.7-3.60.0000.6320.5250.1990.4041.240
10St Louis Ramsram-2.22.65.21.93.04.60.068-1.039-0.1430.348-0.2830.550
11Minnesota Vikingsmin-0.6-1.33.2-1.32.6-2.60.0680.2110.835-0.3620.0750.673
12Washington Redskinswas5.80.6-3.21.92.62.5-0.068-0.3810.1720.6971.235-2.155
13Dallas Cowboysdal-0.73.32.51.51.74.9-0.1360.365-0.216-0.3590.0510.295
14Arizona Cardinalscrd-4.61.25.0-1.10.40.10.068-0.452-0.0850.088-0.3311.212
15Miami Dolphinsmia-2.90.43.1-0.90.2-0.50.000-0.549-0.0110.7261.272-1.436
16Tampa Bay Buccaneerstam-0.6-2.70.80.50.1-2.20.136-0.5310.583-0.2760.276-1.188
17New York Jetsnyj0.00.60.11.00.11.50.068-0.605-0.080-0.084-0.4950.695
18Baltimore Ravensrav0.2-0.8-1.5-1.1-1.3-1.90.0680.536-0.4520.5870.0570.705
19New Orleans Saintsnor5.6-0.7-7.2-0.4-1.6-1.20.0000.552-0.193-0.476-0.019-0.864
20Detroit Lionsdet4.92.9-6.5-2.4-1.60.5-0.0680.249-0.313-0.833-0.3530.819
21Pittsburgh Steelerspit-2.5-2.60.1-1.3-2.4-3.9-0.1360.700-0.0270.2900.163-0.991
22San Diego Chargerssdg-2.3-3.8-0.4-0.1-2.7-3.90.0000.2020.7530.2140.294-1.463
23Carolina Pantherscar-4.11.50.71.4-3.42.90.136-0.246-0.8330.124-0.212-0.968
24Philadelphia Eaglesphi-6.6-0.62.50.3-4.0-0.40.0000.466-0.675-0.2960.729-0.224
25Indianapolis Coltsclt-3.20.7-3.1-0.4-6.30.30.136-0.5920.446-0.291-0.0660.367
26Cincinnati Bengalscin-0.9-1.2-5.7-2.6-6.7-3.8-0.0680.0090.7620.304-1.197-0.311
27Cleveland Brownscle-5.1-3.0-2.6-0.1-7.7-3.1-0.068-1.153-0.411-0.8000.161-0.229
28Oakland Raidersrai-3.40.6-6.6-1.5-10.0-0.90.000-0.368-0.3900.014-1.5291.272
29Buffalo Billsbuf1.10.0-11.1-1.9-10.0-1.9-0.068-0.3030.313-0.0340.180-0.589
30Tennessee Titansoti-3.0-1.6-8.42.1-11.40.5-0.068-1.194-0.5960.449-0.6671.576
31Jacksonville Jaguarsjax-8.8-0.3-3.31.0-12.10.80.000-0.647-0.229-0.144-0.227-0.754
32Kansas City Chiefskan-8.9-2.6-6.11.0-15.0-1.60.000-0.802-1.0940.049-0.9770.823
{ 7 comments }

I didn’t think this was possible.

In 2009, Alabama had an incredible defense, ranking 1st or 2nd in points allowed, yards allowed, first downs allowed, completion percentage allowed and rushing yards allowed en route to a 14-0 season and a national title. In the 2010 draft, Rolando McClain and Kareem Jackson went in the first round, Javier Arenas and Terrence Cody in the second, and Marquis Johnson and Brandon Deaderick in the seventh. In 2010, a young Alabama defense wildly exceeded all expectations — how could they lose so much talent and still dominate? — but the team did regress and finished the year 10-3.

Last year, as the younger defense matured, Alabama had one of the greatest defenses in the history of college football. The Crimson Tide allowed a miniscule 8.2 points per game, by far the fewest in college football. Alabama’s defense also ranked 1st by large margins in rushing yards per game, passing yards per game, and first downs per game. But then Mark Barron, Dre Kirkpatrick, Dont’a Hightower, and Courtney Upshaw were top 35 picks in the NFL draft this year, while cornerback DeQuan Menzie and defensive tackle Josh Chapman were fifth round picks. With six defensive starters for the Crimson Tide getting drafted in 2012 — including five members of the first- or second-team All-SEC defense from 2011 [1]Upshaw and Barron were All-SEC first team selections by the AP, and Chapman, Hightower and Kirkpatrick earned second-team honors. — 2012 should have represented a significant step backwards for what was a historically dominant defense.

But the Crimson Tide death star is at full throttle now. After winning on the road at Tennessee and sucking the life out of another offense — and the Vols have one of the most explosive offenses in the SEC — Alabama continues to look invincible. While every other team in college football has question marks, Alabama has allowed just 8.3 points per game this year and has a mercilessly efficient offense. Quarterback A.J. McCarron still hasn’t thrown an interception in 2012.

Here’s a look at the SRS ratings after eight weeks. As a technical matter, two 7-0 teams square off in Tuscaloosa next week. But according to the SRS, Alabama should be expected to win by about 24 points.

[continue reading…]

References

References
1 Upshaw and Barron were All-SEC first team selections by the AP, and Chapman, Hightower and Kirkpatrick earned second-team honors.
{ 8 comments }

Here are the current SRS Ratings, using the recency-weighted system I described on Monday:

RankTeampfr_idOFFSRSOFFSOSDEFSRSDEFSOSSRSSOS
1Chicago Bearschi7.50.27.6-1.915.1-1.8
2New York Giantsnyg9.93.12.8-1.712.71.4
3San Francisco 49erssfo-0.10.110.92.010.82.1
4New England Patriotsnwe8.90.2-0.3-0.68.6-0.4
5Green Bay Packersgnb5.32.02.01.67.33.7
6Seattle Seahawkssea-2.63.99.11.16.45.0
7Houston Texanshtx4.4-1.31.5-1.55.9-2.8
8Denver Broncosden4.5-1.01.01.05.50.0
9Atlanta Falconsatl1.8-3.33.5-0.75.2-4.0
10Tampa Bay Buccaneerstam-0.6-1.84.41.63.8-0.2
11St Louis Ramsram-2.82.26.61.53.83.7
12Dallas Cowboysdal1.45.12.03.03.58.1
13Baltimore Ravensrav1.4-1.52.0-0.93.4-2.5
14Arizona Cardinalscrd-3.71.75.5-0.81.80.8
15Washington Redskinswas7.41.0-5.8-0.21.60.8
16Minnesota Vikingsmin-2.3-3.72.9-0.50.7-4.2
17Miami Dolphinsmia-2.70.42.3-1.5-0.4-1.1
18Detroit Lionsdet5.32.9-7.5-3.5-2.2-0.6
19Carolina Pantherscar-2.32.7-0.12.1-2.34.8
20New York Jetsnyj-2.1-0.5-0.7-0.2-2.8-0.8
21Philadelphia Eaglesphi-6.5-0.73.71.6-2.81.0
22San Diego Chargerssdg-2.4-4.0-1.6-1.1-4.0-5.1
23Cincinnati Bengalscin0.2-1.9-4.9-1.6-4.7-3.5
24Pittsburgh Steelerspit-2.1-2.4-2.7-3.1-4.8-5.5
25New Orleans Saintsnor2.6-2.3-7.60.0-5.0-2.3
26Cleveland Brownscle-2.1-1.8-3.11.3-5.2-0.5
27Buffalo Billsbuf1.01.3-9.4-1.0-8.40.4
28Indianapolis Coltsclt-2.01.5-6.7-0.5-8.61.0
29Oakland Raidersrai-4.60.6-6.20.0-10.90.6
30Kansas City Chiefskan-7.4-1.2-6.60.6-14.0-0.7
31Jacksonville Jaguarsjax-10.60.1-3.41.7-14.01.8
32Tennessee Titansoti-5.1-1.2-8.91.7-14.00.5

Also, just for fun, here’s how SRS sees this weekend’s games going (with the Vegas lines and over/unders for comparison’s sake):

game_idyear_idgame_datehome_teamsrsaway_teamsrsvegas_linevegas_o/usrs_linesrs_o/u
201210220chi201210/22/2012chi15.1det-2.2-5.047.5-19.658.9
201210210nyg201210/21/2012nyg12.7was1.6-6.550.0-13.566.5
201210210buf201210/21/2012buf-8.4oti-14.0-3.046.5-7.960.3
201210210tam201210/21/2012tam3.8nor-5.03.049.5-11.151.4
201210210min201210/21/2012min0.7crd1.8-6.040.5-1.231.8
201210210clt201210/21/2012clt-8.7cle-5.2-3.045.01.251.9
201210210cin201210/21/2012cin-4.7pit-4.82.546.0-2.452.0
201210210nwe201210/21/2012nwe8.6nyj-2.8-10.547.5-13.854.0
201210210ram201210/21/2012ram3.8gnb7.35.544.51.240.1
201210210rai201210/21/2012rai-10.9jax-14.0-4.043.0-5.540.7
201210210car201210/21/2012car-2.4dal3.52.045.53.543.5
201210210htx201210/21/2012htx5.9rav3.4-6.048.0-4.848.5
{ 7 comments }

Here’s a quick Monday data dump… I ran the Simple Rating System (for offense and defense) on this year’s NFL results, but instead of weighing each game equally, I used Wayne Winston’s method of giving more weight to recent outcomes. Winston’s system is simply to give each game a weight of:

λ ^ (weeks ago)

In the NFL’s case, a λ of 0.95 works best for predicting future outcomes. The games from yesterday were (6 – week 6) = 0 weeks ago, so they get a weight of .95 ^ 0, or 1.00. Last week’s games were (6 – week 5) = 1 week ago, and get a weight of .95 ^ 1 = 0.95; the opening-week games were (6 – week 1) = 5 weeks ago, and get a weight of .95 ^ 5 = 0.77. See how it works?

Using this weighted form of SRS, here are the rankings going into tonight’s game (NOTE: For defenses, negative SRS numbers are better):

RkTeamGmsWLOffDefSRSwpa_locwpa_vegaswpa_1stwpa_2ndwpa_3rdwpa_4th/ot
1Chicago Bears5417.6-7.615.2-0.070.480.130.020.730.22
2New York Giants6429.8-3.012.80.000.260.060.210.050.43
3San Francisco 49ers6420.5-10.410.90.000.80-0.040.210.30-0.28
4New England Patriots6339.00.48.6-0.141.000.620.000.27-1.75
5Green Bay Packers6334.9-2.57.50.000.670.440.06-0.64-0.53
6Seattle Seahawks642-2.0-8.76.60.00-0.200.68-0.740.191.07
7Houston Texans6514.6-1.25.80.001.34-0.190.760.12-0.02
8Atlanta Falcons6602.3-3.25.40.000.610.520.200.411.25
9Denver Broncos5232.5-2.24.70.07-0.13-0.34-0.630.120.41
10Tampa Bay Buccaneers523-0.5-4.54.00.07-0.420.350.200.36-1.06
11St Louis Rams633-2.8-6.73.90.00-0.770.020.27-0.100.58
12Dallas Cowboys5231.4-2.33.6-0.070.23-0.21-0.18-0.400.13
13Baltimore Ravens6511.4-2.13.50.140.65-0.310.760.060.70
14Arizona Cardinals642-3.8-5.71.90.14-0.360.080.10-0.191.22
15Washington Redskins6337.35.51.80.00-0.150.010.751.15-1.76
16Minnesota Vikings642-2.3-3.10.80.00-0.010.71-0.36-0.010.67
17Miami Dolphins633-2.8-2.5-0.30.00-0.59-0.010.741.29-1.43
18Detroit Lions5235.27.2-2.0-0.070.20-0.31-0.82-0.330.83
19Carolina Panthers514-2.5-0.4-2.20.07-0.12-0.84-0.050.24-0.80
20Philadelphia Eagles633-6.5-3.8-2.70.000.52-0.68-0.310.70-0.24
21New York Jets633-2.30.5-2.80.14-0.400.04-0.10-0.410.73
22San Diego Chargers532-3.3-0.5-2.8-0.070.270.450.020.36-0.53
23Cincinnati Bengals6330.34.9-4.6-0.140.170.610.43-1.210.14
24New Orleans Saints5143.27.8-4.60.070.390.05-0.95-0.08-0.99
25Pittsburgh Steelers523-2.02.8-4.8-0.070.540.130.160.18-1.44
26Cleveland Browns615-2.13.0-5.00.00-1.15-0.21-0.740.080.02
27Buffalo Bills6330.99.1-8.3-0.14-0.310.320.02-0.140.25
28Indianapolis Colts523-1.86.8-8.60.07-0.620.25-0.350.020.13
29Oakland Raiders514-4.26.6-10.8-0.07-0.39-0.240.30-1.550.45
30Kansas City Chiefs615-7.16.5-13.60.00-0.76-1.110.05-1.000.82
31Tennessee Titans624-4.98.9-13.80.00-1.15-0.610.39-0.350.72
32Jacksonville Jaguars514-10.73.3-14.00.07-0.60-0.38-0.44-0.210.06

I also included a breakdown of each team’s quarter-by-quarter Win Probability Added (WPA), so you can see where each team’s wins above/below average thus far have come from.

{ 7 comments }

Rating offenses and defenses since 1970

NFL offenses and defenses are not mirror images of each other. The gap between the best and worst offenses is generally bigger than the spread on the defensive side of the ball. And strength of schedule is more likely to play a key role when it comes to determine the best and worst defenses, too. Today’s post is a two-parter: in Part I, we look at some data on the best and worst teams in the modern era, while Part II analyzes the above claims.

Ranking offenses (or defenses) isn’t easy. I don’t like using yards, which is misleading in a lot of ways. Points scored sounds good, but non-offensive scores and other big plays on defense and special teams can make that metric less telling. There are some very good advanced metrics, but they don’t help us if we want to go back to the 1970s. So I simply used offensive touchdowns scored to rank the offenses and offensive touchdowns allowed to rank the defenses. And since I’m going to go back to 1970, I’ll be comparing each unit to the league average in that season.

Part I – Team Rankings

In addition, I’m going to adjust the offenses and defenses for strength of schedule. I’ll be doing this in an iterative way just like I do with the SRS. Listed below are the top 100 teams since 1970 in terms of offensive touchdowns per game over average (and in addition to adjusting for strength of schedule, I’ve pro-rated the non-16 game seasons to 16 games). The first line shows the 2007 Patriots, who scored 67 offensive touchdowns when the league average was 34.6. Therefore, NE gets credit for being 32.4 touchdowns over average. The Patriots’ schedule was actually difficult (once you adjust for the fact that their opponents faced New England) — it cost the offense nearly 2 touchdowns — so their final rating is +34.4.
[continue reading…]

{ 2 comments }

Week 7 NCAA SRS Ratings and the B12 lovefest may be back

Hey Bob, did you know the fate of the conference is in your hands?

Last year, the computers loved the Big 12. The first BCS Standings will be released tonight, and I suspect the B12 will again be viewed favorably by the computers. As a whole, B12 teams have just three nonconference losses, and two of them were by Kansas (to Rice and Northern Illinois). As long as the other nine teams in the conference keep crushing the Jayhawks, those losses won’t matter. The other loss came by Oklahoma State in Arizona, which looks bad in retrospect but again the damage may be limited. With the exception of a blowout over Lousiana-Lafayette, OSU simply hasn’t looked good this season, falling short of a single-game SRS score of 50 in every other game. Yesterday, OSU won by just six points in Manhattan. For the purposes of Kansas State, Oklahoma, Texas Tech and West Virginia, as long as they also beat down on Oklahoma State (and Texas has already handed them one conference loss), I suspect the computers will continue to love them. And for purposes of the BCS computers, a win over the Cowboys is all they will need (as margin of victory is not included).

On the other side, the conference doesn’t really have any landmark victories, either. Mississippi (via Texas), Louisiana-Monroe (Baylor), Tulsa and Iowa (Iowa State), and Miami (Kansas State) are the most impressive heads hanging in the conference’s living room. We might not learn a lot about the Big 12 conference teams as they relate to the rest of college football — the 10 teams have already played 29 of their 30 nonconference games this season. Fortunately for us, that last remaining game is in two weeks, when Notre Dame travels to Oklahoma. If the Sooners win that game, the computers will likely love the Big 12 for the rest of the season.

Below are the SRS Ratings after seven weeks. As always, thanks to Dr. Peter Wolfe.
[continue reading…]

{ 1 comment }

Five weeks in, there’s no stopping the Crimson Tide

Like everyone else, the SRS now has Alabama atop its standings. Here are the full SRS ratings after five weeks [1]Note that I called the Oregon-Washington State game when Oregon was up 51-19 late in the 4th quarter.

RkTeamConfGMOVSOSSRSREC
1AlabamaSEC527.237.364.55-0
2TexasB12422.341.263.44-0
3Texas TechB12427.335.762.94-0
4Texas A&MSEC425.535.5613-1
5South CarolinaSEC522.138.860.95-0
6GeorgiaSEC522.336.859.15-0
7FloridaSEC416.642.258.94-0
8OregonP12526.429.956.35-0
9Notre DameIND414.841.556.24-0
10West VirginiaB12417.338.956.14-0
11Arizona StP12519.336.155.44-1
12Kansas StB12420.134.9554-0
13Florida StACC528.625.554.15-0
14BaylorB12412.84153.73-1
15PurdueB1041736.253.23-1
16LSUSEC521.731.453.15-0
17Oregon StP1235.747.352.93-0
18Oklahoma StB12414.43751.32-2
19OklahomaB12316.833.950.82-1
20ClemsonACC512.937.450.34-1
21UCLAP12515.334.549.84-1
22Ohio StateB10514.135.749.85-0
23StanfordP1247.342.549.73-1
24MissouriSEC51.946.848.73-2
25Iowa StB1248.140.448.53-1
26Southern CalP12412.835.748.43-1
27ArizonaP1254.343.347.63-2
28NebraskaB10517.33047.34-1
29San José StWAC513.132.545.64-1
30North CarolinaACC519.226.445.63-2
31NorthwesternB10511.833.745.55-0
32Fresno StMWC511.43445.43-2
33Mississippi StSEC418.826.144.84-0
34Utah StWAC513.431.444.84-1
35Brigham YoungIND516.328.444.73-2
36MississippiSEC5440.544.53-2
37Louisiana-MonroeSun49.834.744.52-2
38WisconsinB105341.444.43-2
39TCUB12420.923.644.44-0
40MichiganB1042.541.744.22-2
41NevadaMWC512.630.943.54-1
42Michigan StB1054.738.643.33-2
43Louisiana TechWAC415.627.643.24-0
44TulsaCUS512.330.642.94-1
45TennesseeSEC56.93642.93-2
46Boise StMWC4636.642.63-1
47WashingtonP1243.638.842.43-1
48Central FloridaCUS46.136.242.42-2
49LouisvilleBgE512.729.642.35-0
50Miami FLACC54.537.5424-1
51Penn StateB1059.331.7413-2
52AuburnSEC4-7.348.240.91-3
53Western KentuckySun59.431.440.84-1
54RutgersBgE415.824.340.14-0
55North Carolina StACC57.332.639.93-2
56Louisiana-LafayetteSun41029.939.93-1
57VanderbiltSEC4-1.941.739.81-3
58CincinnatiBgE313.726.139.83-0
59Middle Tennessee StSun411.827.839.53-1
60Ohio U.MAC515.723.739.45-0
61ToledoMAC57.831.339.14-1
62UtahP124-0.439.138.72-2
63MinnesotaB105731.538.54-1
64CaliforniaP125-5.844.238.41-4
65IowaB1053.234.8383-2
66TroySun54.433.437.83-2
67KentuckySEC5-9.747.437.71-4
68South FloridaBgE5-2.239.2372-3
69MarylandACC4-0.537.5372-2
70TempleBgE3234.936.91-2
71San Diego StMWC52.434.436.82-3
72Georgia TechACC56.829.636.42-3
73Ball StMAC5036.336.33-2
74SMUCUS4-9.645.936.31-3
75East CarolinaCUS5-1.737.936.23-2
76Northern IllinoisMAC511.524.435.94-1
77Boston CollegeACC4-2.538.135.61-3
78IndianaB1045.330.135.42-2
79New MexicoMWC5-3.839.135.32-3
80ConnecticutBgE55.829.435.23-2
81MarshallCUS5-2.137.1352-3
82SyracuseBgE4-4.839.334.61-3
83Kent StMAC42.332.134.43-1
84Virginia TechACC5727.334.33-2
85WyomingMWC4-639.633.61-3
86DukeACC59.623.933.54-1
87Air ForceMWC48.924.433.32-2
88Texas St-San MarcosWAC4-6.639.933.32-2
89Alabama-BirminghamCUS4-16.547.831.30-4
90UTEPCUS5-839311-4
91North TexasSun5-2.433.4312-3
92VirginiaACC5-6.737.530.82-3
93Western MichiganMAC5-2.232.930.72-3
94PittsburghBgE42.528.230.72-2
95ArkansasSEC5-14.244.530.31-4
96HoustonCUS4-8.837.7291-3
97KansasB124-533.928.91-3
98Arkansas StSun5-3.130.627.52-3
99Bowling GreenMAC5-2.129.427.32-3
100Florida AtlanticSun5-13.740.126.41-4
101BuffaloMAC4-6.532.926.41-3
102IllinoisB105-6.932.9262-3
103Washington StP125-934.425.42-3
104UNLVMWC5-8.834.225.41-4
105NavyIND4-10.435.625.31-3
106Southern MissCUS4-16.841.624.90-4
107Texas-San AntonioWAC520.34.524.85-0
108Colorado StMWC5-12.236.824.61-4
109RiceCUS5-12.637.224.61-4
110Eastern MichiganMAC4-17.64224.40-4
111Wake ForestACC5-7.531.5243-2
112Florida Int'lSun5-12.336.123.81-4
113Miami OHMAC5-5.328.3233-2
114AkronMAC5-4.42722.61-4
115Central MichiganMAC4-10.430.4202-2
116Hawai`iMWC4-15.935.8201-3
117South AlabamaSun5-12.432.219.81-4
118New Mexico StWAC5-9.728.819.11-4
119ColoradoP125-13.131.818.71-4
120MemphisCUS4-1430.516.50-4
121IdahoWAC5-22.537.314.80-5
122TulaneCUS4-2943140-4
123ArmyIND4-16.830.413.60-4
124MassachusettsMAC5-22.535.412.90-5

[continue reading…]

References

References
1 Note that I called the Oregon-Washington State game when Oregon was up 51-19 late in the 4th quarter.
{ 3 comments }

A futile twist on SRS scores for college football teams

Can you imagine Rambo without his knife? Well, I can't imagine not being able to use the SRS.

As a guy who loves the Simple Rating System, the start of the college football season can be frustrating. Until we get a few weeks in, we can’t really use the Simple Rating System to analyze results. A similar problem affects all computer rating systems. Jeff Sagarin notes in his rankings that that for the first few weeks of the season — until the teams are “well connected” — he uses a starting weight to help match the results to our expectations. By “well connected” Sagarin simply means we need the teams to play each other more frequently so we can have more confidence in our results.

So while it’s fun to watch the games, part of me is disappointed that I can’t run all the teams through the simple rating system. If only we could double the sample size of the games played — after six weeks, teams are fairly well connected — we’d be in business.

Well, I thought of a cheat to do just that. Each game has a point spread, a quantitative expectation of how each team will perform according to the best minds in the betting community. So when Florida plays Tennessee, there are two games that are happening. One is the result of the actual game, Florida winning by 17. The other is what we expected to happen, which is Tennessee winning by 3.

It might seem odd to use projected results as inputs into the SRS. And maybe it is. But why not? It’s similar in ways to using preseason projections, and I generally have faith in the betting community. Plus, what else I am supposed to do until a few more weeks.

So here’s what I did. I took every game where the point spread was less than 35 points (under the assumption that games with ridiculous betting lines or that don’t even have a line are just tune ups) and counted it twice. Once for the actual results, and once for the point spread.

Washington, for example, has played 3 games this year. They played San Diego State, were favored by 15, and won by 9 points. They played LSU, were 22.5 point underdogs, and lost by 38 points. And they played Portland State, were 32-point favorites, and won by 39 points. As a result, in six “games” this year, Washington won by an average of 5.8 points. Their strength of schedule was pretty tough, too — iterated, of course — so they will fare pretty well. How does the rest of college football look?
[continue reading…]

{ 4 comments }

The last few years, first at the PFR Blog and later at Smart Football, I’ve tracked the college football season with a modified version of the Simple Rating System. The SRS thrives on interconnectivity — we need each of the teams to play each of the other teams as many times as possible. You can’t create a predictive version of the SRS until after several weeks of results: an objective strength of schedule can’t be created until the system seems how teams perform against multiple teams.

But we can see how teams performed in week 1 compared to expectations, by comparing the actual results to what the SRS would have predicted if the same teams had instead met at the end of the 2011 regular season. For example, the 2011 Pittsburgh Panthers had an SRS of 39.9, while the 2011 Youngstown State Penguins — an FCS team but a very good one — had an SRS of 28.0. With YSU heading to Pittsburgh, we would project Pittsburgh to win by 14.9 points, factoring in three points for home field.

Kevin Sumlin explains to Case Keenum the plot of Over the Top.

As it turns out, the Penguins beat the Panthers by 14 points, meaning YSU surpassed “expectations” by 28.9 points. At least according to this unusual definition of expectations. But that wasn’t the biggest upset of the weekend, and not just because Pittsburgh was mediocre last year. In 2011, YSU handed eventual FCS National Champion North Dakota State their only loss of the season — in Fargo — last November. No, the biggest upset of the weekend came at the expense of the 13th best team in the SRS last year…. to a team playing its first game at the FBS level.

You may recall that the Houston Cougars started last season 12-0, and were in the running for a BCS Bowl berth before losing in the Conference USA Championship Game to Southern Mississippi. Since then, Cougars coach Kevin Sumlin jumped to Texas A&M while star quarterback Case Keenum finally exhausted his eligibility. Regression was expected — assumed, even — but to see the Cougars lose to Texas State was astonishing. Texas State plays in San Marco, Texas, located roughly halfway between San Antonio and Austin, and joined college football’s highest ranks this season. The Texas State Bobcats were an FCS school last year and went 6-6; against their only non-FCS opponents in 2011, the Bobcasts lost 50-10 to Texas Tech and 45-10 to Wyoming. And coming into the game, Texas State was a 34.5 point underdog. Update: This morning, Houston offensive coordinator Mike Nesbitt “resigned”, and head coach Tony Levine announced that Travis Bush will now handle the play-calling duties.

Here were the biggest “upsets” of week 1 according to the 2011 SRS. The final column shows the difference between the actual results and the expected score:

TeamPFOppPALocTmConfOppConfEXP MOVDiff
Texas St-San Marcos30Houston13RoadWACCUS-40.257.2
Youngstown St31Pittsburgh17RoadfcsBgE-14.928.9
Ohio U.24Penn State14RoadMACB10-12.122.1
Duke46Florida Int'l26HomeACCSun-1.521.5
Eastern Washington20Idaho3RoadfcsWAC-0.217.2
Nevada31California24RoadMWCP12-8.315.3
Colorado St22Colorado17Denver COMWCP12-6.411.4
Troy39Alabama-Birmingham29RoadSunCUS-0.210.2
Arizona24Toledo17HomeP12MAC-2.89.8
McNeese St27Middle Tennessee St21RoadfcsSun-3.89.8
Texas-San Antonio33South Alabama31RoadWACSun-4.76.7
Michigan St17Boise St13HomeB10MWC-1.75.7

Again, obviously not all of these were upsets. Boise State was expected to decline following the loss of Kellen Moore and a stellar senior class, and actually covered the spread in their loss to Michigan State. But this helps to at least give a hint of what were some possible upsets. The Pac-12 only went 2-2 in their games against the Mountain West this weekend, as Colorado and California came out flat against Colorado State and Nevada. In addition to McNeese State’s victory over MTSU, there was a 4th victory by an FCS school over an FBS team: but it doesn’t register as an upset on the SRS meter. Tennessee-Martin defeated Memphis 20-17 on a field goal in the final seconds; while UT-Martin was a 9.5 point underdog according to Las Vegas, they actually finished 6 points higher than Memphis in the SRS last year.

Impressive wins by Favorites

We can use the same formula to look at the most impressive wins by the SRS favorites in FBS games. Subjectively, it’s hard to top what Alabama did to Michigan on Saturday Night; if it’s possible for the #1 or #2 team in the country to look better than we thought, the Crimson Tide did just that this weekend. But looking at simple arithmetic…

TeamPFOppPALocTmConfOppConfEXP MOVDiff
Ohio State56Miami OH10HomeB10MAC15.430.6
Notre Dame50Navy10Dublin IrelandINDIND14.225.8
Nebraska49Southern Miss20HomeB10CUS6.622.4
Central Florida56Akron14RoadCUSMAC21.620.4
UCLA49Rice24RoadP12CUS6.618.4
Alabama41Michigan14Arlington TXSECB108.818.2
West Virginia69Marshall34HomeB12CUS17.317.7
Connecticut37Massachusetts0HomeBgEMAC20.216.8
Baylor59SMU24HomeB12CUS19.715.3
Brigham Young30Washington St6HomeINDP129.514.5
Iowa St38Tulsa23HomeB12CUS0.514.5
Southern Cal49Hawai`i10HomeP12MWC26.112.9
Illinois24Western Michigan7HomeB10MAC6.310.7

Urban Meyer’s debut was about as good as he could have hoped, thumping a Miami of Ohio team that was solid in 2011. Notre Dame, excellent at disappointing its fan base, destroyed Navy in Saturday’s early game in Dublin. Nebraska’s Taylor Martinez had perhaps the best passing game of his career over Southern Miss, who is replacing head coach Larry Fedora (now in North Carolina). Baylor was only a 7-point favorite against SMU in its first game After RGIII; based on their success last year, the SRS projected Baylor as a 20-point favorite. Still, the Bears blew out Southern Methodist 59-24, in an effort to prove that they weren’t a one-man program. Not every school was as fortunate…

Honorable Mentions

San Jose State, a projected 32-point loser in Palo Alto, nearly pulled off a huge upset in Stanford’s first game After Luck. The Cardinal needed a last second fourth-quarter field goal to win, 20-17. Northern Iowa, a 25-point projected loser to Wisconsin, lost 26-21, a sign that the Panthers should be in for a good year. Maryland needed a 4th quarter touchdown to defeat William & Mary, 7-6, despite being a projected 15.5 point winner. In other depressing ACC news, Wake Forest got a scare from Liberty — a team they were projected to beat by 16.7 points — but won 20-17.

{ 5 comments }

The NFL's version of Two Face.

The 2011 Giants were one of the more confusing teams in recent memory. Will this year’s the Giants play like the defending Super Bowl champions or the team that allowed more points than they scored last season? Jason Lisk points out that there’s a third option, and we should consider the 2011 Giants as a 13-7 team that faced an extremely difficult schedule.

Let’s start by recognizing that the 2011 Giants faced a difficult schedule in the regular season; not only was the NFC East competitive, but New York also faced the top four teams in the NFL outside of their division. In 2011, the Giants ranked 13th in the Simple Rating System. For the uninitiated, the SRS is a predictive system, which means it could theoretically place a 3-5 team ahead of a 7-1 team. The SRS mimics the points spread you would see in Las Vegas rather than a power ranking system. As the name implies, it’s simple in the sense that it only looks at two variables: strength of schedule and margin of victory. Each game is given equal weight. A win by 10 points over a team that is 5 points below average is equal to a 5-point win over an average team. The SRS is always just the sum of the margin of victory and the opponent’s rating. Unlike many systems, in the SRS, the values have meaning. A team with an SRS rating of +6.0 means that team is six points better than average.

It’s complicated to create these ratings, but I’ve done the heavy lifting [1]The tricky part is that each team’s strength of schedule is dependent on the ratings of each of their opponents, which is dependent on the ratings of each of their opponents, which includes the … Continue reading. Here were the SRS ratings for each team immediately after week 17 last season:

RkTmMOVSOSSRS
1New Orleans Saints13-1.611.4
2Green Bay Packers12.6-1.211.4
3New England Patriots10.7-1.49.3
4San Francisco 49ers9.4-1.18.3
5Baltimore Ravens7-0.96.1
6Detroit Lions5.40.66.1
7Pittsburgh Steelers6.1-0.85.3
8Philadelphia Eagles4.30.54.7
9Houston Texans6.4-1.94.5
10Atlanta Falcons3.30.33.5
11Chicago Bears0.80.91.7
12Dallas Cowboys1.40.31.6
13New York Giants-0.421.6
14Miami Dolphins1-0.10.9
15New York Jets0.900.9
16San Diego Chargers1.8-0.90.9
17Seattle Seahawks0.40.40.8
18Cincinnati Bengals1.3-0.90.5
19Tennessee Titans0.5-1.5-1
20Carolina Panthers-1.40.1-1.3
21Arizona Cardinals-2.30-2.2
22Buffalo Bills-3.90.5-3.4
23Washington Redskins-4.90.8-4.1
24Oakland Raiders-4.6-0.3-4.9
25Denver Broncos-5.1-0.2-5.3
26Cleveland Browns-5.60.2-5.4
27Jacksonville Jaguars-5.4-0.3-5.6
28Minnesota Vikings-6.81.1-5.7
29Kansas City Chiefs-7.9-0.2-8.1
30St. Louis Rams-13.42.9-10.4
31Tampa Bay Buccaneers-12.92.3-10.6
32Indianapolis Colts-11.70.4-11.3

[continue reading…]

References

References
1 The tricky part is that each team’s strength of schedule is dependent on the ratings of each of their opponents, which is dependent on the ratings of each of their opponents, which includes the original team we’re trying to rate. If you adjust each team’s rating over thousands of iterations, eventually the ratings converge, and we’re left with “true” ratings
{ 1 comment }
Next Posts