≡ Menu

Previous Passing Stats:

In week 16 of the 1983 season, Lynn Dickey, Ron Jaworski, Joe Theismann, and a rookie John Elway each threw 4 interceptions. Four quarterbacks throwing four interceptions apiece in a single week was unusual even for the early ’80s, and it is downright unheard of now.

Well, I should say *was* unheard of in modern times. Because in week 11, for the first time in 36 years, four quarterbacks threw at least four interceptions. It started on Thursday Night Football, when Mason Rudolph threw four interceptions against the Browns. On Sunday, Jameis Winston had a casual 4-INT game, and Kyle Allen’s recent downward spiral resulted in an ugly 0-TD, 5 sack, 4-INT game against the suddenly dominant Atlanta Falcons defense. Rudolph and Allen were the worst two quarteracks of the week. Finally, last night, Philip Rivers threw four in a loss to the Chiefs, with Daniel Sorensen making a great grab to seal the game and capture the final interception of the week.

It was only two weeks ago when passing offenses had the best interception week ever: teams threw just 12 interceptions on 952 passes, a 1.26% interception rate. This week, there were 29 interceptions thrown on 1038 passes, a 2.79% interception rate.

The full week 11 passing stats below: [continue reading…]

{ 0 comments }

Dak Prescott Is Playing Like An All-Pro Quarterback

Here are Dak Prescott’s passing numbers over his last 16 games.

And even that doesn’t tell the full story, at least as far as this season goes. Prescott has 149 passing first downs this season on 377 dropbacks, a 39.5% passing first down rate. In fact, the Cowboys lead the NFL in passing first down percentage, despite “only” ranking 8th in completion percentage.

This chart is always one of my favorites: completion percentage on the X-Axis, and passing first down rate on the Y-Axis. [continue reading…]

{ 0 comments }

Justin Tucker continues to be the best kicker in the NFL. He missed his first kick today, from 40 yards away, which was shocking. And that’s the point of today’s post: Tucker missing a 40-yard field goal is shocking.

His last 7 misses were from 65, 53, 48, 43, 46, 62, and 58 yards away. He had made 56 consecutive field goals from 40 yards and in, until the miss today against Houston. The graph below shows the result of every regular season field goal in Tucker’s career, from his first game in 2012 through week 10 of the 2019 season. [continue reading…]

{ 0 comments }

So far this season, NFL teams are averaging about 6.4 net yards per pass attempt and 4.3 yards per carry. In addition, teams are passing on about 59% of all plays. I thought it might be interesting today to look at the distribution of the outcomes on rushing and passing plays.

For running plays, the analysis is pretty simple. About 12% of all rushing plays will lose yards, and another 9% of all rushing plays will gain zero yards. Said differently, close to 4 in every 5 rushing plays will gain positive yards. Note, of course, that quarterback scrambles are considered rushing plays for this analysis.

On the other hand, 42% of pass plays do not gain positive yards. So far in 2019, 6.9% of pass plays result in a sack and 33.1% of pass plays result in an incomplete pass, which means 60% of all pass plays (including sacks) result in a completed pass. In addition, about 2.7% of all pass plays result in a completion for either zero yards or negative yards. Add it all up, and on any given pass play in 2019, and there’s about a 3-in-7 chance that the passing team won’t be getting any yards. [continue reading…]

{ 0 comments }

Patrick Mahomes, Russell Wilson, Lamar Jackson, Dak Prescott, and Deshaun Watson are all having great years, and all five players are in the running for the 2019 MVP award. Right now, Mahomes has been the most efficient of the group, but the story of the 2019 season isn’t about great passing offenses…. but the fact that great passing offenses aren’t the story of the 2019 season. (As an aside, Kirk Cousins and Minnesota are quietly number two in ANY/A this season).

The best passing offense, in terms of Adjusted Net Yards per Attempt, belongs to the Chiefs. So far this season, Kansas City is averaging 8.81 ANY/A, and the league as a whole is averaging 6.27 ANY/A.   So the Chiefs are averaging 2.54 ANY/A more than the average team this year.  That’s great, but what is noteworthy is that it is NOT that noteworthy this year.

The Jets passing offense is more extreme than the Chiefs passing offense.  New York is averaging an anemic 3.34 ANY/A this season, which means the Jets Relative ANY/A on offense is -2.93.  So we could say that the Jets passing offense is the most extreme this season of the 32 passing offenses.

But guess what: opponents facing the Bengals are also more extreme than Chiefs!  So far this season, Cincinnati is allowing a remarkable 8.99 ANY/A to opposing quarterbacks, which means [Insert Bengals Opponent] has been better at passing this year than Kansas City.  At -2.72 ANY/A, the Bengals pass defense is truly awful.

But wait, there’s more.  The Patriots pass defense is even more extreme than the Bengals pass defense. New England is allowing just 1.70 ANY/A this season, which is +4.57 ANY/A better than average!

The graph below shows how each team ranks in both offensive ANY/A (X-Axis) and defensive ANY/A (Y-Axis) relative to league average.  The best teams would be up and to the right, but that’s a generally empty box.  The worst teams are down and to the left, and we do have three teams there.

So while the passing attacks in Kansas City et al. are having great years, they aren’t more extreme than the Jets pass offense, the Bengals pass defense, or the Patriots pass defense.  And that is pretty unusual.  I went and calculated the best and worst passing offenses and defenses, as measured by Relative ANY/A, in each year since 1970.  Usually, extreme offenses are the biggest outliers, and in the positive direction.  In 22 of those seasons, the most extreme unit was the best passing offense; in 13 years, the worst passing offense was the most extreme.  The other 14 years were split evenly between the best and worst passing defenses. Take a look: [continue reading…]

{ 0 comments }

Previously:

In 1974, the Bengals — the Paul Brown/Bill Walsh/Ken Anderson Bengals — were running the West Coast Offense to perfection. Anderson completed a whopping 64.9% of his passes that season, setting a post-WWII record. But in the team’s final game of the season, with Anderson injured, the team turned to unheralded Wayne Clark at quarterback. Unfortunately, the schedule makers had the team’s final game in Pittsburgh, against the famed ’74 Steelers defense.

The Bengals were blown out, of course, and lost 27-3. Cincinnati trailed by at least 17 points at halftime, after three quarters, and at the end of the game. Naturally, this is a Game Script that would call for a lot of passes, but here’s the twist: the Bengals ran 41 times and passed just 8 times! Clark completed only 3 of those passes for 23 yards, with 2 of them going to TE Bruce Coslet — yes, that Bruce Coslet — for 24 yards; the third completion was a 1-yard loss to the running back.

Running 40 times in a game where you trail by 17 after the 2nd, 3rd, and 4th quarters should sound weird to you. In fact, this Bengals game was the only time since the merger that all those factors were met. I say was, because that was the case until Sunday, when the modern Bengals pulled off the same trick.

Cincinnati rushed 40 times, and Joe Mixon had 30 carries, in a game where the Bengals trailed 14-0 after the 1st quarter, 28-10 at halftime, and 49-10 after three quarters. How do you call 40 rushing plays in a game where you are getting blown out? One answer is that Cincinnati was starting Ryan Finley for the first time in his career, although Finley did not play all that poorly. The other answer is that the Bengals just didn’t care.

My favorite drive was with 5 minutes left in the 3rd quarter. Cincinnati took over at its own 25, trailing 42-10. Yes, down by 32 with 20 minutes to go is not a good situation, but most teams would at least try to put some points on the board. Here’s what happened.

Play 1: Mixon run left tackle for 0 yards.
Play 2: Pass to Mixon 1 yard ahead of the line of scrimmage; Mixon gains 13 yards of YAC.
Play 3: Mixon run right tackle for 3 yards.
Play 4: Mixon run left guard for 1 yard.
Play 5: 3rd-and-6, Finley pass, sack, fumble, returned for touchdown.

Maybe the Bengals knew what they were doing calling all those running plays.

The table below shows the week 10 Game Scripts, headlined by the Ravens +21.6 Game Script. [continue reading…]

{ 0 comments }

Lamar Jackson and Spec Sanders

Baltimore quarterback sensation Lamar Jackson is averaging 226.2 passing yards per game and 78.0 rushing yards per game so far this season.  That is… well, remarkable.  In fact, in the history of pro football, there has only been one player in NFL history to average 75 rushing yards and 75 passing yards per game: Orban “Spec” Sanders, playing for the New York Yankees in the AAFC in 1947.

The graph below shows the passing yards per game (X-Axis) and rushing yards per game (Y-Axis) for every player who played in at least 6 games from 1932 to 2018.  As you can see, Sanders really stands out.  For reference, I’ve also included Jackson’s 2019 season to date — he, too, is a pretty notable outlier. [continue reading…]

{ 0 comments }

Previous Passing Stats:

Lamar Jackson has rushed 92 times for 716 yards, a 7.8 yards per carry average (excluding his 14 kneels for -14 yards). Jackson has rushed for 37 first downs, which is more than Leonard Fournette, Nick Chubb, or Christian McCaffrey. He is a remarkably effective runner, on the level of Michael Vick if not better, while also being an exceptionally efficient passer.

For the second time this season, Jackson posted a perfect passer rating. He’s in the top 10 on the season in both passer rating and ANY/A, and if anything, that probably underrates him. He’s also scrambled 28 times for 285 yards, which probably should be included in his passing numbers and would increase his ANY/A by over 0.2 yards per passing play.

The other notable thing from week 10 was that Patrick Mahomes and Dak Prescott continued to produce at an MVP level but lost. In the case of Mahomes, a lot of things had to go wrong: running back Damien Williams had a fumble returned for a touchdown, Tyreek Hill and Sammy Watkins had huge drops, the game-tying field goal was blocked, an earlier field goal attempt was aborted due to a botched snap, and the Chiefs defense was shredded by Derrick Henry.  Not to mention Andy Reid getting overly conservative and kicking three field goals on 4th-and-2 or 4th-and-3.  That’s how the Chiefs lost despite yet another brilliant game from Mahomes, who had exactly one drive end in a punt or a Mahomes turnover.

As for Prescott, the blame for the Cowboys loss can be equally shared among Ezekiel Elliott and the Dallas defense.  Elliott and Kalen Ballage (Dolphins) both had nearly identical stat lines in week 10: each back rushed 20 times and picked up 0 first downs, the most carries by any running back in 2019 in a game without a first down (Ballage rushed for 43 yards; Elliott 47).   Meanwhile, the Dallas defense allowed 28 points on the first 7 drives of the game, with the average drive beginning on Minnesota’s 24-yard line.

The table below shows the week 10 passing stats. [continue reading…]

{ 0 comments }

Jared Goff’s Career, By Game

Jared Goff has now played 51 games in his NFL career, including playoffs. And his last 16 games have not been pretty:

Putting aside the fumbles (which is an enormous issue for Goff), let’s just look at his passing stats. I calculated Goff’s Adjusted Net Yards per Attempt (which is his passing yards (net of sacks) plus 20 yards for every TD pass and minus 45 yards for every interception, divided by his pass attempts plus sacks) for every game in his career. I then calculated his Relative ANY/A to league average for that season for each game, too.

The graph below shows Goff’s Relative ANY/A in each game, along with his trailing 16-game Relative ANY/A average. I have also color-coded his playoff games, and highlighted a few notable games. [continue reading…]

{ 0 comments }

Previously:

[continue reading…]

{ 0 comments }

This week, I appeared on the Wharton Moneyball Podcast on Sirius XM. You can listen here:

https://podcasts.apple.com/us/podcast/wharton-moneyball-11-6-chase-stuart-coach-todd-golden/id1159695411?i=1000456092933

Or here: https://shows.pippa.io/5b69f70c0a0eca0c20692176/episodes/wharton-moneyball-116-chase-stuart-coach-todd-golden

{ 0 comments }

Jimmy Garoppolo And Quarterback Help

The 49ers offensive production has been driven by its skill position players.

A few years ago, when writing about Andrew Luck, I wrote that he didn’t have much help. Today, I am revisiting the topic of quarterback help, using Jimmy Garoppolo as our example (and we’ll compare him to Falcons quarterback Matt Ryan). Because so far this season, no quarterback has been placed in a more favorable situation than the 49ers quarterback.

Let’s start by recognizing that none of today’s analysis is about the quarterback himself; rather, it is about the situation that each team’s quarterback finds himself placed in. Let’s begin with Game Script.

Average Points Differential

Garoppolo has 266 plays this season: 226 pass attempts, 12 sacks, and 28 rushes.  On average, during each of those 266 plays, the 49ers have led by 5.4 points.  That makes life a lot easier for Garoppolo compared to just about every quarterback.  Matt Ryan, on the other hand, is constantly in a situation where the pressure is on for him to score: his average play has come with the Falcons trailing by 10.0 points. [continue reading…]

{ 0 comments }

In March, I wrote about the shrinking middle class of quarterbacks: most teams were either paying superstar dollars to a quarterback or going with a cheap player still on a rookie contract. In fact, at the time of the article, there were just 7 teams that didn’t clearly fit that category: the Redskins (who had been paying Alex Smith and have since drafted Dwayne Haskins), the Dolphins (who appeared to be tanking on the quarterback position), and then five teams truly stuck in no man’s land: the Titans and Bucs, who were using their 5th-year option on Marcus Mariota and Jameis Winston, and the Bengals (still hanging on to Andy Dalton), the Jaguars (traded for Nick Foles), and the Broncos (traded for Joe Flacco).

At the halfway mark of the season, I wanted to check in on the league’s passing offenses by looking at two variables: salary cap dollars allocated to quarterbacks and offensive Adjusted Net Yards per Attempt. That is shown in the graph below.

Or, better yet, let’s redraw that graph. [continue reading…]

{ 0 comments }

Analyzing wide receivers is complicated, so much so that I’ve devoted a tag here at FP to the project. In my opinion, there’s no one statistic we can use to grade receivers, so a holistic approach is best.

A great wide receiver should have a large percentage of his team’s passing pie. And a great wide receiver should make that passing offense effective. So from time to time, I look to compare how receivers look in these two metrics, and see who is standing out. The theory is simple: if you are a great wide receiver, you should have an outsized portion of that team’s passing offense, unless the supporting cast is so strong that well, the entire passing offense looks great. A wide receiver on a bad passing offense should have a huge percentage of his team’s production, so he’ll still look good here; a wide receiver on a great offense should fare well unless he’s only got a small piece of the pie, in which case he’s probably not having a great season. Regular readers will recall that this analysis is why I think Gary Clark‘s 1991 season is one of the best of all time.

So here’s what I did.

1) Calculate the Adjusted Net Yards per Attempt for each offense so far in 2019.

2) Calculate Adjusted Catch Yards, defined today as Receiving Yards + 20 * Receiving Touchdowns, for each player on each offense.

3) Divide each player’s Adjusted Catch Yards by his team’s total Adjusted Catch Yards; this shows what percentage of the pie each receiver is gobbling up.

There are 12 players who have at least 30% of their team’s Adjusted Receiving Yards this year. Michael Thomas, Mike Evans, Courtland Sutton, Cooper Kupp, Allen Robinson, Chris Godwin, John Brown, Stefon Diggs, Terry McLaurin, D.J. Chark, Amari Cooper, and Tyler Lockett. Of that group, only three — Lockett, Cooper, and Diggs — are playing on really good passing offenses, and Thomas, Kupp, and Chark are the only other ones on passing offenses that are above average. It’s safe to say that all six of these players are having really good years (at least when it comes to picking up receiving yards; Diggs has four fumbles, including three lost, that knock him down a few pegs). And while McLaurin and Robinson are playing on awful passing offenses, at least they are dominating the pie: they are saddled with bad quarterbacks, and there probably isn’t much either of them can do.

I’ve plotted every player with a reception so far in 2019 in the graph below.  The X-Axis shows the Relative ANY/A for that player’s passing offense — this is simply a measure of team pass efficiency, and is calculated as ANY/A minus league average ANY/A.  Players on the Jets are on the far left; players on the Seahawks and Chiefs are on the far right.

The Y-Axis shows the percentage of team’s Adjusted Receiving Yards by each player.  So Michael Thomas (38.8%) is at the top of the chart, Mike Evans is second (at -0.42, 36.0%) is the second highest point, etc.  In general, you want to be up and to the right on this chart.  The four players who stand out here are Thomas (+0.80, 38.8%), Amari Cooper (+1.57, 30.6%), Stefon Diggs (+2.16, 31.1%) and Tyler Lockett (+2.43, 30.3%). [continue reading…]

{ 0 comments }

Previous Passing Stats:

There were no truly awful passing performances in week 9 of this NFL season. The 28 teams combined for a 98.8 passer rating and averaged 6.72 ANY/A, but one of the benefits of doing this each week is that you tend to notice weekly outliers. And this week, there were no *awful* passing performances. In 5 of the first 8 weeks of the 2019 season, at least one team had a negative ANY/A. In two others, at least one team had an ANY/A below 1.00. Week 1 of the 2019 season was an outstanding passing week, as you may recall, and the Bucs had the lowest ANY/A of the week at 1.51.

Daniel Jones was bad on Monday Night Football, but not abnormally bad. He averaged only 3.7 net yards per pass, which is of course terrible, but he had 1 TD and 1 INT. It was the sort of bad game that nobody will remember, and it was the worst passing performance of the week.

By traditional passing stats, Gardner Minshew probably ranks last, since he threw 0 TDs and 2 INTs. But Minshew threw for 309 yards and averaged 6.0 net yards per attempt. An ugly game, sure, but not a completely inept one. Here’s the crazy part: other than Minshew, Ryan Tannehill (who had a mediocre but not bad game) was the only other player to throw more INTs than TDs in week 9! That’s because the entire NFL — yes, the entire NFL — had a 1.26% interception rate in week 9! This week broke the single-week NFL record for INT%, previously set in week 8 of 2016 (1.27%). This week also smashed the record for TD/INT ratio, at a whopping 3.91. The previous high was 3.54, also set in week 8 of 2016.

But while it was a very good passing week, but it also was one without a superstar performance, either (Russell Wilson fans, please don’t @ me; he was excellent, but he averaged “only” 7.5 net yards per attempt, which brings down his ANY/A). This was the first week all year where no team averaged 11.0 ANY/A; the 49ers led the way at 10.26 ANY/A, which normally could never lead the league. So things were bunched in week 9, which was probably an outlier, but still merits watching going forward. And keep in mind this happened with Drew Brees, Matt Ryan, and Jared Goff (along with the Bengals) all on their bye weeks.

Below are the week 9 passing stats: [continue reading…]

{ 0 comments }

You probably don’t think much about Vince Young these days, but I wrote a bit about him this summer. One thing that stood out to me about Young’s career was that for a running quarterback, he didn’t take many sacks. There are 20 quarterbacks since 1970 to rush for 1,000 yards and average at least 20 rushing yards per game in their careers; Young (5.98%) and Steve McNair (5.29%) are the only two quarterbacks with a sack rate below 6.5%.

Young’s best sack season was 2009, when he had just 9 sacks. Young actually finished with more rush attempts (55) than sack yards lost (36), which seemed basically impossible. Young remains the only player since at least 1970 to accomplish that fact, among quarterbacks with enough pass attempts to qualify for the passing title.

For his career, Young had 3.4 rush attempts for every sack, which is outstanding and the best mark among quarterbacks with at least 500 pass attempts (Tim Tebow was at 4.8, but he had just 361 pass attempts). But Lamar Jackson is hot on Young’s heels, and is quickly establishing himself as the best combination of rushing threat/sack avoider in NFL history.

Last year, Jackson didn’t qualify for the passing title, but he was even more impressive than 2009 Young when it came to sack yards lost and rushing attempts. As a rookie, Jackson had 147 rushing attempts and lost just 71 yards to sacks! Along with ’09 Young, he became just the third player with at least 6 times as many rushing attempts as sacks, minimum 150 pass attempts.

Jackson averaged 43.4 rushing yards per sack, which is basically an unfathomable number for a quarterback. And this year, Jackson’s sack rate has dropped from 8.6% to 7.3%; and while he’s running less, his rushing yards to sack ratio is still outstanding.

The top four seasons since 1970, minimum 100 pass attempts, in rushing yards to sacks are:

1) Lamar Jackson, 2018 (43.4 to 1)
2) Lamar Jackson, 2019 (33.9 to 1) [current through week 8]
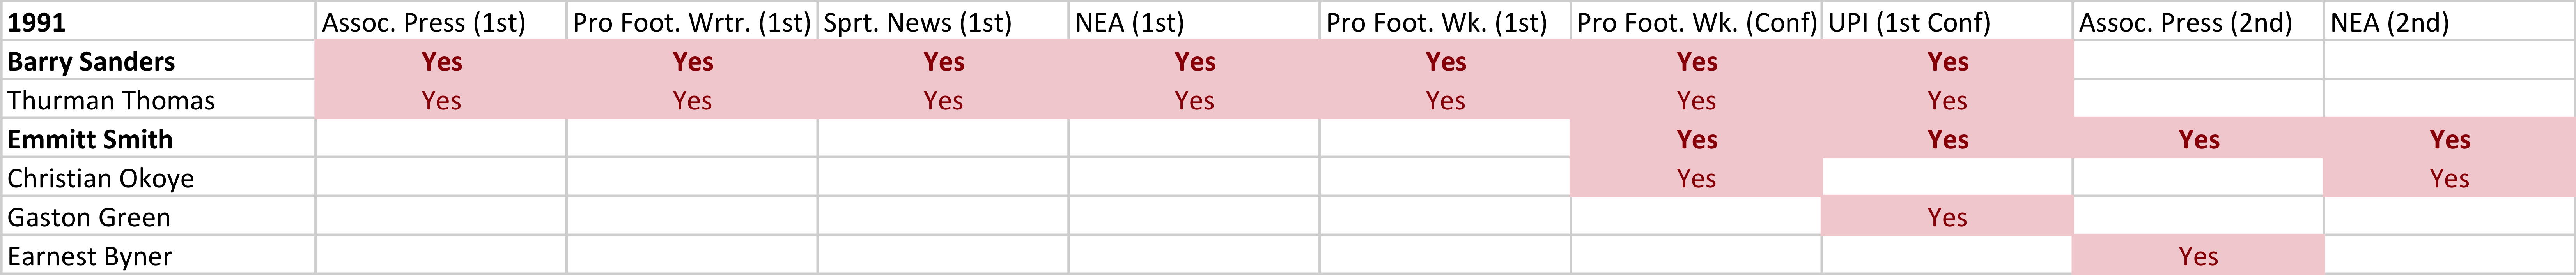
3) Steve Young, 1991 (31.9 to 1)
4) Vince Young, 2009 (31.2 to 1)

For his career, Jackson is averaging 7.0 rushing attempts per sack. Tebow is at 4.8, Ray Lucas at 3.5, Young at 3.4, and then Kordell Stewart is fifth at 3.3. It is just as, if not more dramatic, when we look at rushing yards per sack.

Lamar Jackson is the leader at 38.5, followed by Tim Tebow at 24.1, Terrelle Pryor at 20.2, Michael Vick at 19.3, a young Josh Allen at 18.4, and then Vince Young at 17.6.

Some of Jackson’s crazy numbers here are just the result of him being the most rushing-heavy quarterback in modern history. He’s averaging an absurd 55 rushing yards per game for his career and an even more absurd 81 rushing yards per game since becoming a starting quarterback. But most of the other really run-oriented quarterbacks had bad sack rates: Tebow was at 10.2%, Bobby Douglass 12.2%, and Michael Vick was at 9.8% when with the Falcons. Jackson is at 7.9%, and I’ll be curious to see if he can keep this going.

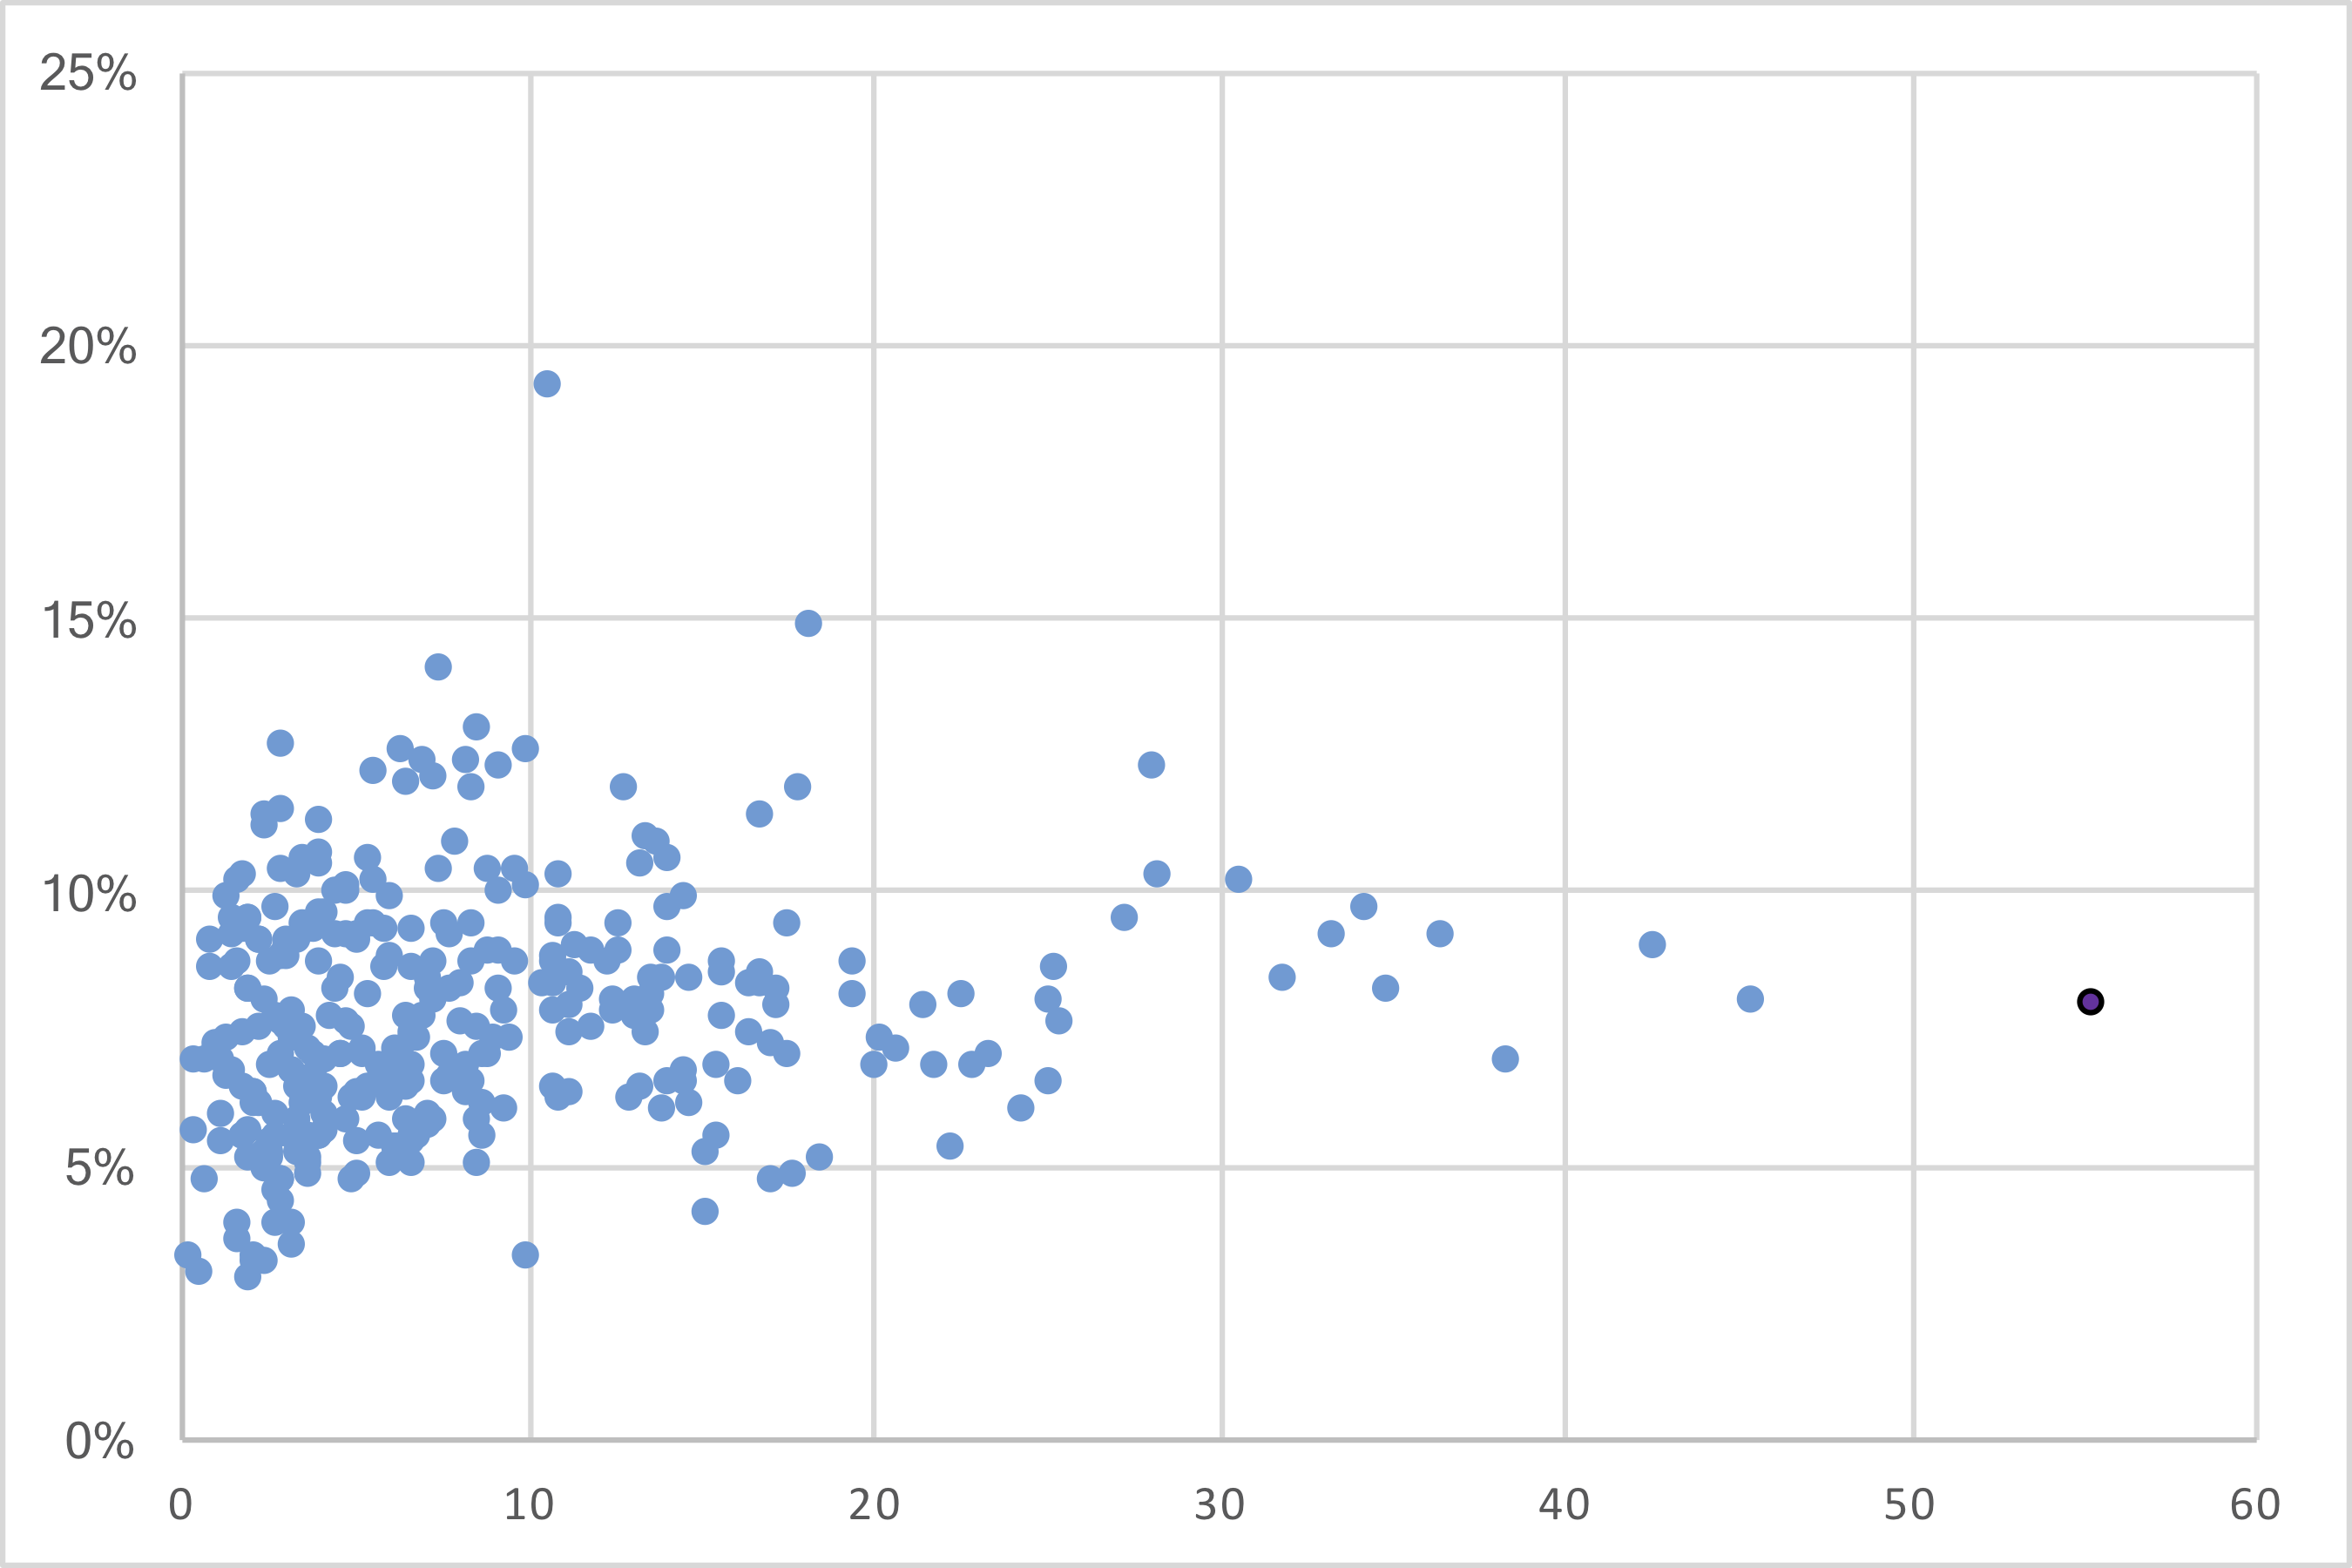
I’ll close with a graph showing all quarterbacks since 1970 with at least 224 pass attempts. The X-Axis shows career rushing yards per game, while the Y-Axis shows career sack rate. See if you can spot Jackson.

And yes, it was important to get this in before Jackson faces the Patriots this weekend.

{ 0 comments }

Pass Identities of NFL Defenses Through 8 Weeks

Yesterday, we looked at the pass identities of each offense. Today, we will use the exact same methodology to examine NFL defenses. We would expect defenses to have less control over their pass identity than offenses, because of the obvious fact that it’s the offense that gets to choose whether to pass or run. But that doesn’t mean there aren’t some interesting outliers.

Let’s begin with the Houston Texans, who have a basically neutral team. The Texans blew out the Falcons by 21 points, but otherwise have been in all one-score games. In fact, despite a 5-3 record, the Texans actually have a slightly negative Game Script of -0.6. So you would think opposing teams would pass a normal amount against them. You would be wrong: Houston opponents have passed on 66% of all plays this year, the second-highest rate in the NFL behind only the Patriots (against whom opponents are forced to pass from the opening gun).

Why? Well, the Texans have a pretty bad pass defense and a pretty good run defense. Given that in general it’s smarter to pass than to run, and the Texans offense is pretty explosive, you can see why teams tend to pass against Houston. To particularly egregious examples: the Chiefs passed on 77% of plays, and the Chargers 74%, in their games against Houston. In both games, the Texans had a -2.4 Game Script. In both games, Houston trailed 10-0, but their opponents threw on 3 out of every 4 plays. That says a lot about the Texans secondary, and maybe also fear of the Houston offense.

Conversely, we have the San Francisco 49ers. Despite having the second best Game Script in the NFL and an undefeated 7-0 mark, teams have passed on only 60.1% of all plays against San Francisco this year (through 8 weeks, at least; this was written prior to the Thursday Night Game). Teams appear afraid of throwing against the 49ers, and it appears with good reason: the team’s pass defense has been dominant.

The graph below shows each pass defense this season. The X-axis shows Game Script, and the Y-Axis shows pass ratio by that team’s opponents. I have shaded the Texans and 49ers data points, along with the Jets. It’s not all that interesting because of how bad the Jets have been, but the Jets actually have the strongest pass identity of any defense this season, even more than Houston. More on them in a moment. [continue reading…]

{ 0 comments }

Pass Identities of NFL Offenses Through 8 Weeks

The graph below shows the Game Script (X-Axis) and Pass Ratio (Y-Axis) for every game this season. For new readers, a team’s Game Script is simply its average margin of lead (or deficit) over every second of a game. Pass ratio is simply passing plays (pass attempts plus sacks) divided by all offensive plays (pass attempts + sacks + rushing attempts).

As you can see, there’s a clear relationship between the two variables: on average, the better the Game Script, the lower the Pass Ratio.

We can also create season ratings of Game Scripts and Pass Ratios for each team. Let’s use the Patriots and Eagles as examples.

New England has had an average Game Script across its 8 games of +13.1. This year, New England’s pass ratio in those 8 games is 58.2%. Philadelphia has had an average Game Script of -2.2, and a pass ratio of 55.0%. It might strike you as odd to see that New England has a higher pass ratio — i.e., it’s passed more frequently — than Philadelphia. It should! That’s because New England has the strongest passing identity in the NFL, while the Eagles have the strongest rushing identity in the NFL.

The Patriots have, by far, the best average Game Script this season; all else being equal, you might expect New England to therefore have the lowest pass ratio in the NFL. Instead, the team is barely below average, ranking 19th in percentage of passing plays. Philadelphia has the 25th-best Game Script this year, as the Eagles had a -4.4 Game Script against Atlanta, a -4.9 GS against Detroit, a -9.9 vs. Minnesota and a -14.8 against Dallas. And yet the Eagles have just the 25th-best highest passing ratio in the league! That’s very run-heavy, as noted yesterday.

The graph below shows the Game Script (X-Axis) and Pass Ratio (Y-Axis) of each offense this season. I have shaded in team colors the Patriots and Eagles data points: [continue reading…]

{ 0 comments }

Previously:

[continue reading…]

{ 0 comments }

Did You Know: The 49ers Were Terrible Last Year?

It’s easy to forget that the 49ers were awful last season, going 4-12 and earning the second pick in the NFL Draft. To the extent you remember that San Francisco was bad last year, it’s probably because you see All-World rookie defensive end Nick Bosa dominating the league this season, and the 49ers drafted him with that second overall pick.

But otherwise, it’s hard to fathom that the dominant, 7-0 49ers, were actually terrible last year. Those 49ers allowed 27.2 points per game and scored 21.4 points per game, a difference of 5.8 points per game. This season, San Francisco is averaging 29.6 points per game and allowing just 11.0 through seven games, a difference of 18.6 points per game and an improvement of 24.4 net points per game.

That’s… a lot. In fact, it’s the third most in the NFL since 1950, trailing only the 2013 Chiefs (who added HC Andy Reid and ex-49ers QB Alex Smith in the offseason) and the 1999 Rams (who added QB Kurt Warner, RB Marshall Faulk, and WR Torry Holt in the offseason to form the GSOT offense).  San Francisco has been helped by having QB Jimmy Garoppolo back, of course, but the team has mostly been aided by a dominant defense.

The graph below shows the points differential for each team since 1950 on the X-Axis, and that team’s points differential through 7 games the next season on the Y-Axis.  I’ve colored in four of those dots: at -5.8, 21.6 are the ’98-99 Rams; at -5.8, 18.6 are the ’18-19 49ers.  Over to the left at -13.4, 12.6 are the 2012-13 Chiefs, and at the top of the chart are the 2018-2019 Patriots, who jumped from a +6.9 points differential to a +25.0 points differential through 7 games. [continue reading…]

{ 0 comments }

Previous Passing Stats:

Jared Goff was the star of week 8, with a strong tip of the hat to Cooper Kupp: playing in London, Goff threw 31 passes and gained 372 yards with 2 TDs and no interceptions and no sacks.

Meanwhile, Sam Darnold and Kyle Allen were the worst passers of the week. The second-year quarterbacks combined for 15 sacks and 6 interceptions, while combining for just 19 passing first downs on 82 dropbacks (23%).

The full week 8 passing stats below:

RkQuarterbackTmOppResultAttYdsTDIntSkYdsANY/AVALUE
1Jared GoffLARCINW 24-1031372200013.29212
2Derek CarrOAKHOUL 24-2730285300011.5152
3Drew BreesNORARIW 31-94337331009.02111
4Gardner MinshewJAXNYJW 29-153427930219.39106
5Matthew StaffordDETNYGW 31-2632342314269.1999
6Daniel JonesNYGDETL 26-3141322403328.4186
7Kirk CousinsMINWASW 19-926285003129.4186
8Aaron RodgersGNBKANW 31-2433305305498.3271
9Matt SchaubATLSEAL 20-2752460112177.7470
10Russell WilsonSEAATLW 27-2020182202119.5969
11Deshaun WatsonHOUOAKW 27-2439279303217.5747
12Matt MooreKANGNBL 24-3136267202187.6144
13Tom BradyNWECLEW 27-1336259203207.1528
14Jacoby BrissettINDDENW 15-1325202004116.594
15Ryan TannehillTENTAMW 27-2333193303196.52
16Case KeenumWASMINL 9-1916130002146.440
17Carson WentzPHIBUFW 31-1324172103196.41-1
18Jimmy GaroppoloSFOCARW 51-1322175213196.04-10
19Mason RudolphPITMIAW 27-1436251212156.08-14
20Brett HundleyARINORL 9-31100014-2-17
21Philip RiversLACCHIW 17-162920111165.67-23
22Kyler MurrayARINORL 9-3133220003195.58-31
23Josh AllenBUFPHIL 13-3134169204145.13-50
24Andy DaltonCINLARL 10-2452329105325.56-50
25Joe FlaccoDENINDL 13-153217400384.74-60
26Jameis WinstonTAMTENL 23-2743301223185.07-63
27Mitchell TrubiskyCHILACL 16-1735253014274.64-70
28Dwayne HaskinsWASMINL 9-1953301218-4.29-75
29Baker MayfieldCLENWEL 13-2731194115433.5-106
30Ryan FitzpatrickMIAPITL 14-2734190224203.16-125
31Sam DarnoldNYJJAXL 15-2930218238511.89-173
32Kyle AllenCARSFOL 13-513715803758-0.8-319
Total100575735019966226.45

[continue reading…]

{ 0 comments }

Through 8 Weeks, Pass Defense Rules The Day

Typically, there is a very strong relationship between passing offense and team winning percentage. But over shorter samples, that doesn’t always hold up, and that’s been a noticeable trend so far this season.

The Patriots, 49ers, Falcons, and Chargers are all in the same tier of passing efficiency: not in the top ten, but slightly above league average. And yet New England and San Francisco are undefeated, while Atlanta and Los Angeles are 4-12. The graph below shows all 32 teams in the NFL and their statistics through 8 weeks (of course, this is prior to the Steelers/Dolphins MNF game tonight). The X-Axis shows each team’s offensive Adjusted Net Yards per Attempt average relative to league average. The Chiefs, Vikings, and Seahawks are the top three teams in this metric so far this season. The Y-Axis shows winning percentage.

One thing you’ll notice is that the teams looked bunched together. The X-Axis runs from -5.5 to 5.5, and you’ll see why in a moment. [continue reading…]

{ 0 comments }

All-Pro Voting: Comparing Barry Sanders and Emmitt Smith

Barry Sanders and Emmitt Smith are two of the greatest running backs in NFL history. They also happened to be contemporaries, which let NFL fans and analysts compare them year after year. Today, I want to review how the media viewed these two players.

Sanders entered the NFL a year before Smith, and was an instant success. As a rookie, Sanders and Christian Okoye were the  top running backs in the NFL, with Thurman Thomas, Neal Anderson, and Dalton Hilliard rounding out the top five.  Here was the voting by the Associated Press, Pro Football Writers Association, Sporting News, Newspaper Enterprise Association, Pro Football Weekly, and the UPI.  I have noted whether each award was a 1st-team All-Pro honor, a 1st-team All-Conference honor, or a 2nd-team All-Pro honor.

In 1990, Smith entered the league, and while he earned the AP Offensive Rookie of the Year award, he couldn’t compete for honors on a larger scale.  This was the start of a two-year period where the former Oklahoma State Cowboys, Sanders and Thomas, were the clear top two running backs in the NFL, with Anderson and Marion Butts also picking up some honors.

In 1991, Thurman Thomas was the MVP of the league according to the AP, PFWA, and the NEA, and he also picked up the AP Offensive Player of the Year award. Sanders, however, also won his first MVP this season, snagging the Bert Bell Award.  Smith started to get some honors, and was the media’s choice as the third best running back in the NFL this season.

In ’92,  Steve Young was outstanding and won most of the major MVP awards, but Smith earned his first MVP honors this season, being selected by the NEA as the best player in the NFL.  Barry Foster had a career season, and it was he — and not Sanders — who shared the first-team All-Pro awards.   Pro Football Weekly also made All-Conference choices this season.

The next season, 1993, Smith swept all the major awards, winning the AP, NEA, PFWA, and Bert Bell MVP honors.  Jerome Bettis (on the Rams) was probably the second-best RB this season, with Thomas the best running back in the AFC and fighting with Sanders for the title of third best running back in the NFL. [continue reading…]

{ 0 comments }

Interceptions By Win Probability Through Week 7

Earlier this season, I looked at interceptions by win probability. Today I want to revisit that post and update the numbers through week 7 of the 2019 season.

All data comes from Ron Yurko’s scrapr github page (note: the win probability data is definitely a little bit buggy, with the win probability reversed on pick sixes. I manually fixed those, but I didn’t otherwise mess with the data. I won’t let the perfect be the enemy of the good, though, so let’s proceed).

The graph below shows how much each offense has lost on win probability on interceptions this year on the Y-Axis, and the amount of interceptions the offense has thrown on the X-Axis. The San Francisco 49ers stand out as a pretty interesting outlier here: [continue reading…]

{ 0 comments }

Previously:

In week 7, the Bears lost by 11 points and the Dolphins lost by 10 points, but the games couldn’t have been more different. Game Scripts are useful in cases like this: the Saints beat Chicago 36-25 but had a Game Script of +7.7. New Orleans 26-10 after three quarters, and 36-10 with 4 minutes remaining before the Bears raced to score 15 meaningless points. Meanwhile, in Buffalo, the Bills won with a Game Script of just +0.5. Miami actually led 14-9 at halftime and at the end of the third quarter, and only led 24-21 with less than two minutes remaining. Buffalo scored a touchdown on Miami’s last minute onside kick attempt, giving Buffalo a 10-point win in a game that was very close throughout.

The table below shows the Game Scripts from week 7: [continue reading…]

{ 0 comments }

Previously:

I had some bugs in my week 6 data that led to a lengthy delay when it comes to posting the week 6 Game Scripts. But better late than never, and for posterity’s sake, I am still posting the data.

This week feels like a long time ago, but a couple of the teams with the most extreme pass/run splits were off in week seven, so that makes this still somewhat topical. Tampa Bay went wildly pass-happy in a blowout loss to Carolina in London. Anytime a team throws 60+ times, or throws on over 80% of its plays, that’s going to be considered a very pass-heavy game, even in a blowout. Jameis Winston had a rough game with 5 interceptions and one lost fumble to go with 7 sacks, but it’s not as though the Tampa Bay ground game (14 for 42) was all that effective. Winston has been extremely boom or bust this year, with 0 games with a passer rating of between 50 and 100.

The Kansas City Chiefs have (or should I say, had) lots of reasons to be pass-happy. In game script-neutral situations, you can argue that Kansas City should be the most pass-happy team in the league. In week 6 against Houston, Patrick Mahomes played pretty well, even if below his own lofty standards. The Chiefs finished with just 11 rushing plays (including one kneel by Mahomes), the fewest in over five years by a team that actually led after three quarters! Of course, it didn’t help that Houston really bled the clock in the second half, limiting Kansas City to just three drives.

The most run-happy team of the week was the Pittsburgh Steelers, without accounting for Game Script, was the Steelers. With Mason Rudolph banged up, Pittsburgh turned to Devlin Hodges as the team’s starting quarterback. Pittsburgh ran an extremely ball-controlled offense: just two of Hodges’s completions were 6 or more yards down the field, and none were more than ten yards from the line of scrimmage. The ground game was moderately effective, picking up 9 first downs on 36 carries, but this was a game that swung on early turnovers. The final score does not reflect the Game Script very well in this one.

The full week 6 Game Scripts data, below: [continue reading…]

{ 0 comments }

Aaron Rodgers had the best game of his career – by pure ANY/A standards – in week 7. Meanwhile, Sam Darnold had the worst game of his short career, an embarassing performance where the entire Jets team looked outmatched.

I’m short on time today, so here are the full passing results from week 7.

RkQuarterbackTmOppResultAttYdsTDIntSkYdsANY/AVALUE
1Aaron RodgersGNBOAKW 42-2431429501816.28310
2Kirk CousinsMINDETW 42-3034337400012.26193
3Jacoby BrissettINDHOUW 30-2339326401510.03137
4Philip RiversLACTENL 20-233832920139.38109
5Derek CarrOAKGNBL 24-4228293210010.29103
6Ryan TannehillTENLACW 23-2029312212179.3586
7Matthew StaffordDETMINL 30-4245364412128.2377
8Jared GoffLARATLW 37-103726820008.3264
9Teddy BridgewaterNORCHIW 36-253828120188.0356
10Matt SchaubATLLARL 10-37665100014.1745
11Josh AllenBUFMIAW 31-2126202202148.1443
12Gardner MinshewJAXCINW 27-1732255102117.7640
13Mike GlennonOAKGNBL 24-42336100018.6736
14Ryan FitzpatrickMIABUFL 21-313528211007.3426
15Patrick MahomesKANDENW 30-6117610008.7324
16Johnny HekkerLARATLW 37-1012300002316
17Brett KernTENLACW 23-201110000114
18Matt MooreKANDENW 30-61911710126.753
19Lamar JacksonBALSEAW 30-162014300126.713
20Zach PascalINDHOUW 30-231000000-7
21Dak PrescottDALPHIW 37-1027239113266.27-10
22Deshaun WatsonHOUINDL 23-3034308123175.97-23
23Carson WentzPHIDALL 10-3726191113234.93-48
24Case KeenumWASSFOL 0-91277003273.33-49
25Jimmy GaroppoloSFOWASW 9-02115101254.39-51
26Russell WilsonSEABALL 16-304124111105.14-61
27Kyler MurrayARINYGW 27-2121104002153.87-63
28Tom BradyNWENYJW 33-04524911004.98-73
29Mitchell TrubiskyCHINORL 25-3654251202164.91-94
30Matt RyanATLLARL 10-3727159015382.38-135
31Joe FlaccoDENKANL 6-3034213008723.36-136
32Daniel JonesNYGARIL 21-2735223118673.05-152
33Andy DaltonCINJAXL 17-2743276132183.18-154
34Sam DarnoldNYJNWEL 0-33328604113-3.24-324
Total92669174420574196.590

Like most weeks, the team with the passing edge won the game; if anything, this was a more extreme week in that regard.

{ 0 comments }

The Patriots Pass Defense Is Impossible

We are never going to see this level of statistical dominance by a pass defense again.

That’s a pretty bold statement from a pretty conservative blog focused on football history. But 1 passing TD allowed and 18 interceptions in a 7-game stretch?

That will never happen again, and frankly, we may not ever see anything all that close to it happen again. In 2018, the NFL finally exceeded a 2-to-1 ratio of passing touchdowns to interceptions, and the long-term trend is clear: more touchdown passes, fewer interceptions. This season, the 31 pass defenses in the NFL outside of Foxboro have allowed 319 passing touchdowns and forced 155 interceptions, a 2.06-to-1.00 ratio. But the Patriots have forced opposing passers into a 1-to-18 ratio. Include New England’s pass defense, and the NFL’s TD/INT ratio drops to 1.85-to-1.00.

That. Is. Absurd.

Yes, the quarterbacks have been bad. Really bad in some cases (Luke Falk, Josh Rosen), but it also includes games from Ben Roethlisberger, Sam Darnold (coming off a dominant performance), and occasionally competent passers like Case Keenum, Josh Allen, Daniel Jones, and Ryan Fitzpatrick. But it doesn’t matter: if you would have asked me could the best defense in the NFL produce a 1-to-18 ratio against the worst quarterbacks in the NFL for a 7-game span, I would have said no.

This is obviously unsustainable but it is so far to the right tail of comprehensible that you just have to look at the stat line in awe. And know that something like this will never happen again. New England’s defense has posted a passer rating of 35.6; if you throw an incomplete pass on every plat, that’s a 39.6 passer rating! New England is allowing less than 1.0 ANY/A over 7 games! If a running back had 1,000 yards on his first 100 carries of the season, that would be unsustainable, too, but it wouldn’t make it any less remarkable. It might make it more remarkable, because this transcends any notion of what we would think possible.

The graph below shows the TD% (on the X-Axis) and INT% (on the Y-Axis) for each pass defense this year. To make “up and to the right” the good part of the graph, I have plotted the TD% in reverse order. As you can see, the Patriots pass defense stands alone. [continue reading…]

{ 0 comments }

Leonard Fournette and Yards per Carry

Leonard Fournette is averaging 5.0 yards per carry this season, a year after producing an anemic 3.3 average in 2018. After Fournette’s latest performance against the Bengals, his career average gain has once again bounced north of four yards. This prompted our friend Adam Harstad to note on Twitter that all those who were down Fournette because of his low yards per carry average could now rest easy since his YPC is once again above 4.0.

The graph below shows Fournette’s career yards per carry average after every game of his 28-game career.

[continue reading…]

{ 0 comments }

Panthers running back Christian McCaffrey is having an outstanding season. Through 6 games, the former Stanford star has 923 yards from scrimmage, which represents 41% of Carolina’s 2,250 total yards. He has a huge lead in “percentage of team yards” over everyone else: Dalvin Cook, Le’Veon Bell, and Leonard Fournette all have just a hair over 1/3 of their team’s total yards.

Only two players in NFL history have picked up over 45% of their team’s total yards from scrimmage: O.J. Simpson in 1973 and Maurice Jones-Drew in 2011.

The table below shows the top 100 seasons in NFL history in percentage of team yards from scrimmage. [continue reading…]

{ 0 comments }
Next Posts Previous Posts