
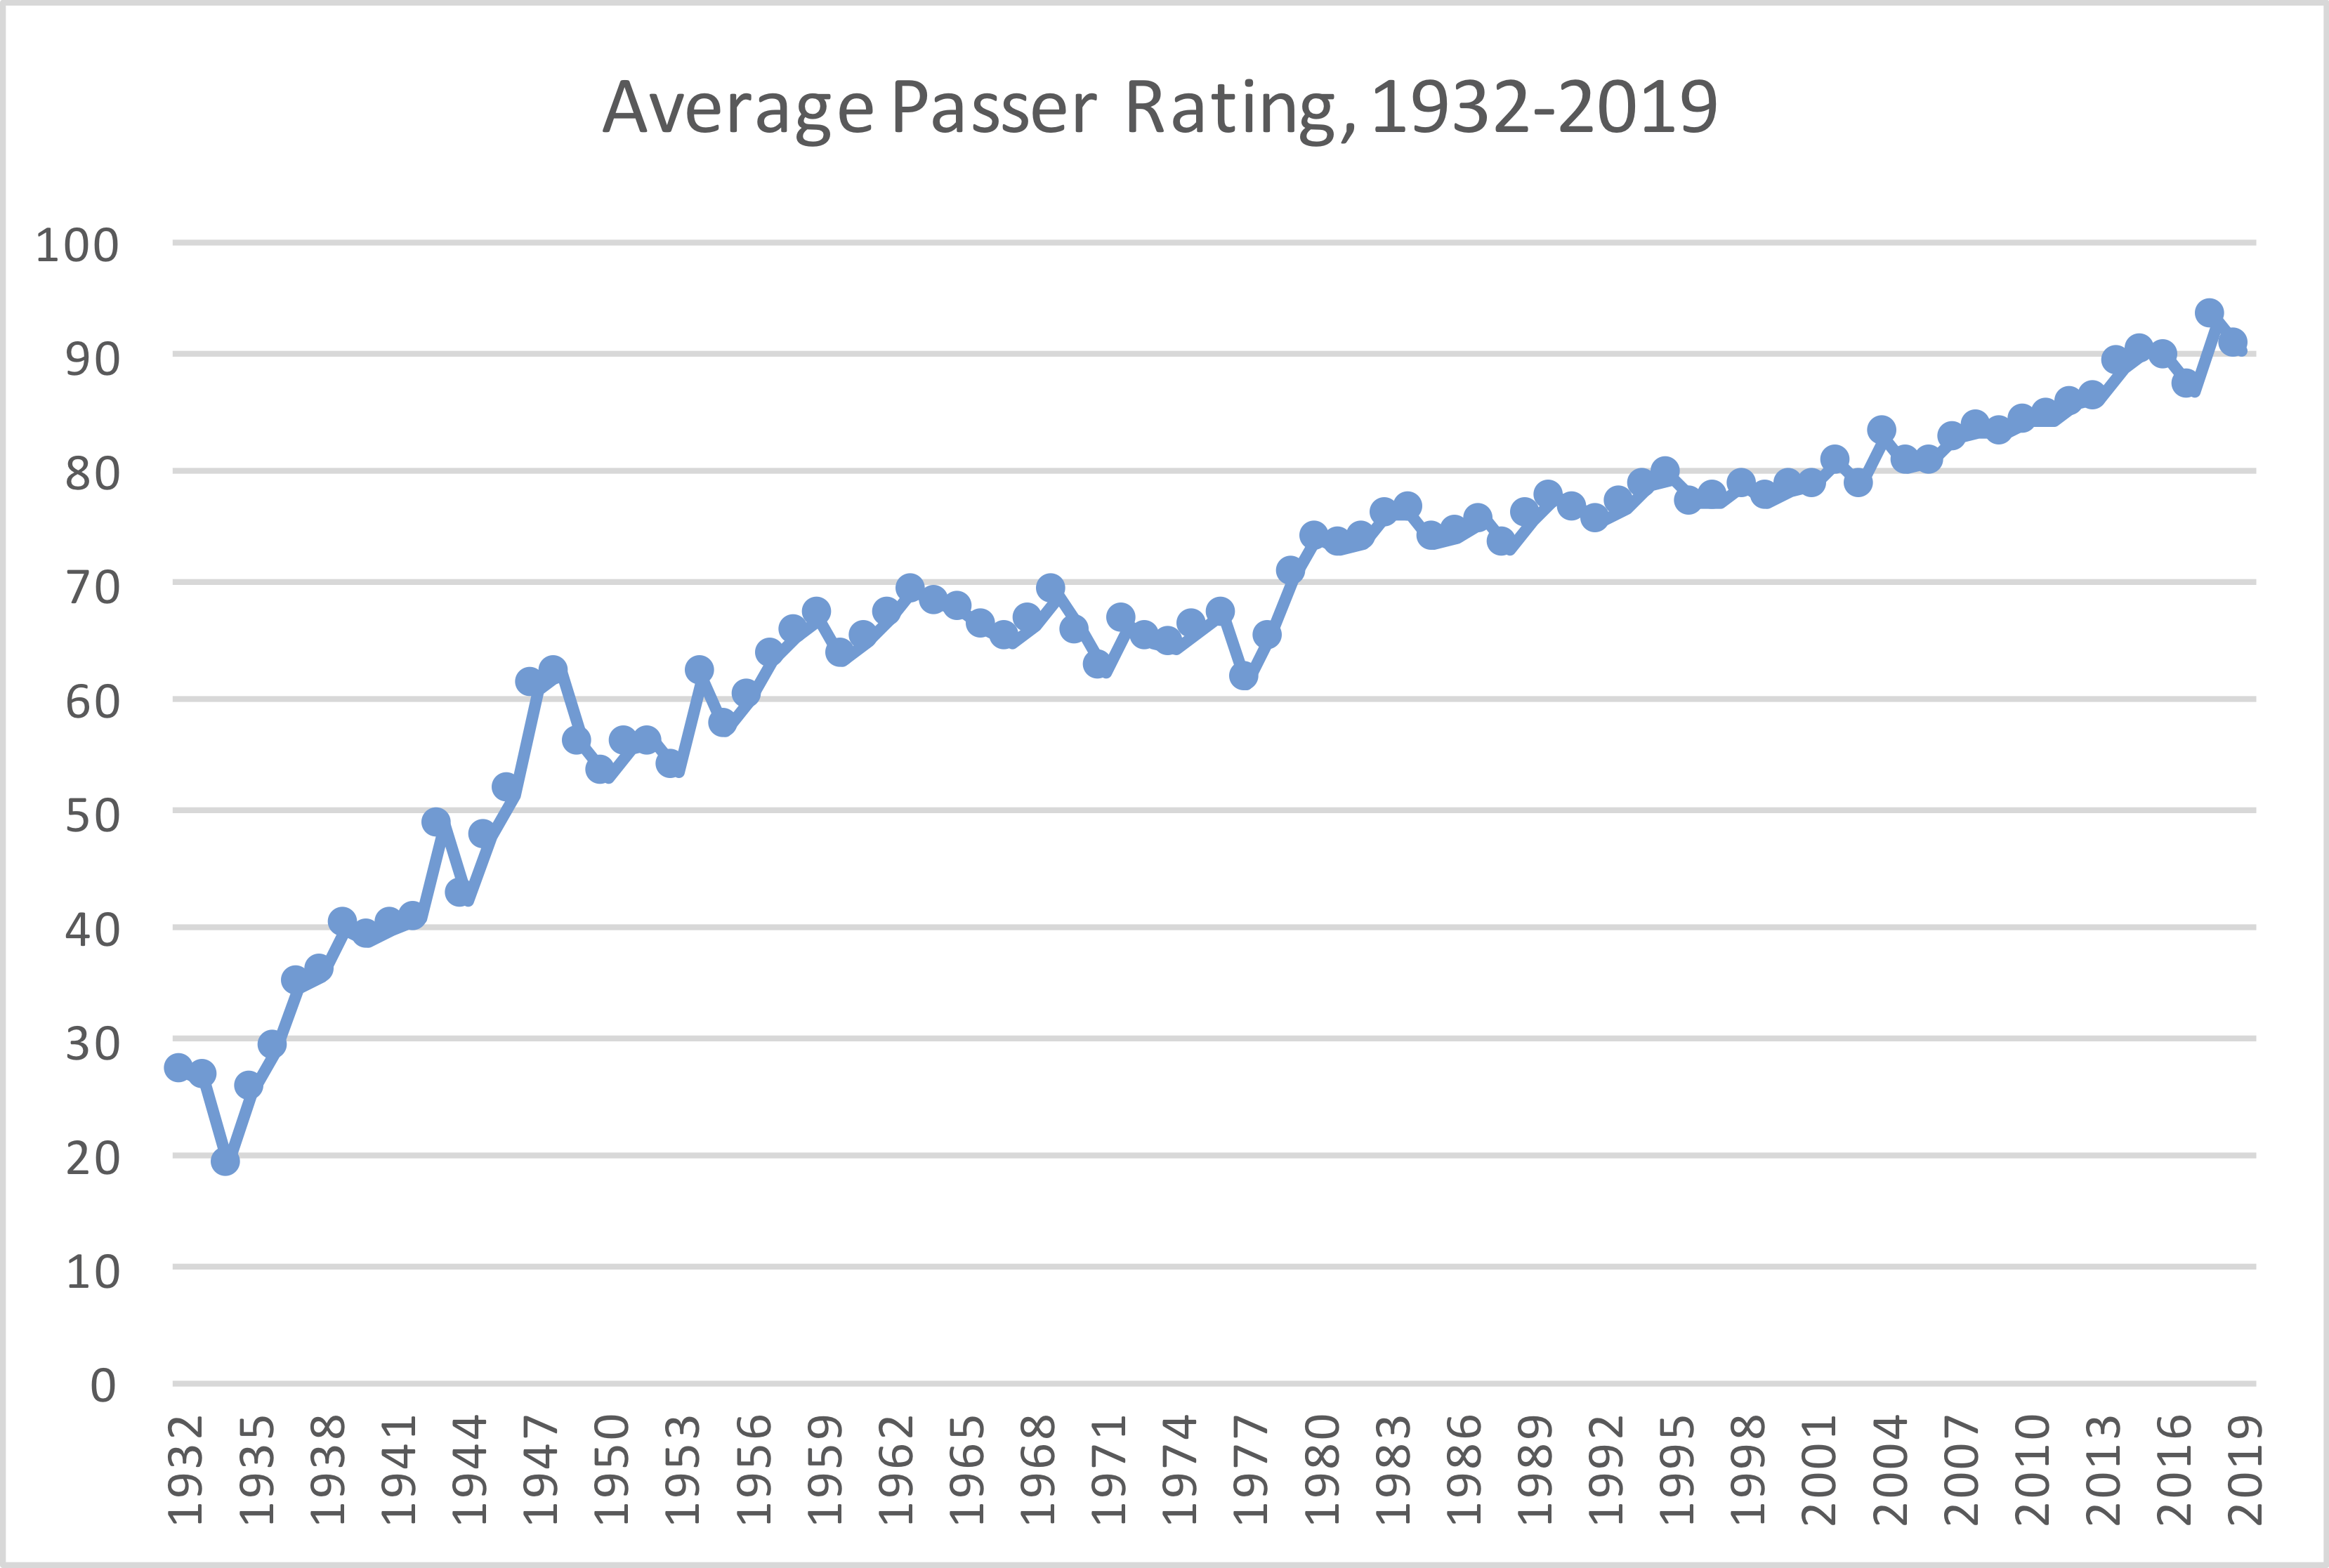
Over the last few years, I have been updating the career passer ratings for NFL quarterbacks to adjust for era. Over the last 100 years, the NFL has consistently approved rules changes to make passing easier, and as a result, passer rating has consistently spiked:
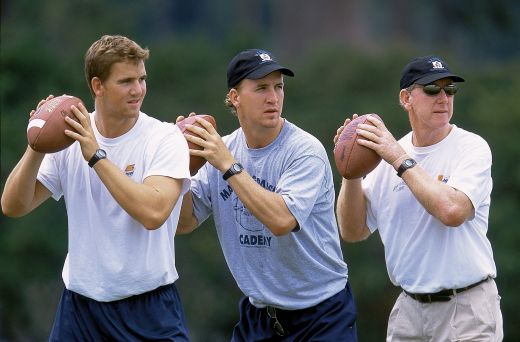
In a few weeks, Alabama quarterback Tua Tagovailoa will be drafted early in the first round of the 2020 NFL Draft. In doing so, he will become the fourth Crimson Tide passer to get drafted in the first round (in addition to Hall of Famers Bart Starr and Ken Stabler, who were not first round picks). But in the current, golden era of Alabama football, this isn’t much of a surprise: in fact, his former teammate, QB Jalen Hurts, will also hear his name announced during this draft.
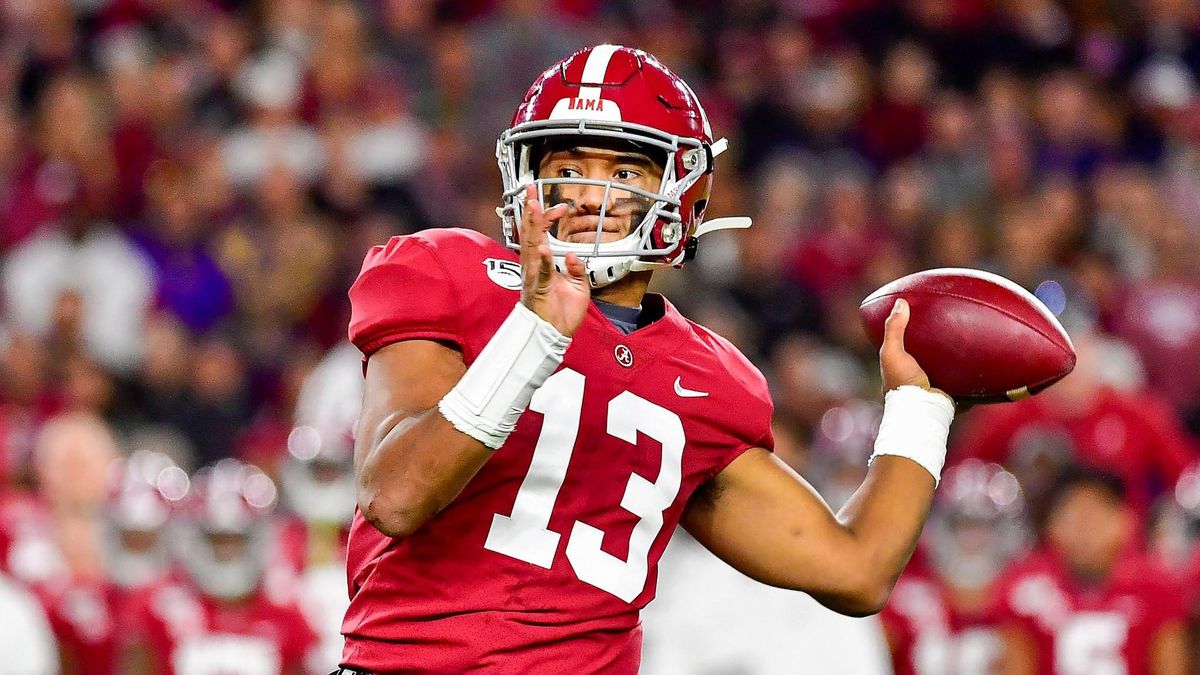
The rarest of sights: a quarterbacks throwing a football with his left hand.
Being born in Hawaii and of Samoan descent makes Tagovailoa a rarity in NFL circles, but not unique: he will join Marcus Mariota as the second such quarterback in the NFL.
But there is something particularly distinct about Tua: he throws the football with his left hand. The last quarterback in the NFL who was lefthanded was Kellen Moore, who went undrafted eight years ago in 2012 and has not thrown a pass in the NFL since 2015 (and, of course, is now the offensive coordinator for the Cowboys). The last southpaw quarterback to get drafted in the first round was Tim Tebow.
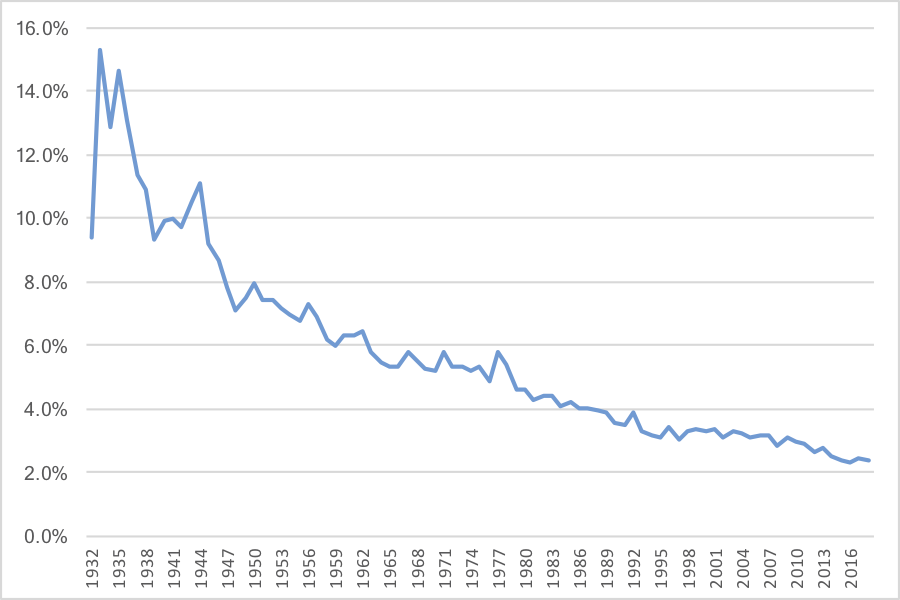
Over the last decade, the lefty has disappeared from the NFL passing landscape. Sure, you get the occasional lefthanded pass from a Tyreek Hill, Kevin Byard, or Antonio Brown, and the even rarer lefthanded toss by a righty, but the last time a lefthanded quarterback back stated and won a game was Michael Vick back in week 6 of the 2015 season! As I wrote last year, the lefthanded quarterback has been slowly phased out of the game; the graph below shows the percentage of passing yards in each season since 1932 that were thrown by southpaws: [continue reading…]
A year ago, I wrote about the shrinking middle class of quarterbacks from a salary cap perspective: there were 14 teams paying huge dollars to their quarterback, 11 teams with a starter on a rookie contract, and 7 teams caught in the middle. And all 7 of those teams caught in the middle will have new starting QBs in 2020: the Bucs and Titans had QBs playing out their 5th year option, the Bengals, Jaguars, and Broncos had middling veterans, and the Dolphins and Redskins quarterback situations were wide open as of last March (Washington wound up using a first round pick on a quarterback, while Miami is likely to do so this year).
In 2019, there were 32 quarterbacks who threw enough passes to qualify for the league passing title. And over half of those passers were under 27 on September 1st (this includes two quarterbacks from the 2016 Draft, Carson Wentz and Jacoby Brissett, who turned 27 in December). That is the first time since 1960 that over half of the qualifying passers were under 27 as of September 1st of that season.
There also were a lot of old quarterbacks: Matt Ryan, Joe Flacco, Aaron Rodgers, Ryan Fitzpatrick, Philip Rivers, Drew Brees, and Tom Brady were all 34 or older at the start of the season, and that doesn’t even include opening day starters Ben Roethlisberger and Eli Manning. That’s part of another growing trend in the modern NFL, although the presence of more old quarterbacks isn’t quite as noticeable as the increase in young ones.
Where quarterbacks are really getting squeezed is the place you might not expect: during their prime years. A quarterback should still have their physical skill-set, but be further along mentally, in their late 20s and early 30s. A quarterback who is between the ages of 27 and 33 should be, broadly speaking, in the prime of his career. And yet last season, there were just 8 starting quarterbacks in this middle class of life: Jimmy Garoppolo, Derek Carr, Russell Wilson, Ryan Tannehill, Matthew Stafford, Case Keenum, Kirk Cousins, and Andy Dalton.
The graph below shows the percentage of qualifying passers in each season since 1960 that were, as of September 1st of that season: (1) under 27 years old, (2) between 27 and 33 years of age, and (3) 34 or older. [continue reading…]
In 1988, the passer rating for the entire NFL was 72.9. In 2019, every single team had a passer rating higher than that mark! Last season, the Carolina Panthers finished with a 74.7 passer rating, which was both the lowest in the 2019 NFL season and also the highest mark in history by a team that ranked last in that statistic.
This is part of two general trends: passer ratings are going up, but also, the variance in passer ratings is declining. [continue reading…]
In what is becoming a yearly tradition, today I am going to post the era-adjusted passer ratings from the 2019 season.
Passer rating is made up of four variables: completion percentage, yards per attempt, touchdown percentage, and interception percentage. The reason passer rating needs to be adjusted for era? Well, that’s pretty simple to explain.
When the formula was derived in the early ’70s, an average rating in each variable was achieved with a 50% completion rate, averaging 7.0 yards per pass attempt, a 5% touchdown rate, and a 5.5% interception rate. Since those numbers are wildly out of date, I came up with a formula that perfectly matches the intent of passer rating but ties the variables to the league average in any given season. You can get the formulas and read more background in the linked posts.
In 2019, the four averages were 63.5%, 7.22, 4.46%, and 2.30%, respectively. The big changes, of course, are in completion percentage and interception rate; yards per attempt is much more stable throughout history, while touchdown rate is actually slightly lower than it was in the ’70s.
One thing to keep in mind: these adjustments will not change the order of passer ratings in a given season. So Ryan Tannehill, Drew Brees, Lamar Jackson, Kirk Cousins, and Russell Wilson will remain your top 5 leaders; the way the formula works, it simply subtracts a fixed amount from each passer’s actual passer rating. In 2019, that amount was a whopping 23.7 points from each passer.
Below are the 2019 passer ratings: [continue reading…]

The top passers of 2019 share a word.
In 2019, Mahomes averaged 8.38 ANY/A and the league averaged 6.16 ANY/A. Mahomes missed some time this year due to injury, and finished with 501 dropbacks; he therefore added 1,113 Adjusted Net Yards of value over average. That wasn’t quite on pace with what he did last season, but it was still good enough to lead the league.
But it was Ryan Tannehill — who finally had his breakout season — who finished #1 in the NFL in ANY/A. Replacing Marcus Mariota in midseason, Tannehill averaged 8.52 over 12 games, 10 starts, and 317 dropbacks. That last number is why he only finished 5th in VALUE; he didn’t play long enough to add as much value as Mahomes, Dak Prescott, presumptive MVP Lamar Jackson (who also averaged 80.4 rushing yards per game), or Drew Brees.
The worst five quarterbacks in VALUE added, from 28th to 32nd: Giants rookie Daniel Jones, Browns second-year QB Baker Mayfield, soon to be ex-Bengals QB Andy Dalton, Bears third-year QB Mitchell Trubisky, and Panthers second-year QB Kyle Allen.
The full stats, below: [continue reading…]
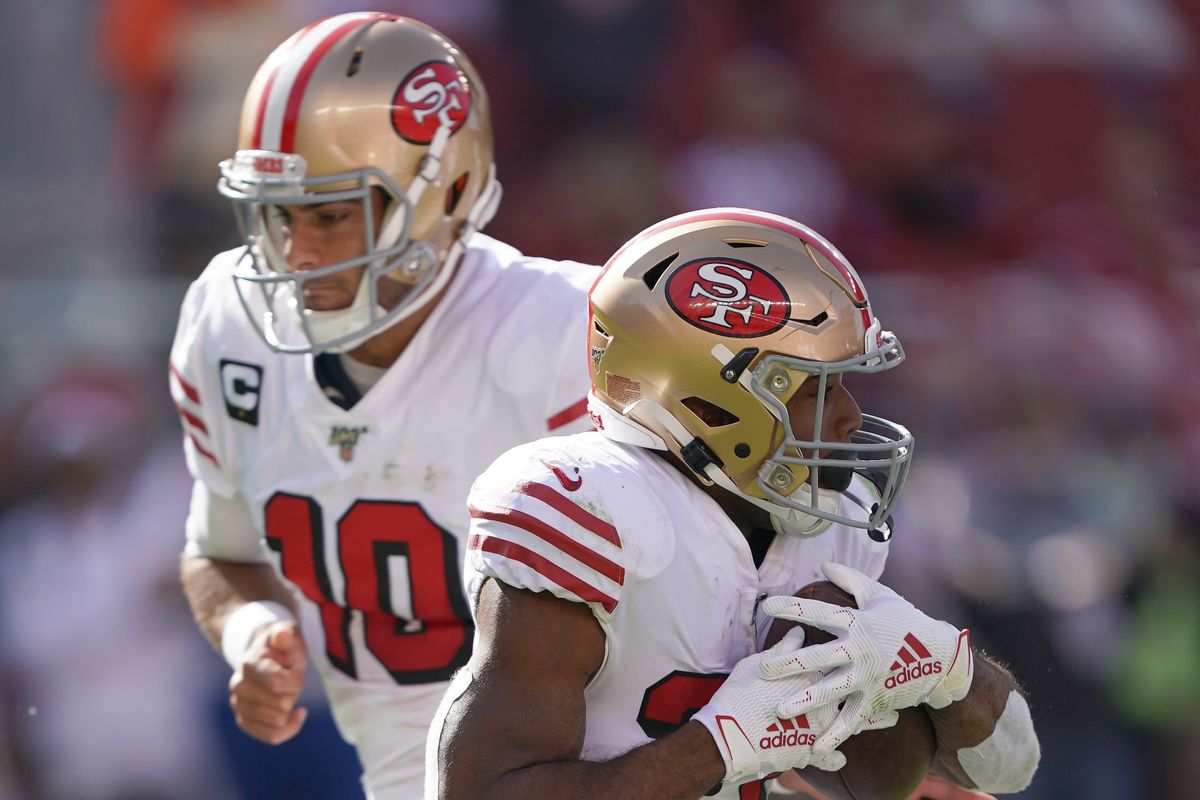
The 49ers offensive production has been driven by its skill position players.
Let’s start by recognizing that none of today’s analysis is about the quarterback himself; rather, it is about the situation that each team’s quarterback finds himself placed in. Let’s begin with Game Script.
Average Points Differential
Garoppolo has 266 plays this season: 226 pass attempts, 12 sacks, and 28 rushes. On average, during each of those 266 plays, the 49ers have led by 5.4 points. That makes life a lot easier for Garoppolo compared to just about every quarterback. Matt Ryan, on the other hand, is constantly in a situation where the pressure is on for him to score: his average play has come with the Falcons trailing by 10.0 points. [continue reading…]
In March, I wrote about the shrinking middle class of quarterbacks: most teams were either paying superstar dollars to a quarterback or going with a cheap player still on a rookie contract. In fact, at the time of the article, there were just 7 teams that didn’t clearly fit that category: the Redskins (who had been paying Alex Smith and have since drafted Dwayne Haskins), the Dolphins (who appeared to be tanking on the quarterback position), and then five teams truly stuck in no man’s land: the Titans and Bucs, who were using their 5th-year option on Marcus Mariota and Jameis Winston, and the Bengals (still hanging on to Andy Dalton), the Jaguars (traded for Nick Foles), and the Broncos (traded for Joe Flacco).
At the halfway mark of the season, I wanted to check in on the league’s passing offenses by looking at two variables: salary cap dollars allocated to quarterbacks and offensive Adjusted Net Yards per Attempt. That is shown in the graph below.
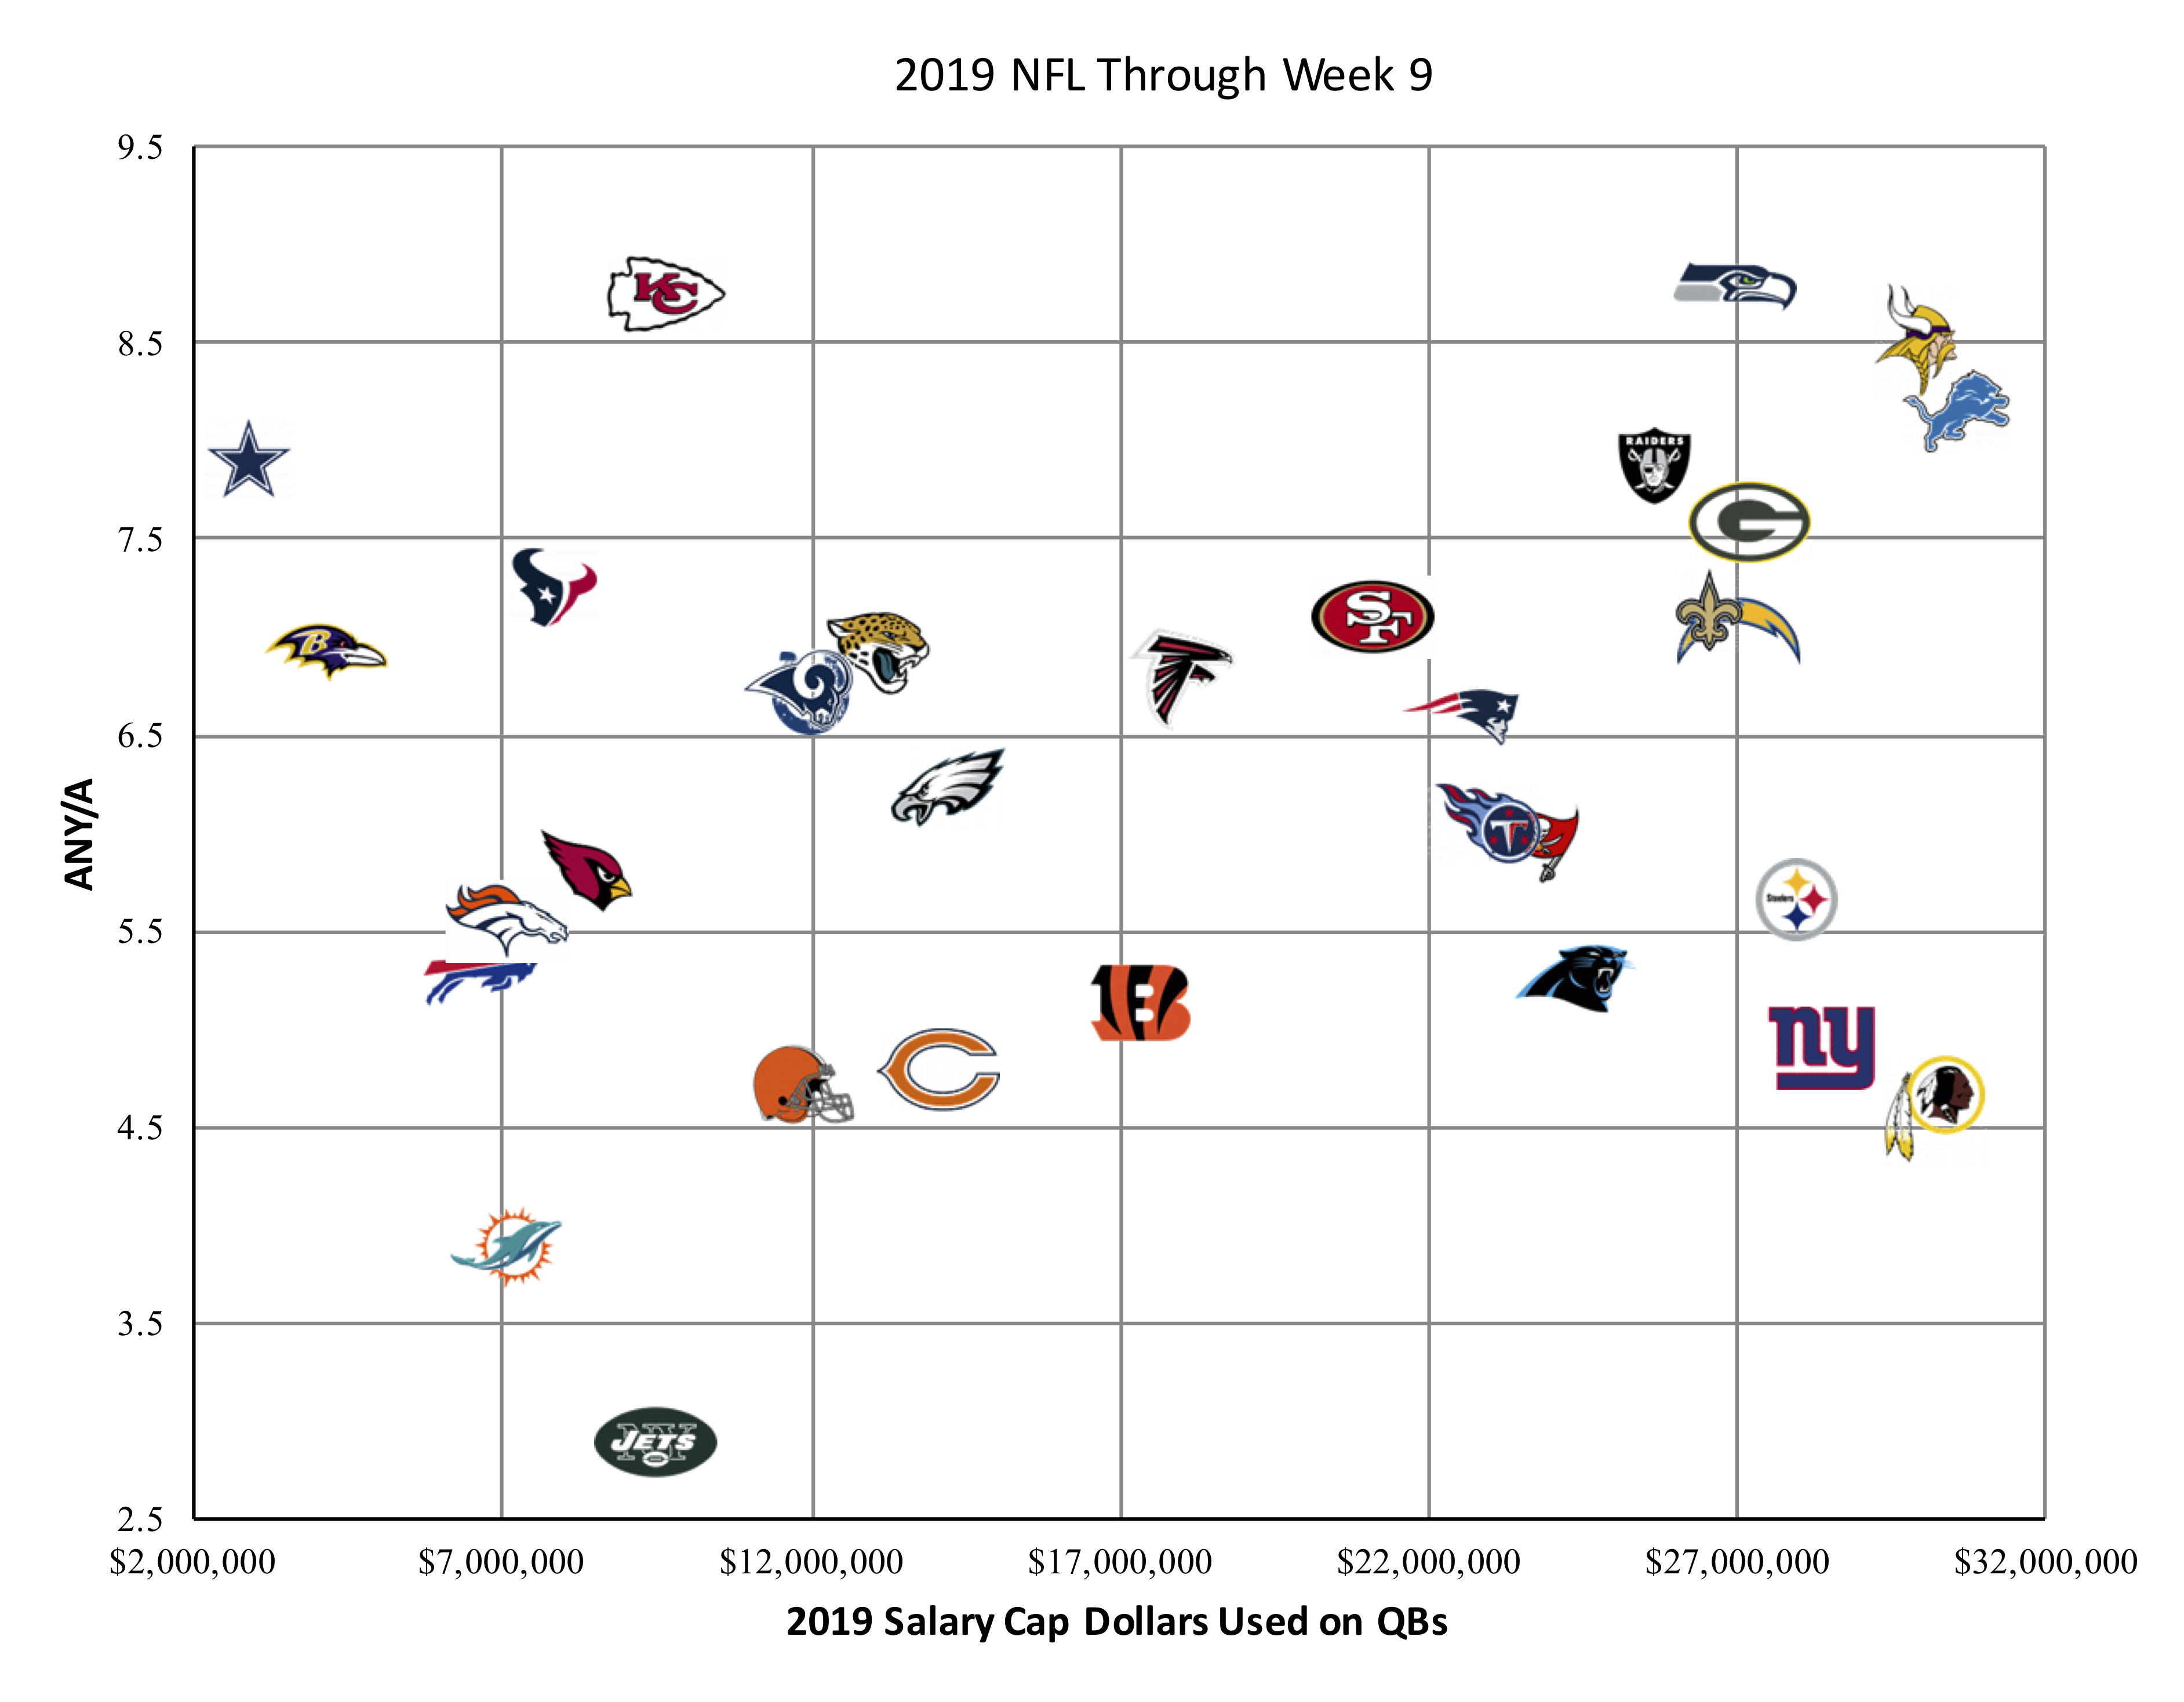
Or, better yet, let’s redraw that graph. [continue reading…]
You probably don’t think much about Vince Young these days, but I wrote a bit about him this summer. One thing that stood out to me about Young’s career was that for a running quarterback, he didn’t take many sacks. There are 20 quarterbacks since 1970 to rush for 1,000 yards and average at least 20 rushing yards per game in their careers; Young (5.98%) and Steve McNair (5.29%) are the only two quarterbacks with a sack rate below 6.5%.
Young’s best sack season was 2009, when he had just 9 sacks. Young actually finished with more rush attempts (55) than sack yards lost (36), which seemed basically impossible. Young remains the only player since at least 1970 to accomplish that fact, among quarterbacks with enough pass attempts to qualify for the passing title.
For his career, Young had 3.4 rush attempts for every sack, which is outstanding and the best mark among quarterbacks with at least 500 pass attempts (Tim Tebow was at 4.8, but he had just 361 pass attempts). But Lamar Jackson is hot on Young’s heels, and is quickly establishing himself as the best combination of rushing threat/sack avoider in NFL history.
Last year, Jackson didn’t qualify for the passing title, but he was even more impressive than 2009 Young when it came to sack yards lost and rushing attempts. As a rookie, Jackson had 147 rushing attempts and lost just 71 yards to sacks! Along with ’09 Young, he became just the third player with at least 6 times as many rushing attempts as sacks, minimum 150 pass attempts.
Jackson averaged 43.4 rushing yards per sack, which is basically an unfathomable number for a quarterback. And this year, Jackson’s sack rate has dropped from 8.6% to 7.3%; and while he’s running less, his rushing yards to sack ratio is still outstanding.
The top four seasons since 1970, minimum 100 pass attempts, in rushing yards to sacks are:
1) Lamar Jackson, 2018 (43.4 to 1)
2) Lamar Jackson, 2019 (33.9 to 1) [current through week 8]
3) Steve Young, 1991 (31.9 to 1)
4) Vince Young, 2009 (31.2 to 1)
For his career, Jackson is averaging 7.0 rushing attempts per sack. Tebow is at 4.8, Ray Lucas at 3.5, Young at 3.4, and then Kordell Stewart is fifth at 3.3. It is just as, if not more dramatic, when we look at rushing yards per sack.
Lamar Jackson is the leader at 38.5, followed by Tim Tebow at 24.1, Terrelle Pryor at 20.2, Michael Vick at 19.3, a young Josh Allen at 18.4, and then Vince Young at 17.6.
Some of Jackson’s crazy numbers here are just the result of him being the most rushing-heavy quarterback in modern history. He’s averaging an absurd 55 rushing yards per game for his career and an even more absurd 81 rushing yards per game since becoming a starting quarterback. But most of the other really run-oriented quarterbacks had bad sack rates: Tebow was at 10.2%, Bobby Douglass 12.2%, and Michael Vick was at 9.8% when with the Falcons. Jackson is at 7.9%, and I’ll be curious to see if he can keep this going.
I’ll close with a graph showing all quarterbacks since 1970 with at least 224 pass attempts. The X-Axis shows career rushing yards per game, while the Y-Axis shows career sack rate. See if you can spot Jackson.
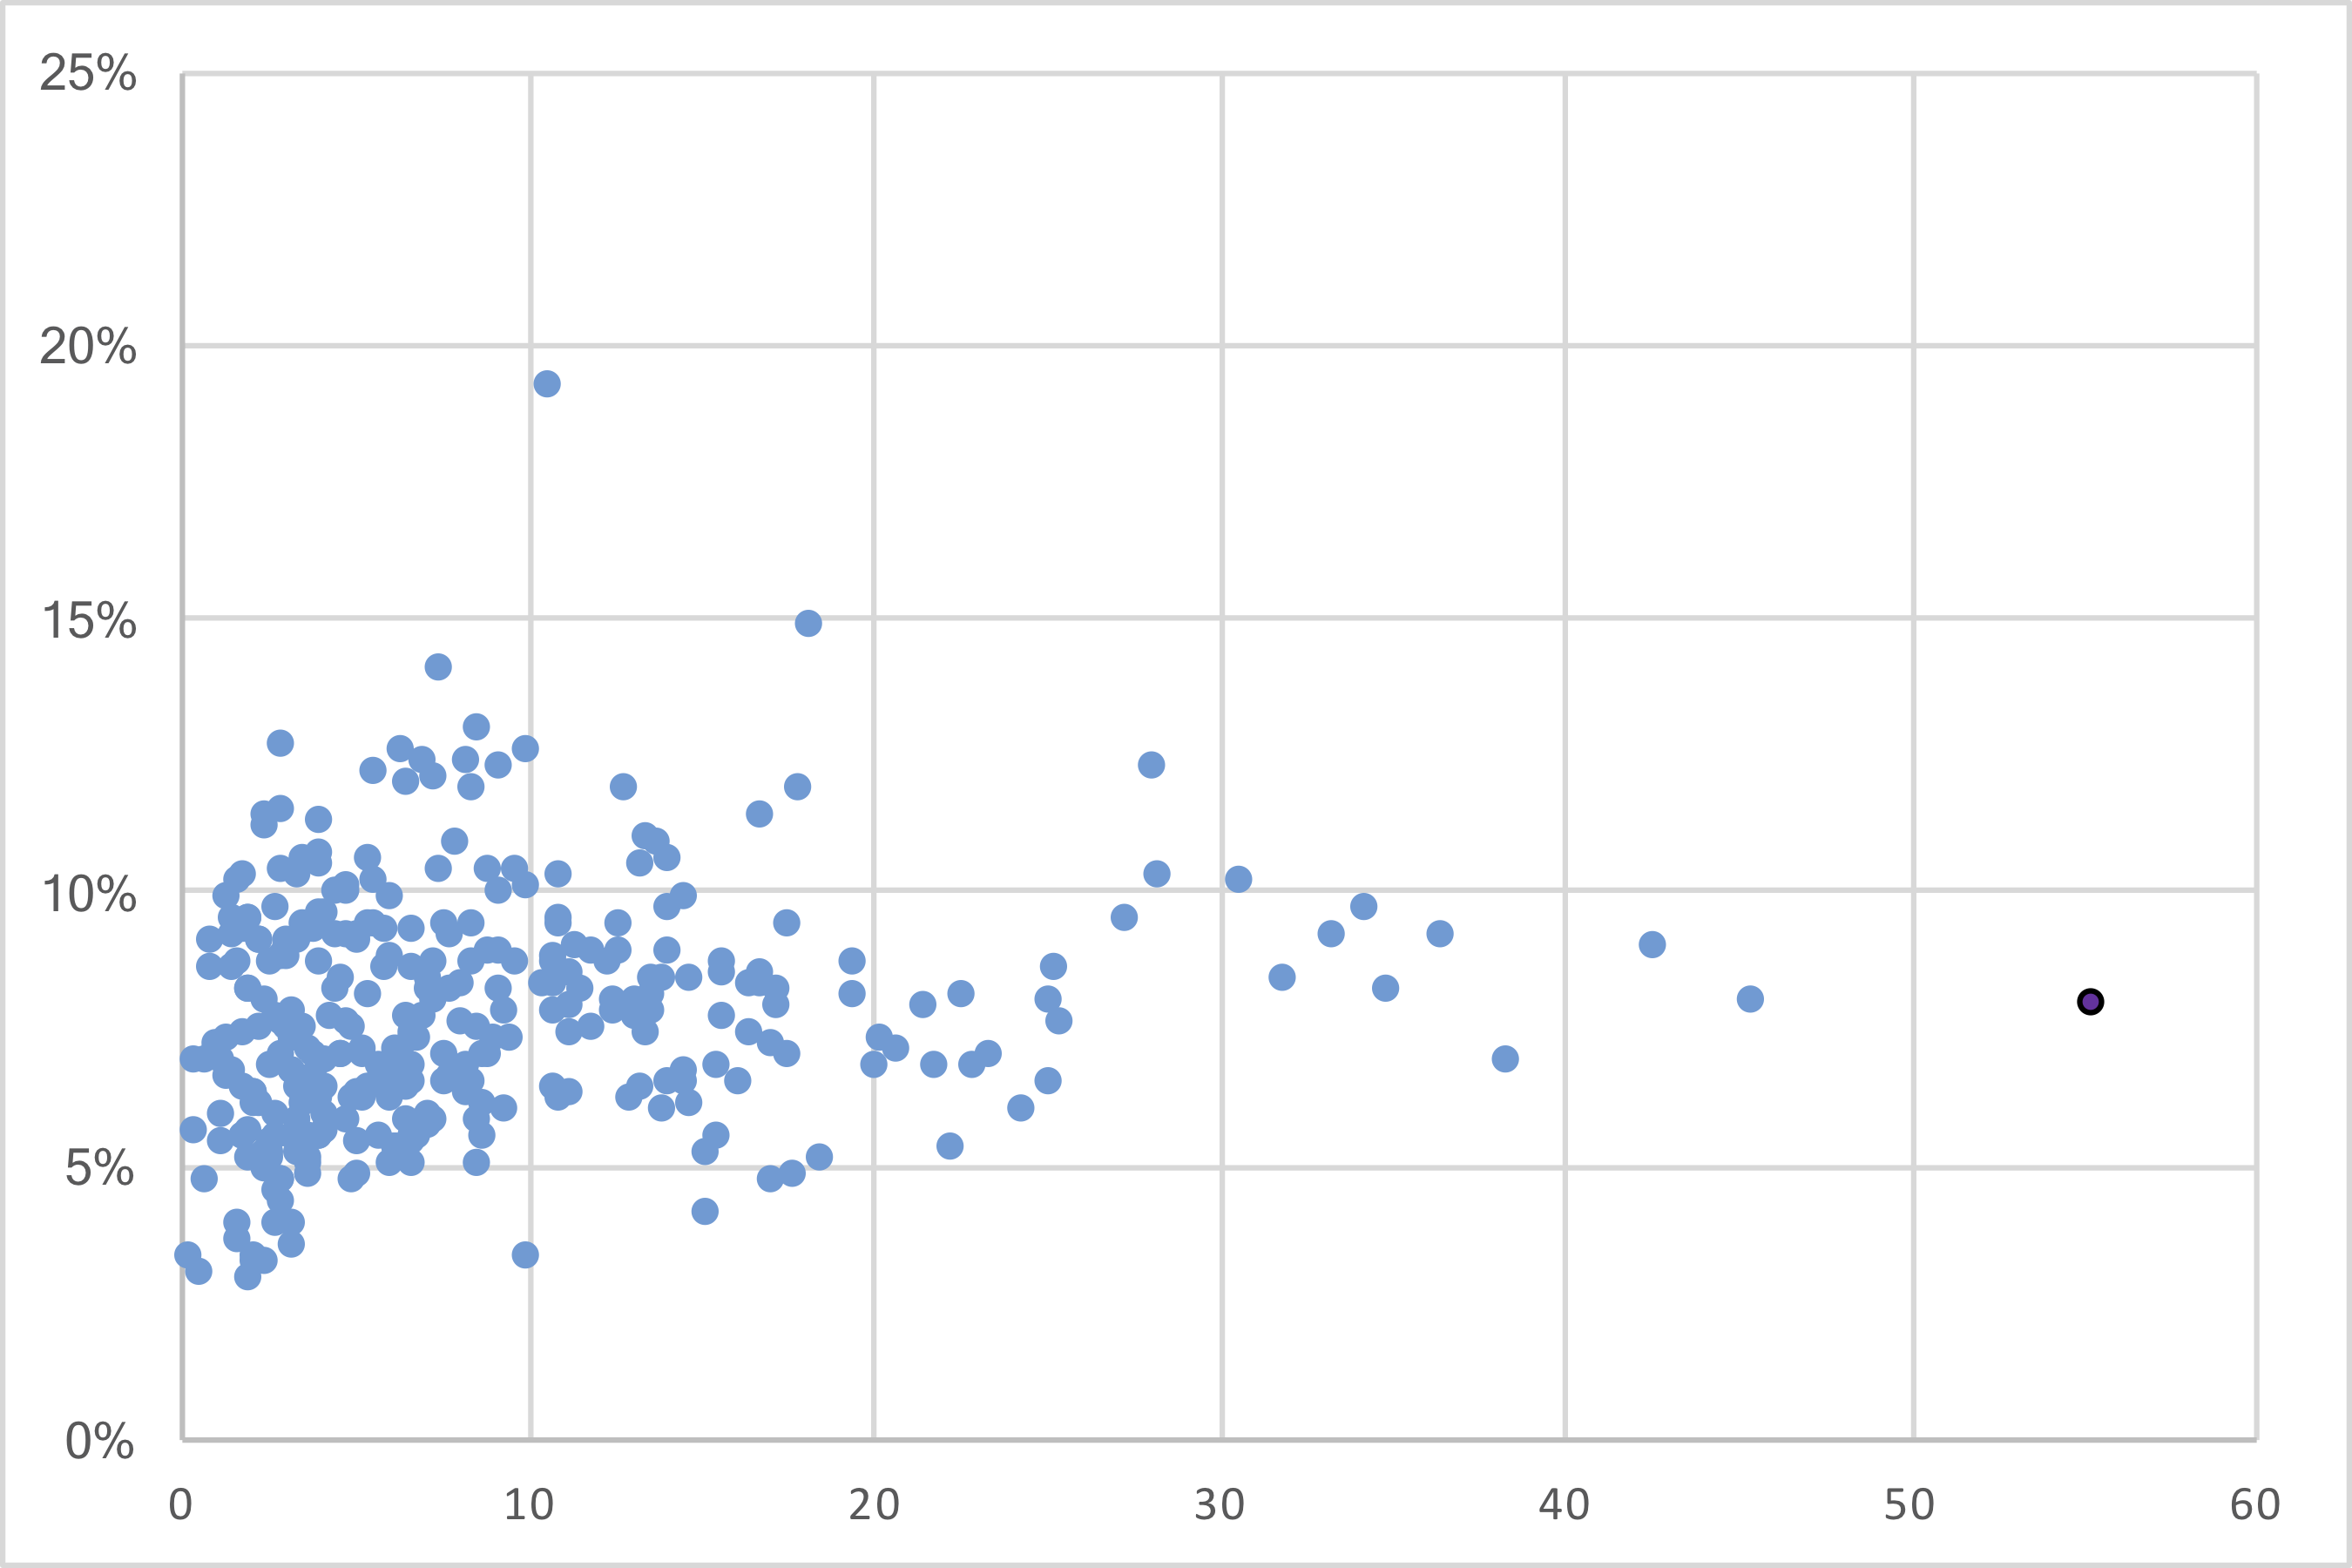
And yes, it was important to get this in before Jackson faces the Patriots this weekend.
Can you spot the HOF QB?
Today I want to compare how Eli Manning has fared, statistically, to the rest of the NFL. Manning was the first pick in the 2004 Draft, and so I looked at all passing stats in the NFL from 2004 through week 2 of the 2019 season. [continue reading…]
Adam Steele is back for another guest post. You can view all of Adam’s posts here. As always, we thank him for contributing.
It’s been a few years since I updated my Marginal Air Yards metric, so that’s what today’s post will do. I decided to make this a purely style based statistic rather than trying to combine style with efficiency. As such, here is the updated formula:
mAir = (completed air yards / completions – league average) * completions
Said simply, Marginal Air Yards represents the total depth of a passer’s completions compared to league average. A quarterback who averages 7.0 AirY/C on 300 completions in a league that averages 6.5 AirY/C will be credited with +150 mAir (i.e., 0.5 x 150). [continue reading…]
Today’s guest post comes from one of the longest followers of this blog (and its predecessor), Richie Wohlers. Richie is 44-year-old accountant from Southern California who is a Dolphins fan despite never being to Florida. As always, we thank our guest posters for contributing.
One of the stereotypical traits of a great quarterback is to be able to rescue his team from certain defeat in the fourth quarter by leading his team to a come-from-behind win. Thanks to the awesome work of Scott Kacsmar, we now have definitions for what it means to have a “4th quarter comeback”.
I began watching football in the early ’80s, and for most of the late ’80s and early ’90s I had heard that Dan Marino and John Elway were battling for the title of most 4th quarter comebacks (4QC). You can run a query on Pro Football Reference and see that when Elway retired, he was tied with Marino for most 4QC. Marino picked up 2 more 4QC after Elway retired and then Marino retired as the all-time leader in the regular season.
In this game in 2009, Peyton Manning recorded his 34th 4QC to become the new all-time leader. Entering the 4th quarter trailing by 3 points and scoring the winning touchdown with 5:23 left isn’t the most exciting of comebacks, but it counts, nonetheless.
Manning remains the leader with 8 more 4QC than Tom Brady and 9 more than Drew Brees.
I was a Dan Marino fan, and always loved when he was listed at the top of the unofficial leaderboard for 4QC, but it felt a little hollow to me. Joe Montana also had a lot of comebacks, but it seemed to me that his team trailed in 4th quarter far less often than Marino’s teams. This meant that Marino had far more chances to rack up his 4QC than did Montana. In fact, Marino’s teams lost almost twice as many games during his career as Montana.
So which QB’s have had the best success rate for 4QC given the number of chances they had?
In order to figure out the 4th Quarter Comeback Percentage (CB%), I am dividing the number of successful 4QC by the number of opportunities. By Kacsmar’s definition, a QB can only earn a comeback if the team trailed or was tied at some point in the fourth quarter, and some type of offensive scoring drive put points on the board in the 4th quarter while the team trailed by one possession or were tied and of course the team had to win the game.
I calculated a 4QC opportunity as the sum of all of a quarterback’s losses, plus all his ties, plus all his successful comebacks. There is a little bit of slop in these numbers for a few reasons.
- A QB’s W-L-T record on PFR is based on games started, so if a QB came on in relief and trailed in the 4th quarter but did not get a 4QC it will not count as a failed opportunity for him. Likewise, if he does get a 4QC, PFR still won’t credit him with a win.
- If the defense scored the winning points it would not be a 4QC and would also not count as a failed opportunity.
- If a team never trailed in the 4th quarter, but the game ended up as a tie, this would have never been an opportunity to earn a 4QC for the QB.
- I think the 25 points by Neil Lomax was the largest 4th quarter comeback in history. So, any deficit of more than 25 would be nearly impossible, but it will still count as a failed opportunity. I’m fine with that, because any team trailing by more than 25 points probably got there because the QB wasn’t playing well to begin with.
There are probably a few other exceptions, but this should still create a reasonable approximation of 4QC success rate. The denominator is therefore (QB Losses + QB Ties + Successful 4th Quarter Comebacks). The numerator is Successful 4th Quarter comebacks plus QB Ties divided by 2, so a quarterback gets half-credit for each tie.
On average, these quarterbacks have a 19% success rate. The table below shows every QB who has had at least 5 opportunities for 4QC since the merger (including pre-merger stats for quarterbacks who played after the merger, but only back to 1960 for Len Dawson, John Brodie).
The final column shows how each quarterback fared relative to the average 19% success rate. Let’s use Peyton Manning as an example. He had 79 career losses, 0 ties, and 43 successful 4th quarter comebacks: therefore, he had 122 opportunities. Given the 19% success rate for the average quarterback, we would expect an average quarterback to have 23.1 successful comebacks. Instead, Manning has 43, or 19.9 more than expected. That’s the most of any quarterback; his father has the fewest. [continue reading…]
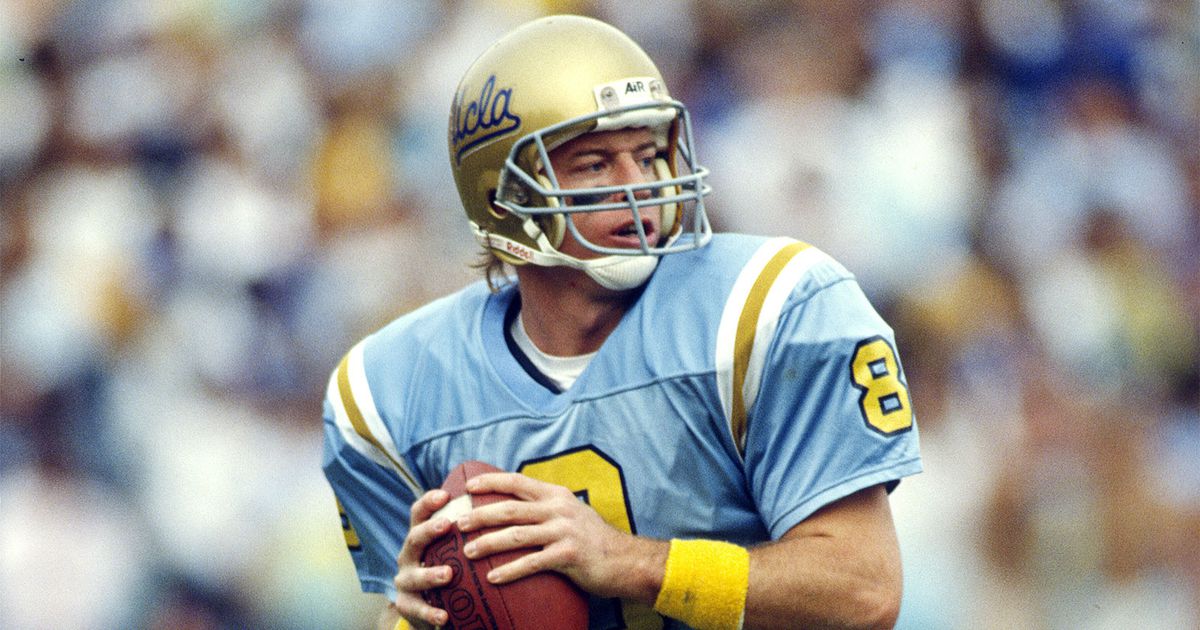
A UCLA quarterback who stunk as a rookie.
Now, does he have excuses? Absolutely. As Bill Barnwell wrote, Rosen faced some pretty rough circumstances last year, particularly when it came to his offensive line.
Other rookie quarterbacks have started their careers behind porous offensive lines, of course, but not to this extreme. By the end of last season, the Cardinals had lost all five of their starting linemen to injuries. During the second half of 2018, the five linemen who took snaps most frequently protecting Rosen included a pair of rookies (third-rounder Mason Cole and seventh-rounder Korey Cunningham), a player signed off Minnesota’s practice squad (Colby Gossett) and a pair of veterans who were cut by teams and almost immediately stepped off the street and into Arizona’s starting lineup (Oday Aboushi and Joe Barksdale). It’s one thing to have a relatively untalented line, but the Cardinals were starting guys who barely knew the playbook at times.
Now, given that we know Rosen was terrible as a rookie, how likely is he to still turn out to be a good quarterback?
The Eight That Turned It Around
Since 1967, there have been 8 quarterbacks who were drafted in the first round, played more than a handful of snaps as a rookie, were very bad, and then one day became a good quarterback.
They are: Terry Bradshaw, Troy Aikman, Eli Manning, Matthew Stafford, Jared Goff, Donovan McNabb, Bert Jones, and Alex Smith.
All 8 quarterbacks had era-adjusted passer ratings of under 50 as a rookie; they averaged a collective 39.1 era-adjusted passer rating, slightly worse than what Rosen (40.5) averaged in 2018. All 8 quarterbacks finished at least 2.00 ANY/A worse than average; collectively, they were 3.07 ANY/A worse than league average, slightly worse than Rosen’s -2.79 RANY/A in 2018. [continue reading…]
Last year, I wrote a two-part series on how teams were using more highly drafted players. In 2017, 50% of all passes came from players selected in the top 32 of the draft, but I suspected that 2018 could be even more tilted in favor of highly drafted players. The reasons I suspected all came true, namely:
- Baker Mayfield, Sam Darnold, Josh Allen, and Josh Rosen all entering the NFL and potentially getting a significant number of pass attempts (all topped 300, as it turned out).
- Andrew Luck and to a lesser extent, Ryan Tannehill returned from injury.
- Patrick Mahomes became a starter, replacing 250th pick Trevor Siemian as an NFL starter, once you net out the Alex Smith (KC to WAS), Kirk Cousins (WAS to MIN), and Case Keenum (MIN to DEN) musical chairs. Deshaun Watson also became a full-time starter in 2018, but he actually falls below the median line as the 12th pick.
Thanks to those new starters, plus returning starters Eli Manning, Jared Goff, Matthew Stafford, Cam Newton, Jameis Winston, Alex Smith, Mitchell Trubisky, Carson Wentz, Marcus Mariota, Matt Ryan, Blake Bortles, Philip Rivers and 101 pass attempts from Blaine Gabbert – and yes, those 101 attempts were necessary — 2018 was a record-setting year. Over half of all pass attempts in the NFL came from players drafted in the top 10 just the second time that’s happened since 1967 (the year of the common draft).
[continue reading…]
For the last week, I’ve posted about the career passer ratings for quarterbacks after adjusting for era. Today is a simple data dump of the single season passer ratings.
Below are the era-adjusted passer ratings for every player in every season since 1932. Here’s how to read the table below, which is fully sortable and searchable. Sid Luckman has the best single season, playing in the NFL for Chicago in 1943. That season counted for 11.58% of his career pass attempts (useful if you want to calculate a player’s career passer rating), as he threw 202 passes, completed 110 of them for 2,194 yards with 28 TDs and 12 INTs. That was enough attempts to qualify for the passer rating crown; his actual passer rating was 107.5, and his Era Adjusted Passer Rating was 135.0, the best ever. [continue reading…]
On Saturday, I looked at the era-adjusted leaders in completion percentage. On Sunday, I did the same for yards/attempt, and yesterday, I analyzed the era-adjusted leaders in touchdown rate. Today, we continue the analysis but for interception percentage.
Here’s a look at the interception rate in each year since 1932. As you can see, there is much more variation (and in a much more straightforward manner) than there was with TD rate:
Two years ago, I wrote a 6-part series describing how to adjust passer rating for era. I posted the career results in Part V, and the whole series is background reading for anyone who wants to learn how to adjust passer rating for era.
Last year, I updated those numbers based on the 2017 results. Earlier this year, I posted the 2018 single-season results, and today, I am going to update the career ratings.
Here’s how to read the table below. Otto Graham threw 2,626 passes, and played from 1946 to 1955. His actual passer rating was 86.6, but his era adjusted passer rating was 95.2, the best in pro football history. The final column shows whether a player is in the Hall of Fame, is a HOF lock (attributed to five players), is not in the Hall of Fame, or has never been eligible for the HOF. [continue reading…]
Last year, I wrote about the shrinking middle class of quarterbacks in the NFL. After the 2019 NFL Draft, things looked even more polarizing: with four QBs being selected in the top 10, and a fifth joining a “franchise QB” in Baltimore, there was a very small middle class of quarterbacks in the NFL, at least based on salary cap dollars.
That leaves just four teams with non-franchise, non-rookie QBs: the Dolphins with Tannehill, the Broncos with Keenum, the Jaguars with Bortles, and the Bengals with Dalton.
As you know, none of those teams were successful last year, and three of them have gone in a different (albeit similarly unexciting) direction at quarterback. Miami is going to release Ryan Tannehill, and the Broncos and Jaguars swapped out expensive veteran quarterbacks who aren’t franchise quarterbacks in Case Keenum and Blake Bortles for… expensive veteran quarterbacks who aren’t franchise quarterbacks (but have won a Super Bowl!) in Joe Flacco and Nick Foles.
In addition to those four teams, there are three other teams in quarterback purgatory. One is Washington, who lost Alex Smith due to injury (and are paying borderline franchise quarterback dollars to him this year, to the tune of a $20.4M cap hit) and replaced him with Keenum, who at least has an extremely modest base salary in 2019. Of course, going cheap at quarterback with a below-average passer is hardly a strategy teams look to employ, especially when it comes with spending an extra $20M on an injured quarterback. The other two teams found themselves in no man’s land thanks to inconsistent play from the first two picks in the 2015 NFL Draft. Tampa Bay and Tennessee both used the fifth year option to extend the contracts of Jameis Winston and Marcus Mariota, but that leaves them with cap hits in excess of $20M for 2019 despite neither player being a top-10 quarterback. That leaves the Titans and Bucs in a similar space — in terms of both salary cap dollars and quarterback production — to teams like the Bengals, Broncos, and Jaguars.
So, to recap: (i) two teams (Miami and Washington) are lost at quarterback and probably deserve an incomplete grade at this time: both are prime candidates to use a high draft pick on a quarterback in the 2019 Draft, and (ii) five teams (CIN/JAC/DEN/TEN/TB) are stuck paying between $16 and $22M to quarterbacks that are among the least desirable starting quarterbacks in the league.
11 teams, meanwhile, are rolling with quarterbacks on rookie deals, including all 5 from the 1st round of the 2018 Draft (CLE/NYJ/BUF/ARI/BAL), with the possible chance that Arizona may in fact replace last year’s 1st round QB with a new 1st round QB. The other 6 teams? 3 took QBs in the 1st round of 2017 (CHI/KC/HOU) and all are very happy about that: those three teams have a 2-year window with those rookies on cheap deals. The other 3 took QBs in the 2016 Draft: two with the first two picks (LA/PHI), and one (DAL) with a late round pick. The Cowboys are likely to give Dak Prescott a big contract before the start of the ’19 season, as Dallas doesn’t have the fifth year option at its disposal since Prescott wasn’t a first round pick. Prescott’s contract is up after this season (Dallas can of course use the franchise tag on him), while the Eagles and Rams can — if they choose — wait a year on both Jared Goff and Carson Wentz. Of course, as the Bucs and Titans can attest, the fifth-year option is hardly cheap, but based on their productivity, both Goff and Wentz would still be good values at $21M in 2020 (it helps that they’ve been much more effective than the top two picks in the draft the prior year).
That leaves 14 teams with “franchise QBs” at least measured by dollars (whether Derek Carr or Eli Manning still qualify is a different matter), although Jimmy Garoppolo (another player on whom the jury is still out) — by virtue of having an insane $37M cap hit last year — is only counting for $19.35M against the 2019 cap. These are the quarterbacks you would expect, so there’s not much more to say about them. Last year, Washington and Baltimore were on this list, but both have much cheaper quarterbacks in ’19 (again, with the Redskins being a weird case due to Smith’s injury).
So we have 14 teams that paid big dollars to franchise quarterbacks and another 11 that are trying to win with “cheap” rookie deal quarterbacks. The other 7 teams include two incompletes and five teams that basically lost the quarterback carousel and are still looking to find the answer.
Below is a graphical representation of the NFL landscape, in terms of starting quarterbacks: [continue reading…]
Today’s post is the first in a 4-part series that is entirely a re-post from friend of the program Bryan Frye’s site. It is, of course, being republished with his permission and encouragement (as your author takes a small vacation). As regular readers know, Bryan’s fantastic site is always worth a read. You can view all of Bryan’s guest posts here, and follow him on twitter @LaverneusDingle. What follows are the GridFe’s words, with no editing from Chase.
The Hall of Fame in any sport tends to be a source of controversy. The concept of a Hall of Fame means different things to different people, with their own unique biases and values. No set of beliefs is necessarily right or wrong, as they’re just opinions without prescriptive power. I have often lamented that the Pro Football Hall of Fame doesn’t match my personal vision. For most of my life, my grievances were met with puzzled looks from disinterested humanoids. However, thanks to the proliferation of social media, it has become incredibly easy to find other people passionate about the things you love. I joined forces with some of those people to form our own Hall of Fame.
Hall of Fame Basics
The Committee
The GrideFe Hall of Fame Committee comprises analytics maven Ben Baldwin, research guru Topher Doll, standard human Bryan Frye, actual genius Adam Harstad, enigmatic fount of knowledge Raider Joe, and quarterback aficionado Adam Steele.1
Induction
For the inaugural Hall of Fame class, we decided to keep it simple and only induct players and coaches. Also, we determined that it would be best to separate modern and pre-modern players. We consider modern players those who played the majority of their careers after 1950 and modern coaches those who coached for a significant period of time after 1950. We did not discuss pre-modern players for our debut class. Instead, we opted to include them in the Legends Wing, which highlights the players who shined while the game was still in its relative infancy. There will be plenty of time next year to discuss contributors and legends.
In a move that may be obscene to purists, we don’t have a five year waiting period for eligibility. The waiting period for the Pro Football Hall of Fame is to allow voters to have time to step back and reassess a player’s career after some of his hype has died down. We decided that we will allow our voters to use their judgment to put player careers in historical context, and we believe some players are so obviously worthy that a waiting period is unnecessary. For instance, I didn’t vote for some recent or active players because I wanted to take more time to reflect on their careers. But I don’t need to wait five years to put Tom Brady in the Hall of Fame.
Voters can take a holistic view of every candidate’s contribution to the NFL. That means, for example, we can look at John Madden’s career as a coach, his time as an influential broadcaster, and his role in enhancing football’s popularity through his video game franchise. Moreover, it is the voters’ prerogative to consider or ignore off-field issues. That means if I think O.J. Simpson doesn’t deserve to be in the Hall of Fame because of his criminal history, or Terrell Owens shouldn’t be inducted because of his famous locker room distractions, I don’t have to vote for them.2
Voting consists of three rounds. At the end of the final round, all players with at least five votes are officially in the GridFe Hall of Fame. For the Pro Football Hall of Fame, this type of format would be absurd. The Canton institution is a brick and mortar museum that hosts an elaborate ceremony for each of its inductees every year. In our little corner of the internet, we needn’t worry about such logistics. Here, if we think people belong, we enshrine them.
Essentially, our fundamental philosophy is: Thoughtful, trustworthy voters trusted to vote thoughtfully.
Round One of Voting
The first found is what we dubbed the “slam dunks” round. Here, everyone on the committee made their own, separate list of every player and coach they considered absolute-without-a-doubt-no-brainers. Some of the lists were fairly short (Steele’s had just 95 names), while others started to get out of hand (mine contained 192 names). After comparing our ballots, we ended up with 45 unanimous selections and 39 more with five votes, giving us 84 total inductees after one round.
Round Two of Voting
The second round consisted of up/down votes, where we had the opportunity to vote yes or no to the players and coaches on other ballots. Ben and the Adams were generous, up-voting at least 50 names apiece. I was a bit more stubborn, only giving up-votes to four additional players. Once we finished our ups and downs, we had 157 total players and coaches in our Hall of Fame.
Round Three of Voting
The third, and final, round gave us the opportunity to “bang the table” for players who didn’t make the cut after the first two rounds. We’re a full disclosure committee, so it makes sense to tell you how how that went down. There were eight players with four votes, and they automatically went up for argument. Those players were Tony Dorsett, Tim Brown, Bob Brown, Nick Mangold, Jason Taylor, John Randle, and Darrell Green. Additionally, Harstad brought three-vote players Bobby Mitchell, Jim Tyrer, and DeMarcus Ware to the table for debate.3
Joe and I lobbied on behalf of Dorsett, but we did not convince anyone to change his vote. Harstad and I successfully argued for Tim Brown, Mangold, and Green. I managed to turn one voter to get Boomer Brown in. Harstad and Topher convinced me to vote yes to Taylor. Harstad also swayed Ben and Steele to give the thumbs up to Ware. I stated my case against Randle, and either because of that or independently, Harstad changed his vote to no. Harstad did talk me into changing my vote on Mitchell, but my vote wasn’t enough to push him over the threshold. The most thorough discussion concerned Tyrer. Harstad made a thoughtful and compelling case, but we were hesitant to include the controversial figure.
After we all had the chance to consider each other’s arguments and cast our final votes, we ended up with 132 candidates with six votes and 31 more with five votes, giving us 163 members in our inaugural Hall of Fame class.
Hall of Fame Pioneers
While we decided to separate modern players from older players, we felt it was important to pay tribute to three men who were ahead of their time with Pioneer selections to our Hall of Fame proper. Those men are the first superstar quarterback, the original workhorse running back, and the father of the modern wide receiver position. Sammy Baugh, Steve Van Buren, and Don Hutson did not go through the normal voting process but were, instead, unanimously approved as Pioneers. Because they are groundbreakers, it only makes sense to start out with them (I’ll cover the rest of the inductees in subsequent posts).
Sammy Baugh (1937-1952)
Washington
2 MVPs; 7 First Team All Pros; 2 Second Team All Pros; 6 Pro Bowls; 2 Title Wins; 3 Title Losses; 4 GridFe Automatic Awards; 1 GridFe World Award; 2 GridFe Sweetness Awards; 3 GridFe Slinger Awards; 1 GridFe Tunnell Vision Award4
 Entering the league in 1937, Slingin’ Sammy made an immediate impact, earning first team All NFL honors and guiding Washington to an upset victory over the mighty Chicago Bears in the championship game. Accounting for era, he is the most accurate passer of all time. When he completed 70.33% of his passes in 1945, his mark was 24.67 percentage points higher than the rest of the league and stood as a record for 37 years. Baugh’s amazing accuracy enabled him to avoid interceptions far more successfully than his contemporaries. A cursory glance at his stats will show 187 touchdowns to 203 picks, but a cursory glance is seldom sufficient to tell the tale. In the context of his playing environment, Baugh was just as careful with the ball as Tom Brady or Aaron Rodgers. Adjusting for era, he threw about 107 fewer interceptions than expected, and his touchdown-interception differential jumps from -16 to +149.5
It wasn’t just Baugh’s preternatural accuracy that stands out in history. His usage rate as a passer revolutionized the game, changing the expectations we have of those manning the position. Packers legend Arnie Herber retired in 1940 as the NFL’s passing leader with 6749 yards. Baugh broke that record in his sixth season and ultimately pushed it to a then astronomical 21886 yards. He also finished his career with 187 touchdown passes, shattering Herber’s prior record of 66. Baugh held onto those record for 16 and 19 years, respectively.6 In addition to his prodigious passing prowess, Baugh was also a celebrated defensive back and accomplished punter. He held the career interceptions record from 1943-1949, bolstered by a league-high 11 in 1943, and his 51.4 yard punting average in 1940 remains the single season record.7
Steve Van Buren (1944-1951)
Philadelphia Eagles
1 MVP; 6 First Team All Pros; 1 Second Team All Pro; 2 Title Wins; 1 Title Loss; 1 GridFe Automatic Award; 2 GridFe World Awards; 1 GridFe Sweetness Award; 3 GridFe Supersonic Awards; 1 GridFe Gray and White Award8
 Some have expressed distaste for the recent shift from the feature back to the running back by committee approach. However, for a significant portion of NFL history, committee backfields were the norm; the workhorse era didn’t begin until the 1980s. Van Buren entered a league that commonly saw a team’s rushing leader change from year to year, with a different member of the platoon leading the way each time. Supersonic Steve was the first great bellcow running back. Van Buren led the league in attempts, rushing yards, and rushing touchdowns four times apiece. He led in rushing yards per game five times, trailing leader Bill Dudley by 75 yards in 1946, despite playing in two fewer games. Gaining the vast majority of his production on the ground, Van Buren led the NFL in yards from scrimmage and total touchdowns twice apiece. We don’t have reliable yardage numbers prior to 1932, but we do have official records for touchdowns. Ernie Nevers held the rushing touchdowns record until Van Buren usurped him in 1947. He wore the touchdown crown for 15 years, until Jim Brown rewrote the record books.
The Honduran superstar also held the career rushing yards record for nine years before losing the title to Joe Perry. However, it is noteworthy that Van Buren did it playing most of his career in the 10-game era, and his body was broken down by the time the league transitions to 13- and 12-game seasons. Perry, on the other hand, played 12 and 14 game seasons in the AAFC and NFL. Van Buren’s usage and output on a per-game basis were revolutionary.9 The legendary back wasn’t just a masterful rusher; he was also among the game’s finest return men. As a rookie, he led the league in both punt and kick return average. His career kick return average of 26.7 still ranks 13th in history, and his 13.9 yard punt return average would easily rank first if he met the 75 return minimum to qualify for career rankings.
Don Hutson (1935-1945)
Green Bay Packers
2 MVPs; 10 First Team All Pros; 1 Second Team All Pro; 3 Title Wins; 1 Title Loss; 3 GridFe Automatic Awards; 2 GridFe World Awards; 3 GridFe Sweetness Awards; 7 GridFe Bambi Awards; 1 GridFe Toe Award10
 The Alabama Antelope, Don Hutson, brought refined route-running concepts to the NFL and forever changed the way the game was played. Prior to his arrival, passing concepts were unsophisticated and easily defended. Hutson started playing chess while others were playing checker, and, at least for a while, he really was playing a different position from anyone else in the game. Hutson’s career featured enough black ink to pen a novel: he led the NFL in receptions and receiving yards per game eight times, receiving yards and total touchdowns seven times, receiving touchdowns nine times, and scrimmage yards thrice. In the wake of the modern game’s obscene passing inflation, his numbers don’t impress the untrained observer. However, when he retired in 1945, his 488 catches dwarfed second-place Jim Benton‘s 190. His 7991 yards towered over Benton’s 3309. His 99 touchdowns eclipsed runner-up Johnny Blood McNally’s 37. In all three stats, the gap between Hutson and the next guy was enough to itself rank second in history.
Because the NFL didn’t track official stats until 1932, the official yardage record prior to Hutson’s arrival paints an incomplete picture. Chicago Bears legend Luke Johnsos played three seasons prior to the stat era, so he officially retired after setting the receiving yardage record at 985 yards. Hutson surpassed that mark in his third season and didn’t relinquish the record to Billy Howton for 18 years. In his fifth season, Hutson broke McNall’s touchdown record and held onto it for an astonishing 50 seasons, until Steve Largent took the crown with the last scoring catch of his career. Hutson was also a solid defensive back and a capable kicker. He led the NFL in interceptions in 1940 and in interception return yards in 1943, and he even (briefly) held the career record with 14 picks. As a placekicker, he converted 94.0% of his extra points and led the league in made PATs three times. In 1943, Hutson made all of his 36 PAT attempts and led all players in made field goals.
Hall of Fame Quarterbacks
The aim of the GridFe Hall of Fame is to recognize the greatest and most important names in NFL history. When it comes to identifying greatness, some positions stand out more than others. The quarterback is the most important player in football and, arguably, the most important single position in major team sports. The value of the position is such that they are the only ones on the field who are assigned wins for their efforts. It should be no surprise, then, that of the 151 players in the inaugural GridFe Hall of Fame class, twenty are field generals.
There have been many greats to man the position over the years, and omission from the GridFe Hall of Fame is not an indictment of anyone’s ability or legacy. Rather, it just means our voting committee didn’t get five people to agree on his induction. There are champions, MVPs, and beloved icons who didn’t make the final cut. Below are the nineteen who did.11
Otto Graham (1946-1955)
Cleveland Browns
6 MVPs (3 AAFC/3 NFL); 9 First Team All Pros (4 AAFC/5 NFL); 1 Second Team All Pro; 5 Pro Bowls; 7 Title Wins (4 AAFC/3 NFL); 3 Title Losses; 5 GridFe Automatic Awards (3 AAFC/2 NFL); 1 GrideFe World Award (AAFC); 3 GridFe Sweetness Awards; 7 GridFe Slinger Awards (4 AAFC/3 NFL)12
 Automatic Otto played in his league’s championship game in each of his ten seasons, picking up seven victories along the way. Graham was an incredibly accurate passer and efficiently distributed the ball to a bevy of receivers in Paul Brown’s advanced passing offense. He retired with 23584 passing yards, which was the most by any professional quarterback, and 174 touchdowns, which trailed only Sammy Baugh‘s 187. He remains the all-time leader in yards per pass (9.0), and he held the QB rushing touchdowns record until Cam Newton broke it in 2016.
Bobby Layne (1948-1962)
Detroit Lions, Pittsburgh Steelers, New York Bulldogs, Chicago Bears
2 First Team All Pros; 4 Second Team All Pros; 6 Pro Bowls; 3 Title Wins; 1 Title Loss
 Layne retired as the career leader in passing yards, but his passing wasn’t what earned him the adoration of fans and teammates alike. He played recklessly, putting his body on the line in order to win. Layne was the unquestioned leader of his team, and listening to teammates discuss him gives the idea that they would have fallen on a grenade for him. As the father of the two minute drill, he struck fear into the hearts of defenses with his ability to go over the top or pick up first downs with his legs.
Norm Van Brocklin (1949-1960)
Los Angeles Rams, Philadelphia Eagles
2 MVPs; 2 First Team All Pros; 2 Second Team All Pros; 9 Pro Bowls; 2 Title Wins; 2 Titles Losses; 3 GridFe Automatic Awards; 2 GridFe Slinger Awards
 Van Brocklin started his career in a quarterback timeshare that would seem foreign to a modern viewer, but he outplayed his celebrated teammate Bob Waterfield and ultimately became the main man. The Dutchman threw one of the most beautiful deep balls in history, but he also possessed an understanding of defenses that is typically more closely associated with modern quarterbacks. His quick release and quicker mind enabled him to lead his offenses to consistent success, and he is one of just two quarterbacks to lead two different teams to a championship victory.
Johnny Unitas (1956-1973)
Baltimore Colts, San Diego Chargers
5 MVPs; 6 First Team All Pros; 2 Second Team All Pros; 10 Pro Bowls; 3 Title Wins; 1 Title Loss; 3 GridFe Automatic Awards; 4 GridFe Slinger Awards
 The original Johnny Football was a quarterback who played with a linebacker’s mentality. He was tough as nails and relished contact, but there was more to it than that. Unitas had the confidence to make any throw into any coverage, and he also had the deft touch to place the ball exactly where he wanted it. While Layne pioneered the two minute drill, Unitas was the man who perfected it. He retired as the career leader in passing yards and touchdowns, demolishing the previous records. Unitas remains the archetype for the classic, dropback passer.
Bart Starr (1956-1971)
Green Bay Packers
1 MVP; 1 First Team All Pro; 3 Second team All Pros; 4 Pro Bowls; 5 Title Wins; 1 Title Loss
 Starr was the steady hand guiding the Lombardi Packers dynasty. He led with remarkable efficiency, but his volume was relatively low, even for his era. The false impression is one of a system QB, but the film shows a precise passer who helped his teams build early leads and rely on its power running game to maintain them. Rather than being the product of a system, he was a vital component that kept the system working optimally. When it mattered most, Starr was at his best. His 104.8 postseason passer rating is still the top mark in history.
Sonny Jurgensen (1957-1974)
Philadelphia Eagles, Washington
2 MVPs; 1 First Team All Pro; 3 Second Team All Pros; 5 Pro Bowls; 1 GridFe Automatic Award; 3 GridFe Slinger Awards
 Jurgensen was the greatest pure passer of his era and one of the best of all time. His approach was unorthodox, but he was a natural thrower who could hit his mark from a variety of angles. Jurgensen used that beautiful ball of his to lead the NFL in passing five times and set the single season yardage record on two occasions, on two different teams. He rarely had the support afforded to many of the all-time greats, and he lacked team success, but when you watched him play, it was clear he was as good as anyone who’s ever done it.
Fran Tarkenton (1961-1978)
Minnesota Vikings, New York Giants
2 MVPs; 2 First Team All Pros; 1 Second Team All Pro; 9 Pro Bowls; 3 Title Losses; 2 GridFe Automatic Awards; 1 GridFe Slinger Award
 Tarkenton was thought of as a scrambler who was too small to be a great QB. It’s true that he was a scrambler; he retired as career leader in rushing yards by a quarterback. However, he also retired as the leader in passing yards and touchdowns, holding both records for an incredible 19 years. No passer has ever held either record for longer, and Tarkenton set it playing primarily in the dead ball era. He helped turn around the fortunes of both the Vikings and the Giants during his storied career.
Roger Staubach (1969-1979)
Dallas Cowboys
2 MVPs; 1 Second Team All Pro; 6 Pro Bowls; 2 Title Wins; 2 Title Losses; 3 GridFe Automatic Awards; 3 GridFe Slinger Awards
 Captain Comeback was the finest quarterback of his generation. Commitments to the US Navy postponed the start of his career till age 27, robbing him of five seasons in his physical prime (not that you’d ever hear him complain). However, it also meant that he came into the league as the rare rookie who had the immediate respect and adulation of his veteran teammates. The brevity of Staubach’s career means he didn’t post big volume numbers, but he did retire as the career passer rating king. He was a precision passer and superb athlete who commanded respect on and off the field.
Dan Fouts (1973-1987)
San Diego Chargers
2 MVPs; 3 First Team All Pros; 1 Second Team All Pro; 6 Pro Bowls; 1 GridFe Automatic Award; 1 GridFe Sweetness Award; 1 GridFe Slinger Award
 Fouts was the perfect trigger man for Don Coryell’s aerial assault. He was big-armed and confident, with uncanny deep ball accuracy. Fouts also possessed the smarts and soundness of technique to back up the braggadocio. His passes generated yardage in torrents, evidenced by the fact that he set the single season passing yards record three years in a row and was on pace to decimate the mark during the strike-shortened 1982 season.13 Fouts was the unquestioned leader and driving force behind one of the game’s most important and influential offenses.
Joe Montana (1979-1994)
San Francisco 49ers, Kansas City Chiefs
2 MVPs; 3 First Team All Pros; 3 Second Team All Pros; 8 Pro Bowls; 4 Title Wins; 1 GridFe Automatic Award; 1 GridFe Slinger Award
 Joe Cool was lanky and unassuming, often so laid back that he came off as aloof. In fact, one of the reasons he slipped in the draft is that some coaches were concerned that he didn’t even care about football. However, with the game on the line, Montana was an assassin. He was cooly efficient and one of the best regular season QBs the game has ever seen, but the postseason is where he cemented his legacy. Montana’s teams went 4-0 in the Super Bowl, with the legend going 68% with 11 touchdowns and zero interceptions, and two rushing scores for good measure.14
John Elway (1983-1998)
Denver Broncos
1 MVP; 1 First Team All Pro; 2 Second Team All Pros; 9 Pro Bowls; 2 Title Wins; 3 Title Losses; 1 GridFe Automatic Award
 Coming out of college, Elway was among the most highly touted prospects in history. He had legendary arm strength, remarkable athleticism, and natural leadership. A large part of his story is his role as is the posterboy for the importance of coaching in a QB’s development. He started off his career as a one man gang, making lemonade out of a roster full of lemons. He wasn’t refined, and his arm seemed to be stuck with the fastball switch in the on position, but he was the soul of the team. When paired with a creative coach and talented castmates, Elway posted staggering numbers for his age and picked up two championships as he rode into the sunset.
Dan Marino (1983-1999)
Miami Dolphins
1 MVP; 3 First Team All Pros; 5 Second Team All Pros; 9 Pro Bowls; 1 Title Loss; 2 GridFe Automatic Awards; 1 GridFe World Award; 2 GridFe Sweetness Awards; 4 GridFe Slinger Awards
 Perhaps the greatest pure thrower ever to grace the sport, Marino boasted a release reminiscent of a whipcrack and the ability to make any throw a coach could dream up. He didn’t have the arm strength to throw a deep ball from his knees, but he had perhaps the greatest functional throwing power of any man to grace the position. Marino is probably the best in history at avoiding sacks, once going 19 straight games without a sack.15 Poor defensive support has caused hindsight analysts to try to besmirch Marino’s legacy, but this is pure applesauce. One doesn’t hold the yardage and touchdown records for 12 years without possessing immense talent.
Warren Moon (1984-2000)
Houston Oilers, Minnesota Vikings, Seattle Seahawks, Kansas City Chiefs
1 MVP; 1 First Team All Pro; 9 Pro Bowls; 1 GridFe Automatic Award; 1 GridFe Slinger Award
 Moon’s career stands as a triumph in a face of pervasive racism. Kept out of the NFL coming out of college, he dominated the CFL so completely and thoroughly for six seasons that the bigger league could no longer justify preventing him from playing quarterback. In fact, Moon went from not being allowed to play quarterback in the NFL to having his team lean heavily on his arm. He helped turn around a moribund Oilers franchise, and he scoffed at entanglement, posting consecutive 4000 yard seasons with two different teams and making the Pro Bowl with three different teams.
Steve Young (1985-1999)
San Francisco 49ers, Tampa Bay Buccaneers
2 MVPs; 4 First Team All Pros; 2 Second Team All Pros; 7 Pro Bowls; 1 Title Win; 3 GridFe Automatic Awards; 1 GridFe Sweetness Award; 3 GridFe Slinger Awards
 Young was a highly regarded prospect out of college and opted to join the upstart USFL instead of the established NFL. After the lesser league folded, he spent two lackluster years in Tampa Bay before Bill Walsh saw his promise and brought him to the 49ers. Young had to wait a long time to become the starter in San Francisco, but it was worth the wait. Accounting for era, he was the most efficient passer in history, leading the NFL in passer rating six times. He had the best combination of passing and running prowess of anyone the league has ever seen. In addition to earning the completion rate crown five times and the touchdown crown four times, his 51 combined regular and postseason rushing touchdowns rank behind only Cam Newton‘s 56.
Brett Favre (1991-2010)
Green Bay Packers, Minnesota Vikings, New York Jets, Atlanta Falcons
3 MVPs; 3 First Team All Pros; 3 Second Team All Pros; 11 Pro Bowls; 1 Title Win; 1 Title Loss; 3 GridFe Automatic Awards; 3 GridFe Slinger Awards
 When Favre took the field, it was must-see theater. As the cold robe of winter blanketed Green Bay, the gunslinger worked his magic. It wasn’t always pretty, but it was always exciting. Favre retired as the career leader in passing yards and touchdowns, and his 297 consecutive starts are 87 more than the next most at the position. That he also holds the record for career interceptions and fumbles is illustrative of the highs and lows he hit during his two decades under center. Favre was as tough as they come and played the game with irreverence and incandescent joy.
Peyton Manning (1998-2015)
Indianapolis Colts, Denver Broncos
6 MVPs; 7 First Team All Pros; 3 Second Team All Pros; 14 Pro Bowls; 2 Title Wins; 2 Title Losses; 6 GridFe Automatic Awards; 1 GridFe World Award; 2 GridFe Sweetness Awards; 5 GridFe Slinger Awards
 From a purely statistical standpoint, Manning is the most dominant quarterback in history. Many passers excel at picking up yards, avoiding turnovers, staying upright in the pocket, getting the ball in the endzone, or engineering drives. Manning excelled at everything. He won MVP awards and made Super Bowls with two different teams and four different head coaches. Demanding of his teammates, he didn’t just help them produce better numbers – he helped them become better players.16 Beyond that, he changed the position with his pre-snap diagnoses and gesticulations, bringing an increased cerebral element to the game’s most important position.
Tom Brady (2000-present)
New England Patriots
4 MVPs; 5 First Team All Pros; 2 Second Team All Pros; 13 Pro Bowls; 5 Title Wins; 3 Title Losses; 2 GridFe Automatic Awards; 1 GridFe World Award; 1 GridFe Sweetness Award; 3 GridFe Slinger Awards
 It has become popular to call Brady a system quarterback as a pejorative. In fact, it is high praise to bestow upon him that honor. Brady has played for one coach, but he has been through several schematic shifts to fit leaguewide trends and team personnel. He has proven to be a chameleon, fitting into every new design with aplomb and defying age along the way. Brady has led the league in passing yards thrice and touchdowns four times, while maintaining one of the lowest interception rates ever. Few have ever had as much success with the quarterback sneak, and none has matched his subtle artistry within the pocket. There’s also the matter of the rings, but it’s, frankly, reductive to define Brady by his jewelry.
Drew Brees (2001-present)
New Orleans Saints, San Diego Chargers
1 MVP; 3 First Team All Pros; 1 Second Team All Pro; 11 Pro Bowls; 1 Title Win; 1 GridFe Automatic Award; 2 GridFe Sweetness Awards; 1 GridFe Slinger Award
 Brees may be the greatest player in football history who was never widely considered the best at his own position when he played. After suffering a career-threatening injury, he got a fresh start in a city starved for a hero. He delivered in a big way, boasting some of the most impressive passing displays of recent vintage. There have been nine 5000 yard passing seasons in history. Brees owns five of them. There have also been nine 70% seasons in history. Brees authored four of them. Few passers in history have ever been asked to shoulder such a prolific load. The undersized QB has carried the team on his back while posting outlandish volume numbers and the highest completion rate of all time.
Aaron Rodgers (2005-present)
Green Bay Packers
2 MVPs; 2 First Team All Pros; 2 Second Team All Pros; 6 Pro Bowls; 1 Title Win; 3 GridFe Automatic Awards; 1 GridFe World Award; 2 GridFe Slinger Awards
 Filling in for a beloved franchise legend isn’t easy, but Rodgers proved up to the challenge. He may be the most fundamentally gifted player ever to hold the position. His ability to process defenses quickly and can throw with uncanny accuracy to all levels of the field, from any angle you could ever want, is unparalleled. He excels when plays break down and he has to escape the pocket, as he may be the best in history when it comes to throwing with precision while on the run. His play is at once beautiful and intricate, like watching Mozart amongst a crowd of Salieris.
Adam Steele is back with some Wisdom of Crowds work. As always, we thank him for that.
Best Quarterback of All Time: Wisdom of the Crowds 2019
First in 2015 and again in 2017, I solicited the opinions of Football Perspective readers to rank the greatest quarterbacks in NFL history. I had a lot of fun with these exercises and thoroughly enjoyed the debates that accompanied them. Well here we are in an odd numbered year and it’s time to do it again…with a twist. At this point the GOAT debate is over among the vast majority of football fans, so if I left the ranking criteria open again the results would be predictable. Instead, I’m asking you to participate in the following thought experiment:
You’re the GM of an expansion team, and you have the privilege of choosing any QB throughout NFL history to be the face of your franchise. But there’s a catch – you have no idea which era your team will be competing in. It could be the pass happy NFL of today, the dead ball 1970’s, the war torn 1940’s, or any time in between. You won’t know until after you select your quarterback. Now if we’re going to engage in fantasy hypotheticals, we have to make some assumptions: [continue reading…]
The 2018 season is the greatest season in passing history. In week 10, prior to Monday Night Football, NFL passers have thrown 855 passes and completed 584 of them for 6,706 yards with 46 TDs and 16 INTs. That translates to an average passer rating of 101.8, which would make this in the running for the greatest single week for passing in history. A whopping 18 of the 26 starting quarterbacks this week had a passer rating of over 100!
But it’s not just the name brand quarterbacks that are doing well. Let’s exclude Carson Wentz and Jameis Winston, who began the season as backups in name only (Wentz was injured; Winston was suspended). And let’s not include Ryan Fitzpatrick, who is obviously having a very strong season for a “backup” quarterback.
And let’s ignore the first round rookie quarterbacks, who aren’t true backups in the way we think of the term. That leaves seven quarterbacks who by any definition qualify as backup quarterbacks: Brock Osweiler, C.J. Beathard, Derek Anderson, Blaine Gabbert, Josh McCown, Matt Barkley, and Nick Mullens. And so far this season, they have thrown more TDs than INTs and have completed over 60% of their passes:

In fact, backup quarterbacks now have a stat line that is roughly equal to league average from the early ’00s: a passer rating of 80.6 and an ANY/A average of 5.20. Four of these quarterbacks — in particular Barkley (on a salary of $790K for 2018), Mullens ($1.05M), Osweiler ($880K), Anderson ($1.1M) — are arguably replacement level (shockingly, the Jets are paying McCown $10M this season). And those four quarterbacks have an ANY/A average of 6.00 and a passer rating of 86.9!
2018 is truly a case of a rising tide lifting all ships.
A couple of weeks ago, I wrote that over his 4-year career, Jameis Winston had been great at picking up first downs and also at throwing interceptions. Well, now that Ryan Fitzpatrick’s interception rate has ticked back up, the same is true for the 2018 Bucs as a whole.
Jameis Winston leads all players with a 6.8% interception rate through 9 weeks. But Fitzpatrick’s 3.8% interception rate puts him as the 5th most INT-prone passer of the first half of the ’18 season. On the other hand, there are just five players this season who have picked up first downs on 40% of their dropbacks so far: Jared Goff (43.2%), Patrick Mahomes (41.0%), and Philip Rivers (40.9%) — three of the top MVP candidates — and then Fitzpatrick (42.6%) and yes, Winston (40.4%).
On the team level, the Buccaneers have picked up a first down on 41.5% of dropbacks (calculated based on a league-high 148 passing first downs, divided by the team’s 333 pass attempts and 24 sacks). The Rams lead the league in this metric at 43.3%, followed by Tampa Bay, Kansas City, the Chargers, and the Saints. The worst five teams are the Bills (22.2%), the Cardinals, the Browns, the Jets, and the Cowboys.
When it comes to interception rate, the Bills have the worst performance in that category, too, at 5.5%. But here, Tampa Bay ranks 2nd in the NFL at 5.1%. Usually, there’s a pretty strong relationship between these two categories: teams with good interception rates have good first down rates, and teams with bad interception rates have bad first down rates. Tampa Bay is a very… very large outlier. No other team ranks in the top 9 in first down rate and bottom 9 in interception rate, while Tampa Bay ranks 2nd and 2nd-from the bottom. The Bengals (11th-best 1st down rate, 10th-worst INT rate) are the only other team in the top/bottom 12 of both metrics, and the 49ers, Texans, and Lions are the only other teams in the top/bottom 15.
On the flip side, Baltimore and Washington are the anti-Bucs. The Ravens rank 25th in first down rate, but 9th (aka 24th-from-the-bottom) in interception rate, while the Redskins are 22nd in first down rate and 5th (aka 28th from the bottom) in interception rate. Yes, Alex Smith is still your anti-gunslinger.
On the graph below, I have plotted where each team fares in first down rate (X-Axis) and interception rate (Y-Axis). Interception rate is plotted in reverse order, so a low (good) INT rate is high in the graph; therefore, you want to be in the upper right corner of the graph. The worst passing teams — the Bills, Cardinals, and Jets — are in the lower left corner of the graph. And all alone in the bottom right? That’s where you’ll find Tampa Bay, the biggest passing outlier this season. [continue reading…]
Against the Jets in week 5, trailing 34-16 with 11 seconds left, Case Keenum threw an interception on the game’s final play.
Against the Broncos in week 1, the Seahawks had the ball with 2 seconds left at their own 11-yard line, down by 3. Russell Wilson threw an interception on the game’s final play.
Against the Panthers in week 3, the Bengals were down 31-21 with 3 seconds left when Andy Dalton threw an interception on the game’s final play.
Trailing 30-14 against the Chiefs, with 9 seconds left, Blake Bortles threw an interception on the game’s second-to-last play.
All of these are examples of meaningless interceptions, at least from a win probability perspective. These teams all had a less than one percent chance of winning the game, and the interception therefore was not meaningful. Tom Brady had one of these, too: the Patriots had a win probability of over 99% when, up 38-0 in the 4th quarter, he threw an interception. That pick was meaningless.
We should not treat all interceptions equally, and with win probability data becoming more mainstream, we are no longer restricted by a game’s box score. A special thanks to Ron Yurko (@Stat_Ron) for providing the raw data. [continue reading…]
Today’s guest post/contest comes from Thomas McDermott, a frequent guest contributor. As always, we thank him for his hard work.
Author’s note regarding the numbers: The Win Probability (WP) numbers shown below were, for the most part, generated using a formula presented by Wayne Winston in his book Matheletics, and subsequently improved upon by Pro Football Reference for their WP model. [1]While in the process of messing around with PFR’s WP Calculator, I have noticed differences between the results from the Calculator and the results from using the formula as shown on their web … Continue reading
The heart of the formula is the Excel NORMDIST function, which returns the normal distribution (the probability) for a given mean and standard deviation. I have made some minor adjustments to this formula, but it is basically the same. The formula requires the use of Expected Points data; the EP dataset I use comes from Brian Burke’s Advanced Football Analytics site (when it was active), and I have adjusted those numbers for era. Since the formula falls apart in certain areas – most importantly, the 4th quarter when the game is close – I abandon it and use other data to generate a WP number. Field goal success rates, 4th down success rates, drive results, PFR’s Play Index and the recently provided play-by-play data from Ron Yurko on GitHub, are some of my alternate sources. I realize there’s a “black box” aspect to Win Probability analysis (if you can find two models that completely agree, let me know), since it’s not something that can be easily checked, and perhaps especially suspect when the author openly states that he adjusts the numbers “manually”. To that I can only say that my intent is to provide as accurate a picture as possible of the games that I analyze, and I’m open to any suggestions, comments or questions. Thanks. [continue reading…]
References
| ↑1 | While in the process of messing around with PFR’s WP Calculator, I have noticed differences between the results from the Calculator and the results from using the formula as shown on their web page. I have a hunch that PFR has probably moved on from the formula and is using a more sophisticated model (which perhaps incorporates the formula?), but I’m not sure. |
|---|
Adam Steele is back for another guest post, with today’s work being initially published at The GridFe. You can view all of Adam’s posts here. As always, we thank him for contributing.
Yesterday, I outlined my methodology for measuring QB defensive support, and looked at the best and worst seasons using that metric. Today’s post will explore the career numbers for the 107 quarterbacks in my study.
I originally planned to simply tally the seasonal numbers without adjustment, but that presented a problem: The top of the support leaderboard was disproportionately filled with QB’s who were exceptional at avoiding interceptions. This makes sense because throwing picks generally makes it harder to prevent the opponent from scoring, although I expected the effect to be minimal enough that it wouldn’t really make a difference. Well, it does make a difference.
To counter the interception issue, I added three point of defensive support for every marginal INT thrown in the regular season. Marginal INT’s are calculated by taking the difference between a given QB’s INT% and the league average rate [1]Technically a rolling three year average calculated by Bryan Frye, then multiplying that difference by the number of pass attempts. I know from expected points models that the typical INT is worth roughly -3 EPA, so each marginal INT makes the defense look three points worse than it actually is. As an example, Len Dawson threw -31 marginal INT’s during his career, which “saved” 93 points for his defense. Dawson’s career support is then adjusted by -93 points.
A more rigorous study would also adjust for playoff interceptions and lost fumbles, but I don’t currently have the means for easily compiling the marginal version of those statistics. Again you’ll just have to use common sense and make mental adjustments when necessary. [continue reading…]
References
| ↑1 | Technically a rolling three year average calculated by Bryan Frye |
|---|
Adam Steele is back for another guest post, with today’s work being initially published at The GridFe. You can view all of Adam’s posts here. As always, we thank him for contributing.
I’ll start by stating the obvious: QB wins is a terrible metric for evaluating the performance of quarterbacks. But since this criteria remains at the forefront of the public discourse about NFL signal callers, I figured it would be worthwhile to provide some important context.
The game of football is won and lost in three phases, two of which have very little to do with the QB. In this post I’m going to present a cursory analysis of which quarterbacks benefited the most and least from the play of their teams’ defenses and special teams.
When I reference defensive support, I’m actually referring to the points allowed by a given quarterback’s team compared to the average team during that season. This is not an exhaustive study; my numbers do not adjust for field position, number of drives, turnovers, weather, or any other hidden variable that affects points allowed. But including all the noise also includes all the signal.
From the quarterback’s perspective, it doesn’t matter why his team gave up x number of points – his chances of winning the game are the same (or nearly the same) regardless. If his team allows 35 points, it doesn’t matter to the QB whether his own defense was bad or the opposing offense happened to be a juggernaut. If his team allows only 10 points, it doesn’t matter to the QB whether his defense was stout or the opposing kicker missed three field goals. This is why I’m content to use straight points allowed and ask the reader to make common sense adjustments for QB’s in extreme circumstances.
I collected data from the top 100 quarterbacks in career pass attempts (modern era) plus Hall of Famers and Super Bowl winners outside of the top 100. I only wanted to count games in which the QB played a significant amount, so I set a threshold of 14 pass attempts for a game to count (14 attempts per game is the NFL’s official minimum for rate stat leaderboards). It doesn’t matter whether the QB started the game or not, as such data gets murky the further in time we look back (for another look, here is an old Chase article on points allowed per game in games started by each quarterback). Playoff games are included in the points allowed totals as well as league baselines; said baselines are calculated by removing the points allowed in qualifying games of the QB is question, then finding the league average points per game in all other games during a given season.
In the two tables below, Win % is from qualifying games only, O/U is the number of games over or under .500 in qualifying games, and Playoffs indicates which round of the postseason was reached the by the QB’s team (even if he didn’t play in the postseason).
Here are the top 100 seasons of defensive support among the quarterbacks in my study: [continue reading…]
On Tuesday, I looked at the best passing seasons in NFL history. What about the reverse? Blake Bortles had one of the worst seasons in 2014 in NFL history, in terms of quality combined with quantity. There are a lot of bad seasons, but what makes that Bortles year stand out was that he played nearly the full season. This was his rookie year, and Bortles started 13 games; he averaged 3.81 ANY/A when the league average was 6.14 ANY/A. Bortles therefore produced -1,234 Adjusted Net Yards of Value above average, since he had 530 dropbacks. That’s actually the worst in NFL history, which isn’t too surprising; most of the bad years with a large number of dropbacks came in recent history.
The table below shows the 500 “worst” seasons in passing history in terms of Adjusted Net Yards of Value below average. Note that the 500th-worst passing season (pro-rated, as on Tuesday) is -365. This means that a season that is 0.70 ANY/A below average on 550 attempts will make this list. That’s not a really bad season, of course. So just a reminder when you view these lists that quantity is a key component here: [continue reading…]
This is the final article in a seven-part series. Below is an update to my 2015 ranking of the greatest quarterbacks of all time. I won’t be offering detailed player stories or explanations of the rankings, because [1] not much has changed in the last three years, and [2] I’ve spent the last month and a half writing about the top 100 QBs of the Modern Era, as ranked by by QB-TSP. If you haven’t read that series already, I’d really encourage you to do so before continuing here. At least read the posts on the quarterbacks ranked 1-40.
Best Statistical QBs: 81-100
Best Statistical QBs: 41-60
Best Statistical QBs: 21-40
Best Statistical QBs: 1-20
Best Statistical QBs: HOF Data [continue reading…]
In 1984, Dan Marino averaged 8.94 Adjusted Net Yards per Attempt (ANY/A, defined as passing yards + 20*Pass TDs – 45*INTs – sack yards, all divided by pass attempts plus sacks) while the league average was 5.00 ANY/A. Marino had 577 dropbacks (pass attempts plus sacks), so he had 3.94 ANY/A over average over 577 dropbacks; that means he provided 2,271 Adjusted Net Yards of Value over average.
In 2004, Peyton Manning averaged 9.78 ANY/A while the league average was 5.63 ANY/A. Manning had 510 dropbacks, so he is credited with 2,113 yards of Value that season. This was Manning’s best year: even better than what he did in 2013, when averaged 8.87 ANY/A, the league average was 5.87, and Manning had a whopping 677 dropbacks. So he had 2,031 yards of Value that season.
The table below shows the top 500 passing seasons by this metric. For non-16 game seasons, the final column (ProRt value) prorates the value as if it was a 16-game season.For AFL seasons 1960 to 1964, in the pro-rated column, I assigned only 50% credit in 1960, 60% in ’61, 70% in ’62, 80% in ’63, 90% in ’64, and then full credit in the remaining seasons. I also assigned full credit for all AAFC seasons. [continue reading…]
Yesterday’s post about ANY/A and the HOF Gray Ink Test turned out to be very popular, with over 65 comments in 24 hours. So to facilitate further debate and discussion, I’m going to post the year-by-year ranks for each passer in the table below.
The table is fully sortable and searchable, but here is how to read it, using Manning’s line. He had a Pro-rated score of 110.8, the column the table is sorted by. The next 10 columns show his top 10 seasons. He had four seasons where he finished 1st in ANY/A — 2005, 2004, 2012, and 2006. In the parentheses in each cell I have included the number of pro-rated points. The only reason ’05 was Manning’s best year was because there were more qualified passers that year.
If you type ‘Aikman’ into the search box, you’ll see that his best season was a 2nd-place rank where he received 8.7 points; this was in 1995. His next best year was another 2nd-place finished where he received 8.6 points in 1993. He ranked 3rd in 1992 (7.1 points), 4th in 1994 (6.7 points), 6th in 1998 (4.8 points), and 10th in 1999 (1.0 point). If you type in Manning, you’ll see that both Archie and Eli topped out with a 5th-place ranking, although Eli’s was worth slightly more points because there were more qualifying passers that season. Archie had a 7th and 9th place finish, while Eli only has three other 10th-place finishes. [continue reading…]