
Adam Steele is back for another guest post, with today’s work being initially published at The GridFe. You can view all of Adam’s posts here. As always, we thank him for contributing.
I’ll start by stating the obvious: QB wins is a terrible metric for evaluating the performance of quarterbacks. But since this criteria remains at the forefront of the public discourse about NFL signal callers, I figured it would be worthwhile to provide some important context.
The game of football is won and lost in three phases, two of which have very little to do with the QB. In this post I’m going to present a cursory analysis of which quarterbacks benefited the most and least from the play of their teams’ defenses and special teams.
When I reference defensive support, I’m actually referring to the points allowed by a given quarterback’s team compared to the average team during that season. This is not an exhaustive study; my numbers do not adjust for field position, number of drives, turnovers, weather, or any other hidden variable that affects points allowed. But including all the noise also includes all the signal.
From the quarterback’s perspective, it doesn’t matter why his team gave up x number of points – his chances of winning the game are the same (or nearly the same) regardless. If his team allows 35 points, it doesn’t matter to the QB whether his own defense was bad or the opposing offense happened to be a juggernaut. If his team allows only 10 points, it doesn’t matter to the QB whether his defense was stout or the opposing kicker missed three field goals. This is why I’m content to use straight points allowed and ask the reader to make common sense adjustments for QB’s in extreme circumstances.
I collected data from the top 100 quarterbacks in career pass attempts (modern era) plus Hall of Famers and Super Bowl winners outside of the top 100. I only wanted to count games in which the QB played a significant amount, so I set a threshold of 14 pass attempts for a game to count (14 attempts per game is the NFL’s official minimum for rate stat leaderboards). It doesn’t matter whether the QB started the game or not, as such data gets murky the further in time we look back (for another look, here is an old Chase article on points allowed per game in games started by each quarterback). Playoff games are included in the points allowed totals as well as league baselines; said baselines are calculated by removing the points allowed in qualifying games of the QB is question, then finding the league average points per game in all other games during a given season.
In the two tables below, Win % is from qualifying games only, O/U is the number of games over or under .500 in qualifying games, and Playoffs indicates which round of the postseason was reached the by the QB’s team (even if he didn’t play in the postseason).
Here are the top 100 seasons of defensive support among the quarterbacks in my study:
| Quarterback | Year | Team | QGm | PA | PA/G | LgAvg | Support | Sup/G | Win % | O/U | Playoffs |
|---|---|---|---|---|---|---|---|---|---|---|---|
| Russell Wilson | 2013 | SEA | 19 | 271 | 14.3 | 23.8 | 181 | 9.5 | 0.842 | 13 | Won SB |
| Otto Graham | 1948 | CLE | 15 | 197 | 13.1 | 24.3 | 168 | 11.2 | 1 | 15 | Won LC |
| Jim McMahon | 1985 | CHI | 15 | 167 | 11.1 | 21.7 | 159 | 10.6 | 1 | 15 | Won SB |
| Jack Kemp | 1961 | BUF | 15 | 229 | 15.3 | 25.5 | 153 | 10.2 | 0.8 | 9 | Lost LCG |
| Trent Dilfer | 2000 | BAL | 12 | 99 | 8.3 | 20.8 | 151 | 12.6 | 0.917 | 10 | Won SB |
| Brad Johnson | 2002 | TAM | 16 | 207 | 12.9 | 22.1 | 147 | 9.2 | 0.813 | 10 | Won SB |
| Bart Starr | 1962 | GNB | 12 | 129 | 10.8 | 22.9 | 146 | 12.2 | 0.917 | 10 | Won LC |
| Otto Graham | 1947 | CLE | 15 | 188 | 12.5 | 22.3 | 146 | 9.7 | 0.9 | 12 | Won LC |
| Joe Montana | 1984 | SFO | 18 | 244 | 13.6 | 21.5 | 142 | 7.9 | 0.944 | 16 | Won SB |
| Steve McNair | 2006 | BAL | 15 | 176 | 11.7 | 21 | 139 | 9.3 | 0.8 | 9 | Lost Div |
| Ben Roethlisberger | 2008 | PIT | 19 | 284 | 14.9 | 22.3 | 139 | 7.3 | 0.789 | 11 | Won SB |
| Cam Newton | 2013 | CAR | 17 | 264 | 15.5 | 23.7 | 139 | 8.2 | 0.706 | 7 | Lost Div |
| Steve McNair | 2000 | TEN | 16 | 195 | 12.2 | 20.8 | 138 | 8.6 | 0.75 | 8 | Lost Div |
| George Blanda | 1961 | HOU | 13 | 192 | 14.8 | 25.3 | 138 | 10.6 | 0.846 | 9 | Won LC |
| Joe Flacco | 2008 | BAL | 19 | 286 | 15.1 | 22.3 | 137 | 7.2 | 0.684 | 7 | Lost CCG |
| Brett Favre | 1996 | GNB | 19 | 258 | 13.6 | 20.8 | 137 | 7.2 | 0.842 | 13 | Won SB |
| Phil Simms | 1986 | NYG | 19 | 259 | 13.6 | 20.8 | 136 | 7.2 | 0.895 | 15 | Won SB |
| Terry Bradshaw | 1975 | PIT | 13 | 143 | 11 | 20.9 | 129 | 9.9 | 1 | 13 | Won SB |
| Aaron Rodgers | 2010 | GNB | 18 | 278 | 15.4 | 22.4 | 125 | 6.9 | 0.778 | 10 | Won SB |
| Ron Jaworski | 1980 | PHI | 19 | 272 | 14.3 | 20.8 | 122 | 6.4 | 0.737 | 9 | Lost SB |
| Donovan McNabb | 2004 | PHI | 17 | 250 | 14.7 | 21.8 | 121 | 7.1 | 0.882 | 13 | Lost SB |
| Otto Graham | 1951 | CLE | 13 | 176 | 13.5 | 22.7 | 120 | 9.2 | 0.846 | 9 | Lost LCG |
| Kerry Collins | 2008 | TEN | 15 | 214 | 14.3 | 22.2 | 120 | 8 | 0.8 | 9 | Lost Div |
| Terry Bradshaw | 1978 | PIT | 18 | 217 | 12.1 | 18.7 | 119 | 6.6 | 0.889 | 14 | Won SB |
| Donovan McNabb | 2001 | PHI | 18 | 252 | 14 | 20.5 | 117 | 6.5 | 0.667 | 6 | Lost CCG |
| Fran Tarkenton | 1975 | MIN | 15 | 197 | 13.1 | 20.9 | 117 | 7.8 | 0.8 | 9 | Lost Div |
| Johnny Unitas | 1967 | BAL | 14 | 198 | 14.1 | 22.3 | 115 | 8.2 | 0.857 | 10 | - |
| Mark Brunell | 1999 | JAX | 15 | 202 | 13.5 | 21.1 | 114 | 7.6 | 0.867 | 11 | Lost CCG |
| Otto Graham | 1949 | CLE | 14 | 199 | 14.2 | 22.3 | 113 | 8.1 | 0.857 | 10 | Won LC |
| Alex Smith | 2011 | SFO | 18 | 291 | 16.2 | 22.5 | 113 | 6.3 | 0.778 | 10 | Lost CCG |
| Len Dawson | 1969 | KAN | 9 | 82 | 9.1 | 21.7 | 113 | 12.6 | 0.889 | 7 | Won SB |
| Russell Wilson | 2014 | SEA | 19 | 321 | 16.9 | 22.8 | 113 | 6 | 0.737 | 9 | Lost SB |
| Ron Jaworski | 1981 | PHI | 17 | 248 | 14.6 | 21.1 | 111 | 6.5 | 0.588 | 3 | Lost WC |
| Bart Starr | 1961 | GNB | 15 | 223 | 14.9 | 22 | 107 | 7.1 | 0.8 | 9 | Won LC |
| Otto Graham | 1946 | CLE | 12 | 140 | 11.7 | 20.5 | 106 | 8.9 | 0.833 | 8 | Won LC |
| Bart Starr | 1966 | GNB | 12 | 161 | 13.4 | 22.2 | 106 | 8.8 | 0.833 | 8 | Won SB |
| Tom Brady | 2003 | NWE | 19 | 295 | 15.5 | 21.1 | 106 | 5.6 | 0.895 | 15 | Won SB |
| Donovan McNabb | 2000 | PHI | 18 | 268 | 14.9 | 20.8 | 106 | 5.9 | 0.667 | 6 | Lost Div |
| Roger Staubach | 1971 | DAL | 12 | 129 | 10.8 | 19.5 | 105 | 8.7 | 1 | 12 | Won SB |
| Bob Griese | 1971 | MIA | 15 | 188 | 12.5 | 19.5 | 104 | 7 | 0.767 | 8 | Lost SB |
| Kerry Collins | 2000 | NYG | 19 | 290 | 15.3 | 20.7 | 104 | 5.5 | 0.737 | 9 | Lost SB |
| Russell Wilson | 2012 | SEA | 17 | 289 | 17 | 23.1 | 103 | 6.1 | 0.647 | 5 | Lost Div |
| Ben Roethlisberger | 2011 | PIT | 16 | 256 | 16 | 22.4 | 103 | 6.4 | 0.688 | 6 | Lost WC |
| Tom Brady | 2004 | NWE | 19 | 311 | 16.4 | 21.8 | 103 | 5.4 | 0.895 | 15 | Won SB |
| Jack Kemp | 1965 | BUF | 14 | 208 | 14.9 | 22.2 | 103 | 7.3 | 0.75 | 7 | Won LC |
| Neil O'Donnell | 1994 | PIT | 15 | 207 | 13.8 | 20.6 | 102 | 6.8 | 0.733 | 7 | Lost CCG |
| Mark Rypien | 1991 | WAS | 19 | 265 | 13.9 | 19.3 | 102 | 5.4 | 0.895 | 15 | Won SB |
| Joe Flacco | 2011 | BAL | 18 | 302 | 16.8 | 22.4 | 102 | 5.7 | 0.722 | 8 | Lost CCG |
| Fran Tarkenton | 1973 | MIN | 16 | 215 | 13.4 | 19.8 | 101 | 6.3 | 0.813 | 10 | Lost SB |
| Jay Cutler | 2012 | CHI | 15 | 245 | 16.3 | 23.1 | 101 | 6.7 | 0.667 | 5 | - |
| Phil Simms | 1990 | NYG | 12 | 144 | 12 | 20.3 | 100 | 8.3 | 0.833 | 8 | Won SB |
| Roman Gabriel | 1966 | LAR | 14 | 212 | 15.1 | 22.2 | 99 | 7.1 | 0.571 | 2 | - |
| Jim Kelly | 1988 | BUF | 18 | 268 | 14.9 | 20.4 | 99 | 5.5 | 0.722 | 8 | Lost CCG |
| Otto Graham | 1954 | CLE | 11 | 151 | 13.7 | 22.7 | 99 | 9 | 0.818 | 7 | Won LC |
| Len Dawson | 1962 | DTX | 13 | 212 | 16.3 | 23.9 | 99 | 7.6 | 0.769 | 7 | Won LC |
| Kurt Warner | 1999 | STL | 19 | 301 | 15.8 | 21 | 99 | 5.2 | 0.842 | 13 | Won SB |
| Alex Smith | 2015 | KAN | 18 | 314 | 17.4 | 22.9 | 99 | 5.5 | 0.667 | 6 | Lost Div |
| Troy Aikman | 1996 | DAL | 17 | 254 | 14.9 | 20.7 | 98 | 5.8 | 0.647 | 5 | Lost Div |
| John Elway | 1984 | DEN | 14 | 202 | 14.4 | 21.4 | 97 | 6.9 | 0.786 | 8 | Lost Div |
| Vinny Testaverde | 1994 | CLE | 15 | 213 | 14.2 | 20.6 | 96 | 6.4 | 0.667 | 5 | Lost Div |
| Tom Brady | 2016 | NWE | 15 | 250 | 16.7 | 23 | 96 | 6.4 | 0.933 | 13 | Won SB |
| Russell Wilson | 2015 | SEA | 18 | 317 | 17.6 | 22.9 | 95 | 5.3 | 0.611 | 4 | Lost Div |
| Roman Gabriel | 1967 | LAR | 14 | 217 | 15.5 | 22.3 | 95 | 6.8 | 0.786 | 8 | Lost Div |
| Joe Montana | 1990 | SFO | 17 | 251 | 14.8 | 20.3 | 94 | 5.5 | 0.882 | 13 | Lost CCG |
| Joe Flacco | 2010 | BAL | 18 | 308 | 17.1 | 22.3 | 94 | 5.2 | 0.722 | 8 | Lost Div |
| Tony Romo | 2009 | DAL | 18 | 298 | 16.6 | 21.8 | 94 | 5.2 | 0.667 | 6 | Lost Div |
| Joe Theismann | 1982 | WAS | 13 | 176 | 13.5 | 20.7 | 93 | 7.2 | 0.923 | 11 | Won SB |
| Tom Brady | 2007 | NWE | 19 | 323 | 17 | 21.9 | 92 | 4.9 | 0.947 | 17 | Lost SB |
| Roman Gabriel | 1968 | LAR | 14 | 200 | 14.3 | 20.8 | 92 | 6.5 | 0.75 | 7 | - |
| Vinny Testaverde | 1998 | NYJ | 16 | 253 | 15.8 | 21.5 | 91 | 5.7 | 0.813 | 10 | Lost CCG |
| Troy Aikman | 1995 | DAL | 17 | 281 | 16.5 | 21.9 | 91 | 5.3 | 0.882 | 13 | Won SB |
| Otto Graham | 1950 | CLE | 10 | 144 | 14.4 | 23.3 | 89 | 8.9 | 0.8 | 6 | Won LC |
| Joe Flacco | 2009 | BAL | 17 | 281 | 16.5 | 21.7 | 89 | 5.2 | 0.529 | 1 | Lost Div |
| Terry Bradshaw | 1972 | PIT | 13 | 176 | 13.5 | 20.3 | 88 | 6.8 | 0.769 | 7 | Lost CCG |
| Bobby Hebert | 1992 | NOR | 17 | 238 | 14 | 19 | 86 | 5 | 0.706 | 7 | Lost WC |
| Phil Simms | 1993 | NYG | 18 | 259 | 14.4 | 19.1 | 85 | 4.7 | 0.667 | 6 | Lost Div |
| Tom Brady | 2006 | NWE | 19 | 312 | 16.4 | 20.9 | 85 | 4.5 | 0.737 | 9 | Lost CCG |
| Jeff Garcia | 2007 | TAM | 13 | 199 | 15.3 | 21.9 | 85 | 6.5 | 0.538 | 1 | Lost WC |
| Johnny Unitas | 1966 | BAL | 13 | 203 | 15.6 | 22.2 | 85 | 6.5 | 0.692 | 5 | - |
| Ken Stabler | 1973 | OAK | 12 | 152 | 12.7 | 19.7 | 85 | 7.1 | 0.792 | 7 | Lost CCG |
| John Hadl | 1973 | LAR | 13 | 172 | 13.2 | 19.7 | 84 | 6.5 | 0.769 | 7 | Lost Div |
| Bart Starr | 1963 | GNB | 10 | 139 | 13.9 | 22.3 | 84 | 8.4 | 0.85 | 7 | - |
| Peyton Manning | 2005 | IND | 15 | 227 | 15.1 | 20.7 | 84 | 5.6 | 0.867 | 11 | Lost Div |
| Roger Staubach | 1976 | DAL | 15 | 208 | 13.9 | 19.4 | 83 | 5.6 | 0.733 | 7 | Lost Div |
| Matthew Stafford | 2014 | DET | 17 | 306 | 18 | 22.8 | 81 | 4.8 | 0.647 | 5 | Lost WC |
| Peyton Manning | 2007 | IND | 17 | 290 | 17.1 | 21.8 | 81 | 4.8 | 0.765 | 9 | Lost Div |
| Alex Smith | 2012 | SFO | 8 | 103 | 12.9 | 23 | 81 | 10.2 | 0.75 | 4 | Lost SB |
| Phil Simms | 1985 | NYG | 18 | 307 | 17.1 | 21.6 | 81 | 4.5 | 0.611 | 4 | Lost Div |
| John Hadl | 1974 | 2TM | 12 | 140 | 11.7 | 18.4 | 81 | 6.7 | 0.5 | 0 | - |
| Trent Dilfer | 1997 | TAM | 18 | 294 | 16.3 | 20.8 | 81 | 4.5 | 0.611 | 4 | Lost Div |
| Russell Wilson | 2016 | SEA | 18 | 334 | 18.6 | 23 | 80 | 4.5 | 0.639 | 5 | Lost Div |
| Len Dawson | 1968 | KAN | 11 | 169 | 15.4 | 22.7 | 80 | 7.3 | 0.727 | 5 | Lost Div |
| John Hadl | 1965 | SDG | 15 | 250 | 16.7 | 22 | 80 | 5.3 | 0.7 | 6 | Lost LCG |
| Philip Rivers | 2017 | LAC | 16 | 272 | 17 | 22 | 79 | 5 | 0.563 | 2 | - |
| Ben Roethlisberger | 2010 | PIT | 15 | 256 | 17.1 | 22.3 | 79 | 5.2 | 0.733 | 7 | Lost SB |
| Andy Dalton | 2015 | CIN | 12 | 196 | 16.3 | 22.9 | 79 | 6.5 | 0.833 | 8 | Lost WC |
| Joe Montana | 1989 | SFO | 15 | 235 | 15.7 | 20.9 | 79 | 5.2 | 0.867 | 11 | Won SB |
| Dan Fouts | 1979 | SDG | 16 | 244 | 15.3 | 20.2 | 78 | 4.9 | 0.688 | 6 | Lost Div |
| Roger Staubach | 1978 | DAL | 18 | 256 | 14.2 | 18.6 | 78 | 4.4 | 0.722 | 8 | Lost SB |
| John Elway | 1991 | DEN | 18 | 269 | 14.9 | 19.3 | 78 | 4.3 | 0.722 | 8 | Lost CCG |
This really hammers home the importance of points prevention in QB wins. A full 92 of 100 reached the postseason, and this includes a number of seasons win which the QB himself played rather poorly. Narrow it down to the top 20 seasons of support, and the QB went on to win the league championship or Super Bowl a remarkable 14 times. Once again, I feel compelled to state the obvious: winning a ring is far more likely when the entire team plays great football around the QB.
Now the bottom 100 seasons of defensive support:
| Quarterback | Year | Team | QGm | PA | PA/G | LgAvg | Support | Sup/G | Win % | O/U | Playoffs |
|---|---|---|---|---|---|---|---|---|---|---|---|
| Y.A. Tittle | 1950 | BAL | 10 | 407 | 40.7 | 21.6 | -191 | -19.1 | 0.1 | -8 | - |
| Jim Plunkett | 1972 | NWE | 14 | 446 | 31.9 | 19.6 | -171 | -12.2 | 0.214 | -8 | - |
| Peyton Manning | 2001 | IND | 16 | 486 | 30.4 | 19.9 | -167 | -10.4 | 0.375 | -4 | - |
| Dan Pastorini | 1973 | HOU | 12 | 385 | 32.1 | 19.1 | -156 | -13 | 0 | -12 | - |
| Joe Namath | 1975 | NYJ | 13 | 402 | 30.9 | 20.2 | -139 | -10.7 | 0.231 | -7 | - |
| Jim Zorn | 1976 | SEA | 13 | 384 | 29.5 | 18.9 | -139 | -10.7 | 0.154 | -9 | - |
| Steve Young | 1986 | TAM | 14 | 419 | 29.9 | 20.2 | -136 | -9.7 | 0.143 | -10 | - |
| Archie Manning | 1980 | NOR | 15 | 437 | 29.1 | 20.2 | -134 | -8.9 | 0.067 | -13 | - |
| Jeff Blake | 1999 | CIN | 13 | 395 | 30.4 | 20.6 | -127 | -9.8 | 0.231 | -7 | - |
| Bobby Hebert | 1996 | ATL | 14 | 409 | 29.2 | 20.3 | -125 | -9 | 0.214 | -8 | - |
| Roman Gabriel | 1973 | PHI | 14 | 393 | 28.1 | 19.2 | -125 | -8.9 | 0.393 | -3 | - |
| Kurt Warner | 2000 | STL | 12 | 363 | 30.3 | 20.3 | -119 | -9.9 | 0.667 | 4 | Lost WC |
| Jeff Blake | 2003 | ARI | 13 | 387 | 29.8 | 20.7 | -118 | -9.1 | 0.231 | -7 | - |
| George Blanda | 1965 | HOU | 12 | 357 | 29.8 | 20.3 | -114 | -9.5 | 0.25 | -6 | - |
| Drew Brees | 2015 | NOR | 15 | 449 | 29.9 | 22.5 | -111 | -7.4 | 0.467 | -1 | - |
| Billy Kilmer | 1969 | NOR | 13 | 376 | 28.9 | 20.4 | -110 | -8.5 | 0.385 | -3 | - |
| Jeff Garcia | 1999 | SFO | 11 | 337 | 30.6 | 20.6 | -110 | -10 | 0.182 | -7 | - |
| Bobby Layne | 1949 | NYY | 12 | 368 | 30.7 | 21.5 | -110 | -9.2 | 0.125 | -9 | - |
| Norm Snead | 1967 | PHI | 14 | 409 | 29.2 | 21.4 | -110 | -7.8 | 0.464 | -1 | - |
| Steve DeBerg | 1985 | TAM | 11 | 342 | 31.1 | 21.1 | -109 | -9.9 | 0.091 | -9 | - |
| Kerry Collins | 2004 | OAK | 14 | 408 | 29.1 | 21.4 | -109 | -7.8 | 0.286 | -6 | - |
| Fran Tarkenton | 1962 | MIN | 14 | 410 | 29.3 | 21.7 | -107 | -7.6 | 0.179 | -9 | - |
| Joe Namath | 1976 | NYJ | 8 | 258 | 32.3 | 19 | -106 | -13.3 | 0 | -8 | - |
| Peyton Manning | 1998 | IND | 16 | 444 | 27.8 | 21.1 | -106 | -6.6 | 0.188 | -10 | - |
| Bernie Kosar | 1990 | CLE | 13 | 364 | 28 | 19.9 | -105 | -8.1 | 0.231 | -7 | - |
| Fran Tarkenton | 1963 | MIN | 12 | 360 | 30 | 21.4 | -104 | -8.6 | 0.333 | -4 | - |
| Jon Kitna | 2007 | DET | 16 | 444 | 27.8 | 21.5 | -100 | -6.2 | 0.438 | -2 | - |
| Steve DeBerg | 1979 | SFO | 16 | 416 | 26 | 19.8 | -100 | -6.2 | 0.125 | -12 | - |
| Eli Manning | 2009 | NYG | 15 | 420 | 28 | 21.4 | -99 | -6.6 | 0.467 | -1 | - |
| Jay Cutler | 2008 | DEN | 16 | 448 | 28 | 21.8 | -99 | -6.2 | 0.5 | 0 | - |
| Norm Snead | 1963 | WAS | 14 | 398 | 28.4 | 21.4 | -99 | -7 | 0.214 | -8 | - |
| Vinny Testaverde | 1996 | BAL | 15 | 403 | 26.9 | 20.3 | -98 | -6.6 | 0.267 | -7 | - |
| Norm Snead | 1961 | WAS | 14 | 392 | 28 | 21 | -98 | -7 | 0.107 | -11 | - |
| Boomer Esiason | 1991 | CIN | 14 | 362 | 25.9 | 18.9 | -97 | -7 | 0.214 | -8 | - |
| Mark Rypien | 1995 | STL | 6 | 226 | 37.7 | 21.5 | -97 | -16.2 | 0.167 | -4 | - |
| Jeff Garcia | 2000 | SFO | 16 | 422 | 26.4 | 20.4 | -96 | -6 | 0.375 | -4 | - |
| Warren Moon | 1984 | HOU | 15 | 410 | 27.3 | 20.9 | -96 | -6.4 | 0.2 | -9 | - |
| Sonny Jurgensen | 1968 | WAS | 11 | 316 | 28.7 | 20 | -96 | -8.7 | 0.273 | -5 | - |
| Daunte Culpepper | 2002 | MIN | 16 | 442 | 27.6 | 21.7 | -96 | -6 | 0.375 | -4 | - |
| Jim Everett | 1990 | RAM | 16 | 412 | 25.8 | 19.9 | -93 | -5.8 | 0.313 | -6 | - |
| Jim Zorn | 1977 | SEA | 10 | 264 | 26.4 | 17.1 | -93 | -9.3 | 0.4 | -2 | - |
| Trent Green | 2004 | KAN | 16 | 435 | 27.2 | 21.4 | -93 | -5.8 | 0.438 | -2 | - |
| Lynn Dickey | 1983 | GNB | 16 | 439 | 27.4 | 21.7 | -92 | -5.8 | 0.5 | 0 | - |
| Jon Kitna | 2010 | DAL | 10 | 312 | 31.2 | 22 | -92 | -9.2 | 0.4 | -2 | - |
| Phil Simms | 1980 | NYG | 13 | 355 | 27.3 | 20.3 | -91 | -7 | 0.231 | -7 | - |
| Drew Brees | 2016 | NOR | 16 | 454 | 28.4 | 22.7 | -91 | -5.7 | 0.438 | -2 | - |
| Drew Brees | 2012 | NOR | 16 | 454 | 28.4 | 22.7 | -91 | -5.7 | 0.438 | -2 | - |
| Matthew Stafford | 2009 | DET | 10 | 304 | 30.4 | 21.4 | -90 | -9 | 0.2 | -6 | - |
| Norm Snead | 1969 | PHI | 12 | 336 | 28 | 20.5 | -90 | -7.5 | 0.375 | -3 | - |
| Jim Hart | 1973 | STL | 11 | 301 | 27.4 | 19.3 | -89 | -8.1 | 0.318 | -4 | - |
| Warren Moon | 1989 | HOU | 17 | 438 | 25.8 | 20.5 | -89 | -5.2 | 0.529 | 1 | Lost WC |
| Jim Hart | 1981 | STL | 8 | 253 | 31.6 | 20.7 | -87 | -10.9 | 0.375 | -2 | - |
| Aaron Brooks | 2001 | NOR | 16 | 409 | 25.6 | 20.1 | -87 | -5.5 | 0.438 | -2 | - |
| Jim Everett | 1991 | RAM | 16 | 390 | 24.4 | 18.9 | -87 | -5.4 | 0.188 | -10 | - |
| Jeff George | 1997 | OAK | 15 | 394 | 26.3 | 20.5 | -87 | -5.8 | 0.2 | -9 | - |
| Marc Bulger | 2007 | STL | 11 | 323 | 29.4 | 21.5 | -86 | -7.8 | 0.182 | -7 | - |
| Jay Cutler | 2014 | CHI | 15 | 422 | 28.1 | 22.5 | -85 | -5.7 | 0.333 | -5 | - |
| Jim Everett | 1992 | RAM | 16 | 383 | 23.9 | 18.7 | -84 | -5.3 | 0.375 | -4 | - |
| Carson Palmer | 2012 | OAK | 14 | 402 | 28.7 | 22.7 | -84 | -6 | 0.286 | -6 | - |
| Jim Everett | 1994 | NOR | 16 | 407 | 25.4 | 20.2 | -83 | -5.2 | 0.438 | -2 | - |
| Jim Zorn | 1980 | SEA | 16 | 408 | 25.5 | 20.3 | -83 | -5.2 | 0.25 | -8 | - |
| Archie Manning | 1972 | NOR | 14 | 361 | 25.8 | 19.9 | -83 | -5.9 | 0.179 | -9 | - |
| Jake Plummer | 2000 | ARI | 14 | 368 | 26.3 | 20.4 | -83 | -5.9 | 0.214 | -8 | - |
| Alex Smith | 2006 | SFO | 16 | 412 | 25.8 | 20.6 | -82 | -5.1 | 0.438 | -2 | - |
| Dan Fouts | 1981 | SDG | 18 | 455 | 25.3 | 20.7 | -82 | -4.6 | 0.611 | 4 | Lost CCG |
| Dan Fouts | 1983 | SDG | 10 | 298 | 29.8 | 21.7 | -81 | -8.1 | 0.5 | 0 | - |
| Dan Fouts | 1973 | SDG | 7 | 216 | 30.9 | 19.3 | -81 | -11.6 | 0.071 | -6 | - |
| Charley Johnson | 1969 | STL | 9 | 266 | 29.6 | 20.6 | -81 | -9 | 0.167 | -6 | - |
| Billy Kilmer | 1970 | NOR | 10 | 269 | 26.9 | 18.8 | -81 | -8.1 | 0.1 | -8 | - |
| Eli Manning | 2015 | NYG | 16 | 442 | 27.6 | 22.6 | -81 | -5 | 0.375 | -4 | - |
| Marc Bulger | 2004 | STL | 15 | 402 | 26.8 | 21.4 | -81 | -5.4 | 0.533 | 1 | Lost Div |
| Neil O'Donnell | 1998 | CIN | 12 | 334 | 27.8 | 21.2 | -80 | -6.6 | 0.167 | -8 | - |
| Dan Marino | 1986 | MIA | 16 | 405 | 25.3 | 20.3 | -79 | -5 | 0.5 | 0 | - |
| Ken Anderson | 1979 | CIN | 12 | 317 | 26.4 | 19.8 | -79 | -6.6 | 0.25 | -6 | - |
| Drew Brees | 2003 | SDG | 11 | 307 | 27.9 | 20.7 | -79 | -7.2 | 0.182 | -7 | - |
| Fran Tarkenton | 1967 | NYG | 14 | 379 | 27.1 | 21.5 | -78 | -5.6 | 0.5 | 0 | - |
| Kurt Warner | 2008 | ARI | 20 | 515 | 25.8 | 21.9 | -78 | -3.9 | 0.6 | 4 | Lost SB |
| Joe Ferguson | 1984 | BUF | 11 | 308 | 28 | 21 | -77 | -7 | 0.091 | -9 | - |
| Richard Todd | 1979 | NYJ | 12 | 314 | 26.2 | 19.8 | -76 | -6.3 | 0.417 | -2 | - |
| Joe Ferguson | 1975 | BUF | 13 | 341 | 26.2 | 20.4 | -76 | -5.8 | 0.538 | 1 | - |
| Marc Bulger | 2008 | STL | 13 | 360 | 27.7 | 21.9 | -76 | -5.8 | 0.154 | -9 | - |
| Dan Fouts | 1985 | SDG | 11 | 309 | 28.1 | 21.2 | -76 | -6.9 | 0.636 | 3 | - |
| Cam Newton | 2011 | CAR | 16 | 429 | 26.8 | 22.1 | -75 | -4.7 | 0.375 | -4 | - |
| Dan Fouts | 1984 | SDG | 13 | 348 | 26.8 | 21 | -75 | -5.8 | 0.462 | -1 | - |
| Jon Kitna | 2002 | CIN | 13 | 357 | 27.5 | 21.7 | -75 | -5.8 | 0.154 | -9 | - |
| Fran Tarkenton | 1961 | MIN | 11 | 307 | 27.9 | 21.1 | -75 | -6.8 | 0.273 | -5 | - |
| John Hadl | 1971 | SDG | 14 | 341 | 24.4 | 19 | -75 | -5.3 | 0.429 | -2 | - |
| Matt Schaub | 2010 | HOU | 16 | 427 | 26.7 | 22 | -75 | -4.7 | 0.375 | -4 | - |
| Dan Marino | 1999 | MIA | 12 | 323 | 26.9 | 20.7 | -75 | -6.2 | 0.417 | -2 | Lost Div |
| Jeff George | 1994 | ATL | 14 | 358 | 25.6 | 20.2 | -75 | -5.3 | 0.429 | -2 | - |
| Neil Lomax | 1985 | STL | 16 | 414 | 25.9 | 21.2 | -74 | -4.7 | 0.313 | -6 | - |
| Marc Bulger | 2005 | STL | 7 | 217 | 31 | 20.4 | -74 | -10.6 | 0.286 | -3 | - |
| Y.A. Tittle | 1964 | NYG | 12 | 333 | 27.8 | 21.6 | -74 | -6.2 | 0.25 | -6 | - |
| Fran Tarkenton | 1971 | NYG | 13 | 321 | 24.7 | 19 | -74 | -5.7 | 0.308 | -5 | - |
| Joe Ferguson | 1977 | BUF | 14 | 313 | 22.4 | 17.1 | -73 | -5.2 | 0.214 | -8 | - |
| Steve McNair | 2001 | TEN | 15 | 375 | 25 | 20.1 | -73 | -4.9 | 0.467 | -1 | - |
| Matthew Stafford | 2012 | DET | 16 | 437 | 27.3 | 22.8 | -73 | -4.6 | 0.25 | -8 | - |
| Steve DeBerg | 1980 | SFO | 9 | 255 | 28.3 | 20.3 | -72 | -8 | 0.333 | -3 | - |
| Steve McNair | 2005 | TEN | 13 | 337 | 25.9 | 20.4 | -72 | -5.5 | 0.308 | -5 | - |
| Trent Green | 2000 | STL | 6 | 193 | 32.2 | 20.4 | -71 | -11.8 | 0.333 | -2 | Lost WC |
Here we see a bleak portrait of QB’s who were saddled with bad defenses. Only seven of 100 reached the playoffs (and one of those came as a backup), and only one made it to the Super Bowl (with a 9-7 team). Even the best QB seasons are usually torpedoed when paired with a terrible defense.
To show the stark contrast between strong and weak defensive support, this visualization combines the 200 QB seasons from the two tables above. The data points are sorted by defensive support on the x-axis and games over or under .500 on the y-axis. Notice how on the vertical scale, there is little overlap between the clump on the left and the clump on the right. With only a few exceptions, QB’s with great defenses won more games than those with terrible defenses. Shoutout to Kurt Warner for bucking the trend twice!
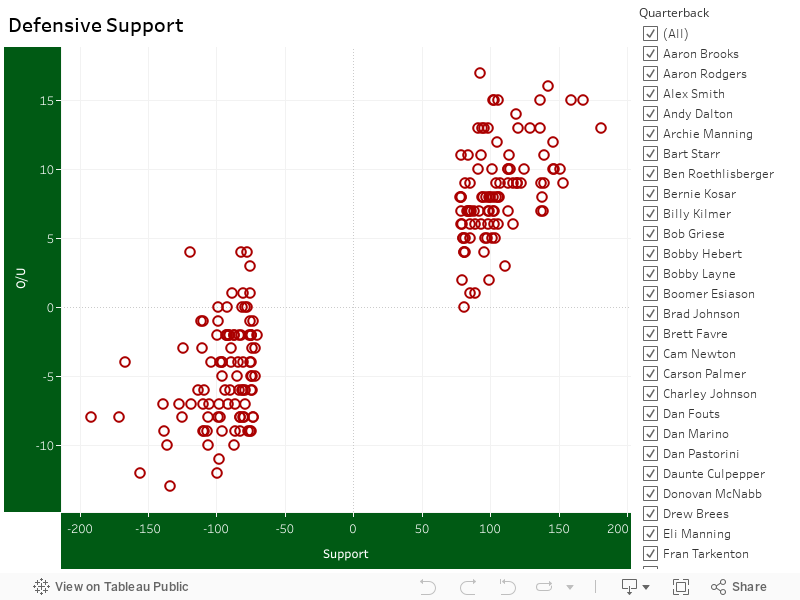
Helmet knock to Bryan Frye for helping create the visualization and to @ToddyMalone for compiling the data for league baselines.