≡ Menu

Previously:

In week 2, Cleveland, Kansas City, and Atlanta — with three high-profile quarterbacks — all went pass-happy. Arizona and Carolina — who also sport a pair of number one overall picks at quarterback, did the same. Cleveland dominated the Jets in a game that wasn’t really ever in doubt, and yet Baker Mayfield still wound up throwing on nearly two-thirds of all plays. In Kansas City, Patrick Mahomes was tasked to throw on over two-thirds of Chiefs plays, but hey – he’s Mahomes! The Falcons have Matt Ryan, and while he was inconsistent against the Eagles, Devonta Freeman rushed for just 22 yards on 11 carries. As a result, Atlanta threw on over 70% of its plays in a competitive game against Philadelphia, the highest pass ratio of any winning team in week two.

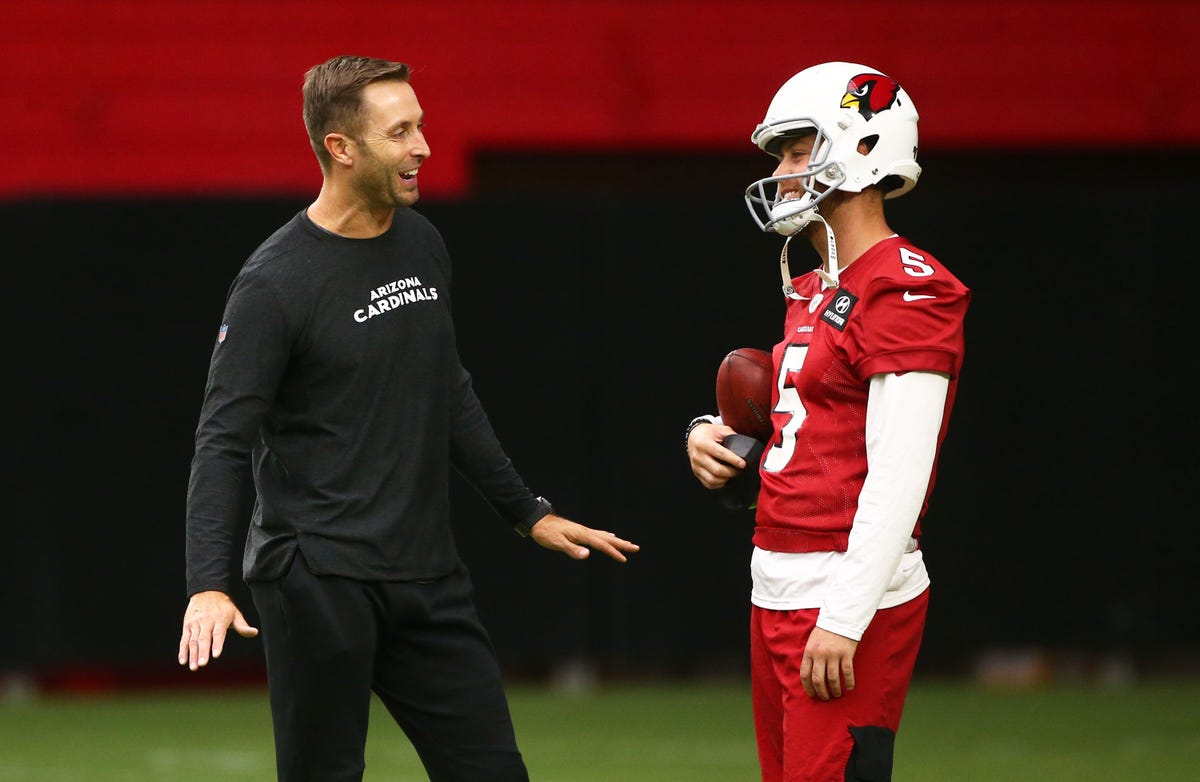
Meanwhile, Kyler Murray had 43 dropbacks and 3 rushing attempts against the Ravens, while RB David Johnson had just 7 carries. Arizona was trailing most of the way (-6.4 Game Script), but an 80% pass ratio is always going to stand out as pass-heavy.  Arizona and Kliff Kingsbury  had a similar Game Script in week 1 and threw on 72% of plays: it appears Arizona will not be easing into things for the number one overall pick. Finally, we have Carolina and Cam Newton, who is likely to miss week 3 with a lingering foot injury. Newton was obviously not at 100% in week 2 — he tied a career low with just 2 carries, and they gained 0 yards — and yet he tied a career high with 54 dropbacks! Christian McCaffrey (16 for 37) was not particularly effective on the ground, but this was a competitive game throughout. Normally, we suggest passing frequently in close games, but with an injured Newton, it’s fair to wonder if that was the right strategy.

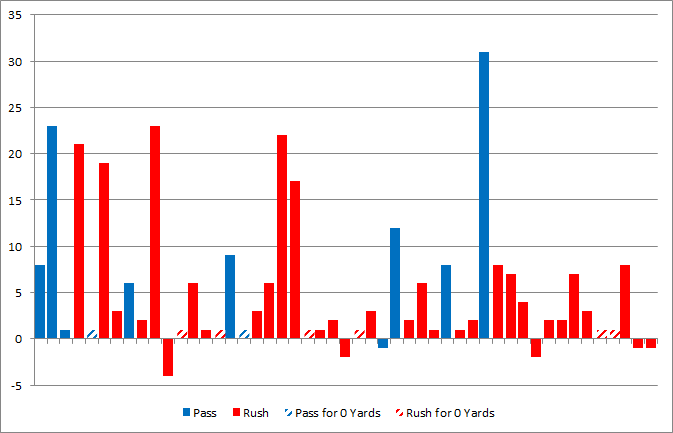
The full week 2 Game Scripts below: [continue reading…]

{ 0 comments }

Can you spot the HOF QB?

Eli Manning has been benched by the Giants, which means he may have taken his last NFL snap. As of today, he ranks 7th all-time in passing yards and 8th all-time in passing touchdowns. Manning also ranks 6th all-time in pass attempts, and his career is one of the more unusual ones in NFL history. And that’s because when a quarterback stays with one team for so long, it usually means he was one of the best quarterbacks in the NFL.

Today I want to compare how Eli Manning has fared, statistically, to the rest of the NFL. Manning was the first pick in the 2004 Draft, and so I looked at all passing stats in the NFL from 2004 through week 2 of the 2019 season. [continue reading…]

{ 0 comments }

In week 1, the passing stats were once again remarkable: the league averaged 7.08 ANY/A and produced a passer rating of 100.2.

In week 2, though, things dipped down quite a bit to 5.96 ANY/A and a passer rating of 87.6. There are injuries to be discussed. Sam Darnold is out with mono and didn’t play last night. Nick Foles broke his left clavicle early in week one and is out indefinitely. In week two, two Hall of Fame quarterbacks went down: Ben Roethlisberger is out for the season with an injured right elbow, and Drew Brees is out for two months torn ligament in the thumb on his throwing hand.

There are also the Dolphins to be discussed. Ryan Fitzpatrick and Josh Rosen combined to be terrible: 7 passing first downs, 4 interceptions, and 7 sacks. And Eli Manning, Carson Wentz, and Derek Carr all had ugly weeks, too.

What did help week 2? The reigning MVP of the NFL, Patrick Mahomes. The best player in football put together a 2nd quarter for the ages on Sunday against the Raiders. Mahomes completed 12 of 17 passes, for a remarkable 278 yards (23.2 yards per completion) and 4 touchdowns, with no interceptions or sacks and *ten* first downs. Jimmy Garoppolo and his former mentor Tom Brady both had great weeks, but there’s no question who was the best quarterback in week two.

The table below shows the full passing stats: [continue reading…]

{ 0 comments }

Kliff Kingsbury Kicks, Kicks, And Kicks Again

Kliff Kingsbury, flirting with the apple of his eye

Week 2 of the 2019 NFL season. With 2 minutes left in the first quarter, trailing 7-0, Arizona faced a 3rd-and-1 from the Ravens 4-yard line. Kyler Murray threw an incomplete pass, setting up a 4th-and-1 from the same distance.

This is an obvious situation to go for it, particularly when you are a 13-point underdog. Only contortionists can concoct 4th-and-1 situations where going for it is a bad idea, and nobody can sustain that argument from the opponent’s 4-yard line in the first quarter. And yet, Cardinals head coach Kliff Kingsbury sent out Zane Gonzalez to kick a short field goal, cutting the lead to 7-3.

After the next Baltimore drive resulted in a field goal, Arizona again drove down the field. The Cardinals reached 3rd-and-goal from the 3-yard line, when Murray threw an incomplete pass. That set up 4th-and-goal from the 3, trailing 10-3 midway through the 2nd quarter. This was another obvious go-for-it situation, but once again, Kingsbury sent Gonzalez out to get three points. Over the last 10 years, NFL offenses have scored touchdowns on about 41% of 3rd (or 4th) and goal plays from the 3-yard line. And as we’ll see in a minute, a 41% success rate is far above the necessary rate to make going for it the correct decision.

On Arizona’s first drive of the second half, trailing 17-6, Arizona once again drove inside Baltimore’s 10-yard line. On 2nd-and-goal from the 5, Murray threw to Larry Fitzgerald. Incomplete. On 3rd-and-goal from the 5, Murray again failed to connect with Fitzgerald. Facing 4th-and-goal from the 5, the Cardinals again sent out Gonzalez for a third chip shot. The Ravens defense was then called for a delay of game, moving Arizona up to the 2-yard line. From there, Kingsbury — trailing by 11 in the 2nd half — kept Gonzalez on the field! In perhaps the most indefensible move of the day, Kingsbury chose to kick a field goal. Over the last 5 years, teams have converted half of these 3rd (or 4th) and goal plays from the 2 into touchdowns. [continue reading…]

{ 1 comment }

First NFL Starts By Backup Quarterbacks And The Point Spread

Minshew and Leach at Washington State

Jaguars rookie Gardner Minshew is making his first NFL start today, as Jacksonville starting quarterback Nick Foles is out with a broken left calvicle. Minshew replaced Foles in week 1 and promptly had one of the best passing performances any player has ever had in his first NFL game, at least if you don’t adjust for era. He completed 22 of 25 passes for 275 yards and 2 TDs with one interception, far exceeding how you would expect a rookie 6th round pick would perform in a season opener.

You might think this would mean Vegas would have high hopes for Minshew, who starred at Washington State under Mike Leach. Together with Minshew and his mustache, he “led the Cougars to 10 wins for the sixth time in program history.”

You might think that this would mean Vegas would be buying on Minshew today against Houston, but that’s not the case: the Jaguars are 8-point underdogs in Houston. Jason Lisk recently wrote about Minshew in the context of the point spread in games started by non-first round backup quarterbacks.

That made me wonder: what would cause a team starting a “player like Minshew” to be favored? I looked at all quarterbacks since 1978 who: [continue reading…]

{ 0 comments }

Passing First Down Rate: What’s Average?

In week 1, Russell Wilson completed 70% of his passes, going 14 for 20. But in the modern NFL, completion percentage is meaningless. What really matters is first down percentage. Wilson took 4 sacks, and only 6 of his 14 completed passes picked up a first down. Therefore, Wilson picked up a first down on only 25% of his 24 dropbacks! Passing first down percentage and completion percentage are supposed to measure the same thing — how well an offense can consistently move the ball via the pass — but there can occasionally be a huge chasm between those numbers.

To be sure, passing first down percentage is hardly a perfect stat. Wilson completed an 8-yard pass on a 1st-and-10, a 7-yard pass on a 1st-and-10, and even had an 11-yard completion to Chris Carson that doesn’t get recorded as a first down because Carson fumbled. On the other hand, 5 of his completions were clearly not successful: a -3 yard completion on 2nd-and-long, a 2-yard completion on 3rd-and-17, 5- and 6-yard completions on 3rd-and-9s, and an 11-yard completion on 3rd-and-26.

Using success rate instead of passing first down percentage would be an improvement — you’d move the two long gains on 1st-and-10 into the success range, and say that 8 of his 24 pass plays were successful. And, of course, this isn’t all the quarterback’s fault or blame: it’s not his fault that Carson fumbled, it’s possible some of the 4 sacks weren’t his fault, and almost nobody is completing a 3rd-and-26 (on the other hand, he probably shouldn’t get credit when his receiver makes a great catch, or his offensive line blocks for much longer than average, or his receiver gets wide open, etc.).

So let’s not let the perfect be the enemy of the good: passing first down percentage is much better than completion percentage, and let’s leave it at that. You can view some of the outliers in NFL history in these two stats here.

A year ago, I looked at the relationship between those two statistics, and so I wanted to update that through the 2018 season. [continue reading…]

{ 0 comments }

What Happens After The Blowout?

The Titans lose 59-0, falling to 0-6. And respond by winning 5 straight games.

In 2011, the Colts were the worst team in the NFL. During mid-season of the year that would be remembered as the ‘Suck 4 Luck’ campaign, Indianapolis reached its lowest moment on national television against the Saints. Facing the high powered New Orleans offense and Drew Brees, it was a mismatch from the opening gun: New Orleans won 62-7.

This was a very good Saints team — that win brought New Orleans to 5-2 — and if you were picking a team to win the next week, you probably would have picked the Saints. The Saints were favored by 14 points against the Rams, but were upset, 31-21.

In 2014, the Matt Ryan-led Atlanta Falcons dominated the Bucs in a Thursday Night massacre. Atlanta won 56-14 in a game where the victors produced a record Game Script of 32.6! At 2-1, Atlanta looked like a team on the rise, but the Falcons lost in Minnesota the next week as 3-point favorites.

It feels inconceivable that a team could look so good one week and lose the next. And even more common is the team on the losing end of a humiliating loss turning things around immediately.

In recent years, the three worst blowouts were the Rams crushing the Raiders 52-0 in 2014, the Falcons demolition against the Bucs described above, and a 58-0 win by Seattle against the Cardinals. The very next week, Oakland, Tampa Bay, and Arizona not only all won, but all won as touchdown underdogs!

My favorite example comes from the 1983 Oilers. In 1982, Houston was terrible, going 1-8. They opened the ’83 season with 9 straight losses, and in the 10th game, lost to the Bengals 55-14 and trailed 48-0 after three quarters. And yet, the next week, as 6-point home underdogs, the Oilers won for just the second time in 20 games.

Okay, one more favorite example. In 2009, the Patriots destroyed the Titans, 59-0, on a snow-covered field in Foxboro. Tennessee dropped to 0-6 after the game, and switched quarterbacks from Kerry Collins to backup Vince Young. The Titans responded by winning five straight games!

In week 1, the Ravens dominated a Miami team that most assume is tanking. Baltimore finished the game with a remarkable +30.0 Game Script, qualifying by any measure as one of the biggest blowouts in recent memory. And while our eyes say Baltimore (a 13.5-point favorite at home against Arizona) and Miami (a 19-point underdog at home against the Patriots) will have similar performances in week two, history says we should exercise some caution in our projections. [continue reading…]

{ 1 comment }

Seven years ago, Neil Paine provided the formula for predicting the expected winning percentage for the home team at the start of a game, based on the Vegas point spread.  There were only 5 upsets where the favorite list, and a sixth game that was a tie with a 2.5-point spread.  The six biggest favorites all won, making this a pretty by-the-book week.

The table below shows the results of each game from the perspective of the home teams in week 1.  The “Expected W%” column shows the expected winning percentage of the home team based on the Vegas point spread; the Eagles were -10.5, so Philadelphia had a 78% chance of winning; the Dolphins were +7, so they had a 31% chance of winning.  The final column shows how likely or unlikely the result was: if the favorite won, the expected winning percentage number was used; if the favorite lost, the expected winning percentage of the underdog was used.  So when the Browns lost, that game gets marked as a 35% likelihood game. [continue reading…]

{ 0 comments }

The Game Scripts are back! As a reminder, a Game Script is simply the average score of a game over each second of play during the game. And if you are like me, as you watched the Dolphins/Ravens game unfold, you were wondering what would the final Game Script be from that massive blowout.

The Ravens took a 7-0 lead less than five minutes into the game, and that jumped to 14-0 before the 8-minute mark, 21-0 before the 11-minute mark, and 28-0 after just 16 minutes. Baltimore got the lead up to 42-10 at halftime, and scored three times in the second half to walk away with a 59-10 win. Over the course of the 3,600 seconds of this game, Baltimore’s average lead was 30.0 points.

That’s the best Game Script by a team since this Rams/Raiders blowout in 2014, a 52-0 win that registered a 30.9 Game Script. [continue reading…]

{ 2 comments }

Jackson squished the fish on Sunday

After every week, I post the weekly passing numbers to look at which passers produced the best stats of the week. The formula is pretty simple.

It begins with Adjusted Net Yards per Attempt, which is (Passing Yards + 20*Passing TDs – 45*INTs – Sack Yards Lost) divided by (Pass Attempts + Sacks). Let’s begin with the best passing performance of week one, which belongs to Ravens second-year quarterback Lamar Jackson. Baltimore’s young quarterback went 17/20 for 324 yards with 5 TDs and 0 INTs, while taking 1 sack and losing one yard. That means Jackson had 423 Adjusted Net Yards on 21 dropbacks, or 20.14 Adjusted Net Yards per Attempt.

The NFL as a whole in week 1 averaged 7.08 ANY/A, which sets our baseline for average play. This means Jackson was 13.06 ANY/A above average over 21 dropbacks, which means he produced 274 Adjusted Net Yards of value over average. That, of course, was the most in the NFL.

It also harkens back to one of the greatest performances in NFL history by another Baltimore quarterback: Johnny Unitas. Historians have long regarded Unitas’s game against the 1967 Falcons as one of the best ever, and the stats confirm that.  In a ‘glitch in the matrix’ moment, the old Baltimore QB went 17/20 against the Falcons that day, for 370 yards with 4 TDs and 0 INTs. Both Unitas and now Jackson are part of the extremely rare 20/20 club: averaging 20 Adjusted Net Yards per Attempt on 20+ pass attempts. In fact, Baltimore has been involved in all three games: Unitas against the Falcons in ’67, Jackson against the Dolphins in week 1 of 2019, and what is the greatest statistical game in NFL history: Joe Namath (in a shootout with Unitas) against Baltimore in 1972.

The full week 1 passing stats below: [continue reading…]

{ 0 comments }

The Vikings Win With A Very Odd Gameplan

Minnesota opened its season with two Kirk Cousins pass plays resulting in a touchdown. The Vikings third offensive play of the season was a pass play, as was the team’s fifth.

Opening the season with 4 passing plays on the first 5 plays from scrimmage is hardly unusual.  What is unusual is what happened next.   On the Vikings final 44 plays of the day, Minnesota finished with 7 passing plays and 37 rushing plays!  On a drive against the Saints last season, Kirk Cousins went 8-for-10 with 1 sack and 1 touchdown; for the entire game on Sunday, Kirk Cousins went 8-for-10 with 1 sack and 1 touchdown!

The team ran 49 plays on Sunday in a 28-12 win over the Falcons.  Here are the results of those plays, in order, with pass plays in blue and rushing plays in red.  Also, because plays of 0 yards would otherwise not show up on the graph, I’ve noted them separately as 1-yard plays with diagonal shading.

The Vikings did not attempt a pass in the 4th quarter of the game, which is the sort of thing you can do when you lead 28-0 after three quarters.  Still, this was remarkable: the Vikings passed on just 22% of all plays. [continue reading…]

{ 0 comments }

Eli Manning is going to be the Giants starting quarterback today, for the 15th consecutive season opener. Drew Brees and Philip Rivers are the week 1 starters for the Saints and Chargers, respectively, for the 14th straight year. The 2019 season marks the 12th time in a row that Matt Ryan and Aaron Rodgers opened up under center for the Falcons and Packers. And Matthew Stafford is Detroit’s opening game starter for the 11th straight year.

Those six teams have had the same week 1 starter for over a decade; meanwhile, 11 teams are turning to a different week 1 starter than they had this time last year. We can group them into three categories:

The Returning Starters (5): Baker Mayfield, Josh Allen, and Lamar Jackson were first round picks in the 2018 NFL Draft and ended their rookie seasons as starting quarterbacks; they will all be starting for their teams in week one of the 2019 season. Carson Wentz is the Eagles franchise quarterback, but he wasn’t fully recovered from the torn ACL injury that ended his 2017 season in time for the 2018 season opener. Jameis Winston was suspended for three games to begin the 2018 season for violating the NFL’s personal conduct policy, in connection with a female Uber driver accusing Winston of groping her.

The Rookie (1): Kyler Murray was the first overall pick in the 2019 NFL Draft, and he will start for the Cardinals in week one. There were two other first round quarterbacks — Daniel Jones in New York, Dwayne Haskins in Washington — and it is likely that both will follow the Mayfield/Allen/Jackson path, finishing their rookie years as starters and being the opening day starter in 2010.

The New Veteran Starters (5): In Washington, Alex Smith was the starter in 2018, but after suffering a gruesome knee injury, his future is in doubt. The Redskins brought in Case Keenum to replace him. Keenum was Denver’s starter last year, and the Broncos brought in Joe Flacco to replace him, after Flacco lost his job to Jackson in Baltimore. With Wentz and Winston back as starters, that left Nick Foles and Ryan Fitzpatrick without jobs: Foles landed in Jacksonville to replace Blake Bortles (backup for the Rams), while Fitzpatrick is the starter in Miami with the Ryan Tannehill era (now a backup in Tennessee) over. Finally, the surprise retirement by Andrew Luck has left the Colts turning to 2018 backup Jacoby Brissett as the team’s starter.

For the Browns, Mayfield has so clearly entrenched himself as the team’s starting quarterback that it’s easy to forget that he wasn’t the starter entering last season. And while the dysfunction appears to be over, Mayfield will now be Cleveland’s 7th different starting quarterback in week 1 in 7 seasons, tying an NFL record. The ’13-’19 Browns are the fourth team to have 7 different opening day starting quarterbacks in 7 years, joining the Ravens from ’97 to ’03, the Chargers from 1987 to 1993, and the Colts from 1984 to 1990.

The table below shows each team’s week 1 starting quarterback in each year since 2010. [continue reading…]

{ 0 comments }

2019 Pre-Season Wins Totals: Who Rose And Fell?

Back in May, I produced implied Vegas team ratings from the points spreads released by CG Technology. Before the Thursday Night Kickoff game between the Packers and Bears (the less said about that game, the better), Vegas released the final over/under wins totals for each of the 32 teams.

Which made me curious: who are the biggest risers and fallers since May?

The graph below shows the 32 teams. On the horizontal X-Axis is the the expected margin of victory for each team over their 16 games, based on the points spreads released in May (the units are points per game differential).  This incorporates both strength of schedule and home field advantage — it is the actual expected score at the end of the game.  The Y-Axis shows the wins total for each team as of September 5th, which also of course incorporates SOS and HFA. [continue reading…]

{ 0 comments }

Do Running Backs Matter?

Seth Keysor highlights one of the great debates of football twitter in 2019 with four words, and then a bit wordier summary:

Running backs don’t matter.

Everyone who follows football closely has heard that statement or some version of it over the past few years. It’s an exaggerated claim that actually means something closer to this: Not only is running the ball much less important than passing the ball, but running back production is also so dependent on the blocking and offensive scheme that the ability of an individual running back doesn’t move the needle as much as other skill positions like quarterback, wide receiver and tight end. That’s a lot wordier than “running backs don’t matter,” though.

Whether running backs matter much is a difficult question to answer, but I think there’s one thing we can all agree on: they are much more important in fantasy football than real football. On the other hand, we should be careful not to go too far in the other direction and say that running backs don’t matter at all.

Let’s suppose that we think offense, defense, and special teams are worth 4 parts, 3 parts, and 1 part of a team. This makes the 11 starting players on offense worth 50% of the team. We don’t quite know how valuable a quarterback is, but let’s conservatively suggest that they’re worth double the average offensive player. That would make the quarterback position worth 8.3% of the team, leaving 41.7% for the other 10 offensive players (and they’re backups). If you think the quarterback is worth more than that, than there would be an even smaller pie for the rest of the offense. [continue reading…]

{ 0 comments }

Super Bowl Teams And Passing Efficiency

Over the last two days, I have argued that the value of a top passing offense is lower than it used to be. One natural counter to that might be, hey Chase, haven’t you noticed that Tom Brady and the Patriots tend to always win the Super Bowl?

But that’s not exactly as convincing an argument as you might think. The Patriots won the Super Bowl in 2014, 2016, and 2018. And let’s be super clear about what I’m saying: I am not saying that quarterbacks are not critical, just that they are less critical than they used to be! From 1958 to 1979, the team that won the NFL championship or Super Bowl had a Hall of Fame quarterback in all but two of those seasons.

So yes, Tom Brady may be winning Super Bowls, but that’s hardly evidence that quarterbacks matter more than ever. Especially when you consider that Brady being at his best has borne little relation to whether or not the Patriots win the Super Bowl.

The graph below shows the Patriots passing offense in each season from 2001 to 2018, measured by New England’s Adjusted Net Yards per Attempt average minus league average ANY/A. Yes, New England has had an above-average passing offense each year. The team has won 6 Super Bowls, and those dots are in gold and black. [continue reading…]

{ 0 comments }

More Thoughts On The Value Of A Passing Offense

This is Part 2 to yesterday’s post about how value is determined. Please read that before proceeding.

Here’s a hypothetical situation to consider. In a few months, the NFL owners get together and decide that passing is too easy, scoring is too high, and offenses are too good. As a result, they have agreed upon a drastic rules change: starting in the 2020 season, NFL defenses will be allowed to put 12 players on the field, while NFL offenses will still be constrained to 11 players.

This will significantly change the NFL landscape, of course. Scoring is going to plummet. Passing efficiency is going to tank, and rushing with any sort of consistency is going to be impossible.

Now, here’s a question. You are the Kansas City Chiefs with Patrick Mahomes, who — for the sake of this argument — has just completed his second consecutive MVP season. He’s the clear best quarterback in the NFL, but he will now be playing in an NFL where passing is going to be much, much harder.

Does this rule change help or hurt your team’s chances of winning?

Think about it for a minute.

*****************************

I can wait.

***************************** [continue reading…]

{ 1 comment }

How Is Value Determined?

You are offered the opportunity to win some money by picking two marbles, one each out of two different bags. First, you get to dip your hand into a bag of six red marbles, with each marble worth a different dollar amount. The dollar amounts are $10, $20, $30, $40, $50, and $60. You will next get to dip your hand into a bag of six blue marbles, with the marbles worth $60, $64, $68, $72, $76, and $80.

Simple math will tell you that the average red marble is worth $35 and the average blue marble is worth $70; it’s clear which bag has the better marbles, and you can also expect to walk away with about $105 once this game is completed. Now, our benevolent contest operator says he will make your life even better. In one of the bags, he will discard the bottom three marbles: he will remove either the $10, $20, or $30 marbles from the red bag, or the $60, $64, or $68 marbles from the blue bag. This, of course, is great news. [continue reading…]

{ 0 comments }

In this series, I will be looking at the history of coaches, quarterbacks, rushers, and receivers for all 32 franchises. For coaches and quarterbacks, I will be looking at how much their franchise’s career records (regular season only) would change if we removed the games with that person. For rushers and receivers, I will note how many times that player was the team’s leading rusher/receiver over the course of their time with that franchise (regular plus postseason).

Teams:

AFC East: Dolphins, Bills, Jets, and Patriots
NFC East: Cowboys, Eagles, Giants, and Redskins
AFC North: Steelers, Browns, Ravens, and Bengals
NFC North: Packers, Vikings, Bears, and Lions
AFC South: Jaguars, Colts, Texans, and Titans
NFC South: Panthers, Falcons, Saints, and Buccaneers
AFC West: Raiders, Chiefs, Chargers, and Broncos
NFC West: Seahawks, Rams, 49ers, and Cardinals
[continue reading…]

{ 0 comments }

In this series, I will be looking at the history of coaches, quarterbacks, rushers, and receivers for all 32 franchises. For coaches and quarterbacks, I will be looking at how much their franchise’s career records (regular season only) would change if we removed the games with that person. For rushers and receivers, I will note how many times that player was the team’s leading rusher/receiver over the course of their time with that franchise (regular plus postseason).

Previous Teams:

AFC East: Dolphins, Bills, Jets, and Patriots
NFC East: Cowboys, Eagles, Giants, and Redskins
AFC North: Steelers, Browns, Ravens, and Bengals
NFC North: Packers, Vikings, Bears, and Lions
AFC South: Jaguars, Colts, Texans, and Titans
NFC South: Panthers, Falcons, Saints, and Buccaneers
AFC West: Raiders, Chiefs, Chargers, and Broncos
NFC West: Seahawks, Rams, 49ers
[continue reading…]

{ 0 comments }

In this series, I will be looking at the history of coaches, quarterbacks, rushers, and receivers for all 32 franchises. For coaches and quarterbacks, I will be looking at how much their franchise’s career records (regular season only) would change if we removed the games with that person. For rushers and receivers, I will note how many times that player was the team’s leading rusher/receiver over the course of their time with that franchise (regular plus postseason).

Previous Teams:

AFC East: Dolphins, Bills, Jets, and Patriots
NFC East: Cowboys, Eagles, Giants, and Redskins
AFC North: Steelers, Browns, Ravens, and Bengals
NFC North: Packers, Vikings, Bears, and Lions
AFC South: Jaguars, Colts, Texans, and Titans
NFC South: Panthers, Falcons, Saints, and Buccaneers
AFC West: Raiders, Chiefs, Chargers
NFC West: Seahawks, Rams, 49ers [continue reading…]

{ 0 comments }

In this series, I will be looking at the history of coaches, quarterbacks, rushers, and receivers for all 32 franchises. For coaches and quarterbacks, I will be looking at how much their franchise’s career records (regular season only) would change if we removed the games with that person. For rushers and receivers, I will note how many times that player was the team’s leading rusher/receiver over the course of their time with that franchise (regular plus postseason).

Previous Teams:

AFC East: Dolphins, Bills, Jets, and Patriots
NFC East: Cowboys, Eagles, Giants, and Redskins
AFC North: Steelers, Browns, Ravens, and Bengals
NFC North: Packers, Vikings, Bears, and Lions
AFC South: Jaguars, Colts, Texans, and Titans
NFC South: Panthers, Falcons, Saints, and Buccaneers
AFC West: Raiders, Chiefs, Chargers
NFC West: Seahawks, Rams
[continue reading…]

{ 0 comments }

In this series, I will be looking at the history of coaches, quarterbacks, rushers, and receivers for all 32 franchises. For coaches and quarterbacks, I will be looking at how much their franchise’s career records (regular season only) would change if we removed the games with that person. For rushers and receivers, I will note how many times that player was the team’s leading rusher/receiver over the course of their time with that franchise (regular plus postseason).

Previous Teams:

AFC East: Dolphins, Bills, Jets, and Patriots
NFC East: Cowboys, Eagles, Giants, and Redskins
AFC North: Steelers, Browns, Ravens, and Bengals
NFC North: Packers, Vikings, Bears, and Lions
AFC South: Jaguars, Colts, Texans, and Titans
NFC South: Panthers, Falcons, Saints, and Buccaneers
AFC West: Raiders, Chiefs
NFC West: Seahawks, Rams
[continue reading…]

{ 0 comments }

2018 Surplus Yards, By Adam Steele

Adam Steele is back for another guest post. You can view all of Adam’s posts here. As always, we thank him for contributing.


Last year I introduced a metric called Surplus Yards to measure the percentage of yards a QB gains from long passing plays. If you haven’t read that post I strongly encourage you to do so before continuing.

Here is a table showing every 40+ yard completion from the 2018 regular season, listed from longest completion. As you can see, Ben Roethlisberger had a 97-yard completion, a 78-yard completion, two 75-yard completions, and so on. Roethlisberger had 15 completions last year of 40+ yards, second-most in the NFL: [continue reading…]

{ 0 comments }

In this series, I will be looking at the history of coaches, quarterbacks, rushers, and receivers for all 32 franchises. For coaches and quarterbacks, I will be looking at how much their franchise’s career records (regular season only) would change if we removed the games with that person. For rushers and receivers, I will note how many times that player was the team’s leading rusher/receiver over the course of their time with that franchise (regular plus postseason).

Previous Teams:

AFC East: Dolphins, Bills, Jets, and Patriots
NFC East: Cowboys, Eagles, Giants, and Redskins
AFC North: Steelers, Browns, Ravens, and Bengals
NFC North: Packers, Vikings, Bears, and Lions
AFC South: Jaguars, Colts, Texans, and Titans
NFC South: Panthers, Falcons, Saints, and Buccaneers
AFC West: Raiders, Chiefs
NFC West: Seahawks
[continue reading…]

{ 0 comments }

Andrew Luck Retires: How Good Was He Really?

Seven years ago, Andrew Luck entered the NFL as one of the greatest quarterback prospects of all time. He was expected to become this generation’s John Elway or Peyton Manning, and he never looked the part more so than on this touchdown pass:

Those who witnessed the Luck era will not soon forget it. The hype accompanied Luck was massive, because he was a perfect prospect. He not only had an arm that could do this, with little help from his legs…

But he also had legs that could do this, with a little help from his arms…

[continue reading…]

{ 0 comments }

In this series, I will be looking at the history of coaches, quarterbacks, rushers, and receivers for all 32 franchises. For coaches and quarterbacks, I will be looking at how much their franchise’s career records (regular season only) would change if we removed the games with that person. For rushers and receivers, I will note how many times that player was the team’s leading rusher/receiver over the course of their time with that franchise (regular plus postseason).

Previous Teams:

AFC East: Dolphins, Bills, Jets, and Patriots
NFC East: Cowboys, Eagles, Giants, and Redskins
AFC North: Steelers, Browns, Ravens, and Bengals
NFC North: Packers, Vikings, Bears, and Lions
AFC South: Jaguars, Colts, Texans, and Titans
NFC South: Panthers, Falcons, Saints, and Buccaneers
AFC West: Raiders
NFC West: Seahawks
[continue reading…]

{ 0 comments }

In this series, I will be looking at the history of coaches, quarterbacks, rushers, and receivers for all 32 franchises. For coaches and quarterbacks, I will be looking at how much their franchise’s career records (regular season only) would change if we removed the games with that person. For rushers and receivers, I will note how many times that player was the team’s leading rusher/receiver over the course of their time with that franchise (regular plus postseason).

Previous Teams:

AFC East: Dolphins, Bills, Jets, and Patriots
NFC East: Cowboys, Eagles, Giants, and Redskins
AFC North: Steelers, Browns, Ravens, and Bengals
NFC North: Packers, Vikings, Bears, and Lions
AFC South: Jaguars, Colts, Texans, and Titans
NFC South: Panthers, Falcons, Saints, and Buccaneers
AFC West: Raiders
[continue reading…]

{ 0 comments }

All Time NFC South Teams, by Bryan Frye

This marks the end of my series on all-time division teams. As I have advertised at a shamelessly attention seeking level, I wrote this while under the influence of narcotics following back surgery. While I’m sure the series would have been better had I written while more cognizant of my surroundings, the idea of trying to sleepwalk my way through a historical piece piqued my interest. The idea of accidentally forgetting obvious players or saying things I would normally filter when thinking rationally amuses me, and I can’t pass up the opportunity to embarrass myself and my children after me. Once again, these are the rules Chase and I have agreed on:

  1. I write everything before my painkiller prescription runs out,
  2. I write it completely off the top of my head and don’t do any research,
  3. I don’t have to proofread this when I finish it, and
  4. Chase doesn’t edit my nonsense out of the article (so we can maximize my odds of getting owned online).[1]Roster construction is as follows: 1 QB, 2 RB, 3 WR, 2 TE, 2 T, 2 G, 1 C, 2 DE, 2 DT, 2 OLB, 2 MLB/ILB, 3 CB, 2 S, 1 K, 1 P, 1 HC
  5. I maintain modern division designations. If a player played for the Seahawks when the team was in the AFC West, I am counting him in the NFC West. I spent five minutes staring at the corner of my phone because I didn’t remember it being that shape, so I’m sure as hell not spending time putting Aeneas Williams in the NFC East.

Previous articles:

AFC North
AFC East
AFC West
AFC South
NFC North
NFC East
NFC West

Without further ado, here’s the NFC South: [continue reading…]

References

References
1 Roster construction is as follows: 1 QB, 2 RB, 3 WR, 2 TE, 2 T, 2 G, 1 C, 2 DE, 2 DT, 2 OLB, 2 MLB/ILB, 3 CB, 2 S, 1 K, 1 P, 1 HC
{ 0 comments }

1962 in Review: Comparing Starting QBs to 2018

In 1962, Eagles QB Sonny Jurgensen averaged 8.9 yards/attempt. In 2018, Eagles QB Carson Wentz averaged 7.7 yards per attempt.

In 1962, Packers QB Bart Starr averaged 8.6 yards/attempt. In 2018, Packers QB Aaron Rodgers averaged 7.4 yards per attempt.

In 1962, 36-year-old Giants QB Y.A. Tittle averaged 8.6 yards/attempt. In 2018, 37-year-old Giants QB Eli Manning averaged 7.5 yards/attempt.

In 1962, Redskins QB Norm Snead averaged 8.3 yards/attempt. In 2018, Washington QB Alex Smith averaged 6.6 yards/attempt.

And while those were the four best quarterbacks of 1962, a cherry-picked sample doesn’t explain the superiority of the ’62 passers.

  • Vikings QB Fran Tarkenton averaged 7.9 yards/attempt in ’62, besting ’18 successor Kirk Cousins and his 7.1 Y/A average.
  • Bears QB Billy Wade averaged 7.7 yards/attempt in ’62, while Chicago QB Mitchell Trubisky averaged 7.4 yards/attempt last year.
  • The Cardinals? Forget about any comparison here. In 1962, Charley Johnson averaged 7.9 yards/attempt, while 2018 Josh Rosen gained just 5.8 yards per attempt for the Cardinals.
  • In 1962, Dallas split its quarterback duties between Eddie LeBaron and Don Meredith. The 32-year-old LeBaron averaged 8.7 yards per attempt in 6 starts, while the 24-year-old Meredith averaged 7.9 yards per attempt in 8 starts; either way, both bested 2018 Dak Prescott, who averaged 7.4 yards per attempt for the Cowboys.

At this point, you’re probably thinking that I’m engaging in some form of misdirection about the 1962 season versus the 2018 season. I can assure you I am not. In 1962, Lions QB Milt Plum gained 7.3 yards per attempt; in ’18, Detroit QB Matthew Stafford averaged 6.8 yards per attempt. What about the Colts? Well, in 1962, John Unitas averaged 7.6 yards per attempt; that’s better than 2018 Andrew Luck, who gained 7.2 yards per pass attempt. In 1962, Cleveland QB Frank Ryan averaged 7.9 yards per attempt; in 2018, Cleveland QB Baker Mayfield averaged 7.7 yards per attempt.

There were 14 teams in the NFL in 1962, and all 14 teams are still around today (albeit with some relocation). Relative to the starting quarterbacks for those teams in 2018, 11 of the starting quarterbacks in 1962 averaged more yards per pass attempt than their 2018 successors. The three outliers were in Pittsburgh, San Francisco, and Los Angeles. In 1962, John Brodie averaged a very respectable 7.5 yards per attempt, but 2018 Nick Mullens averaged 8.3 yards per attempt. If you expected to read an article about how Nick Mullens helped save the 2018 NFL season from looking weak relative to 1962, you are a better prophet than me. In ’62, Steelers 36-year-old QB Bobby Layne averaged 7.2 yards per attempt; last year, Pittsburgh’s 36-year-old QB Ben Roethlisberger averaged 7.6 yards per attempt. And finally, the 1962 Los Angeles Rams were awful: Zeke Bratkowski averaged a league-low 7.0 yards per attempt, and the team went 1-12-1. Last year, Jared Goff of the Los Angeles Rams averaged 8.4 yards per attempt as he helped the team win the NFC. [continue reading…]

{ 0 comments }

In Super Bowl II, Green Bay quarterback Bart Starr completed 13 of 24 passes for 202 yards, with 1 TD and no interceptions. He also took three sacks for 30 yards, and his backup was sacked once for 10 yards.

That means on 28 dropbacks, the Green Bay passing attack picked up 162 yards and produced 1 TD and 0 INTs, which translates to 142 Adjusted Net Yards. That’s an Adjusted Net Yards per Attempt average of 6.50 in Super Bowl II for Green Bay.

So was that a good performance by Starr and the Packers passing attack? No.

It was a great one. Passing efficiency was a lot different in 1967 than it is today, and the Raiders had a great pass defense. In 1966, Oakland allowed 3.14 ANY/A to opposing passers, the 3rd-best in the AFL; in 1967, that number dropped to just 2.23, the best in the AFL and third in all of pro football. And in 1968, opposing QBs averaged just 2.81 ANY/A against the Raiders. (And in 1969, it was just 2.64.)

The graph below shows every game for the Raiders defense from 1966 to 1968, in chronological order. Joe Namath consistently gave the Raiders problems, including in the famous Heidi Game in 1968. But otherwise, the Raiders pass defense tended to overwhelm most quarterbacks. On the X-Axis, we have games played in order. The Y-Axis shows the ANY/A allowed by the Raiders, shown from -6 to 14 (since the league average ANY/A was around 4.0). [continue reading…]

{ 0 comments }
Next Posts Previous Posts