
Adam Steele is back for another guest post. You can view all of Adam’s posts here. As always, we thank him for contributing.
Surplus Yards 2017
In response to the Jared Goff post from earlier this month, I wanted to delve into the yardage a QB picks up on long plays. I theorized that Goff’s historical ANY/A leap in 2017 was in part fueled by an unsustainable number of long completions. To measure this, I created a stat called Surplus Passing Yards. Its calculation is quite simple – on any given completion, yardage in excess of 40 is deemed to be surplus. So a 67 yard pass play yields 27 surplus yards. I then add up the surplus yards for all applicable plays during a season. [1]You may be wondering why I choose 40 yards as the cutoff for a “normal” play. After digging through years of play-by-play and running some correlations, 40 yards seems to be the inflection point … Continue reading
Having established in the above footnote that surplus yards are random and not indicative of QB skill, let’s take a look at the qualifying quarterbacks from 2017. The chart below shows every 40+ yard completion from each QB along with his total surplus yardage. For example, Alex Smith had 13 long passes of 40+ yards; his longest pass went for 79 yards, his second-longest pass for 78 yards, his third-longest for 75 yards, etc. That means his longest pass had 39 Surplus Yards, his second-longest completion had 38 Surplus Yards, and so on; all told, he had 236 Surplus Yards last season, the most in the NFL.
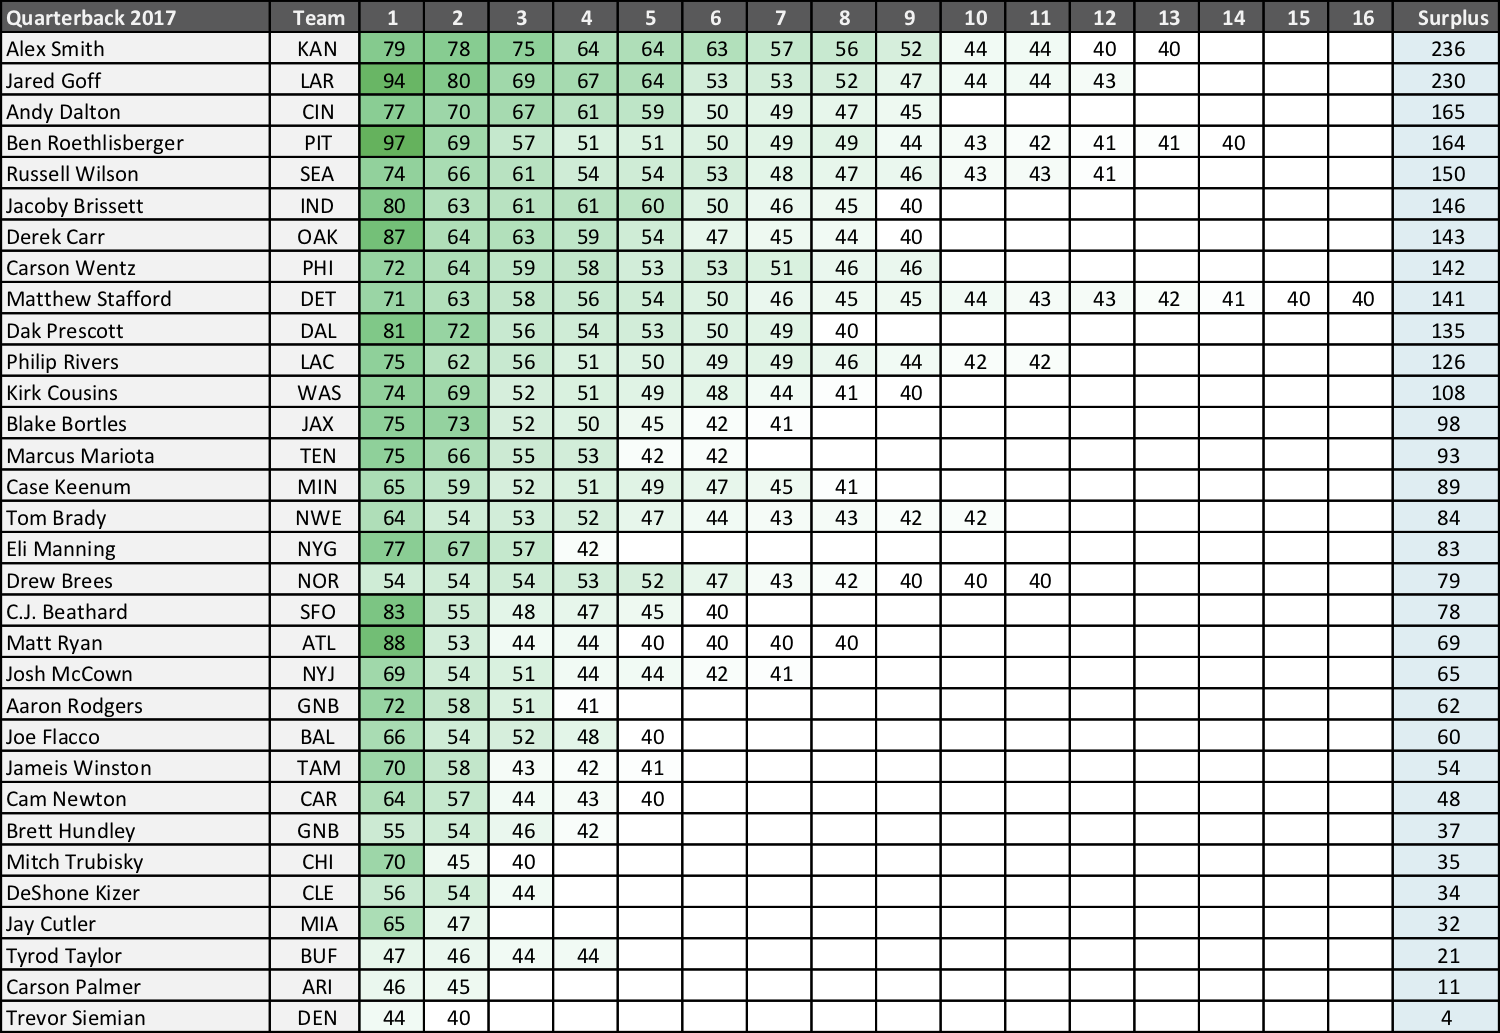
As you can see from the chart, Alex Smith and Jared Goff lapped the field with surplus yardage. Last season, Smith had nine completions of 50+ yards, after tallying only six during his first four seasons in Kansas City combined! Smith’s sudden jump in big plays was largely driven by the emergence of Tyreek Hill, but there is no evidence that Smith himself actually improved his deep passing ability. Rather, the completions that previously resulted in immediate tackles morphed into Hill outrunning the defense all the way to the endzone in 2017. Maybe a good sign for Patrick Mahomes in 2018 (although that would require Hill’s skill to be repeatable), but probably not a good one for Smith’s 2018 campaign in Washington.
At least most of Smith’s surplus yardage came from deep passes; we can’t say the same for Goff. Of Goff’s 12 completions of 40+ yards, five of them traveled fewer than 15 yards in the air. Goff picked up 80 yards on a screen pass to Todd Gurley (with 85 yards of YAC!), 64 yards — with 51 yards of YAC — after a series of jukes Cooper Kupp, 52 yards (with 53 yards of YAC) on a give-up pass to Robert Woods on 3rd-and-33 (!), 44 yards on another screen pass to Gurley, and 43 yards on yet another screen pass to Gurley. None of these five plays have any predictive value whatsoever to the quarterback’s ability, and none of them showcased any particular skill from Goff himself. His 94-yard TD pass to Robert Woods was a nice throw, but the play resulted in 50 fluff yards because it originated from the Rams’ six yard line and gave Woods half a field of grass in front him after making the catch. An identical play executed closer to the endzone would’ve netted fewer (possibly far fewer) yards, which is another aspect of surplus yardage randomness.
Jared Goff (ever so barely) led the NFL in ANY/A last season, but how much did his surplus yardage inflate his efficiency? In the chart below you’ll find just that under Surplus Y/A, along with Surplus % (percentage of his yards per attempt that came from surplus yards) and Surplus Yards:
| Quarterback | Team | Surp Y/A | Surp % | Surplus | Att | Yards |
|---|---|---|---|---|---|---|
| Jared Goff | LAR | 0.48 | 6.0% | 230 | 477 | 3804 |
| Alex Smith | KAN | 0.47 | 5.8% | 236 | 505 | 4042 |
| C.J. Beathard | SFO | 0.35 | 5.5% | 78 | 224 | 1430 |
| Andy Dalton | CIN | 0.33 | 5.0% | 165 | 496 | 3320 |
| Carson Wentz | PHI | 0.32 | 4.3% | 142 | 440 | 3296 |
| Jacoby Brissett | IND | 0.31 | 4.7% | 146 | 469 | 3098 |
| Ben Roethlisberger | PIT | 0.29 | 3.9% | 164 | 561 | 4251 |
| Derek Carr | OAK | 0.28 | 4.1% | 143 | 515 | 3496 |
| Dak Prescott | DAL | 0.28 | 4.1% | 135 | 490 | 3324 |
| Russell Wilson | SEA | 0.27 | 3.8% | 150 | 553 | 3983 |
| Aaron Rodgers | GNB | 0.26 | 3.7% | 62 | 238 | 1675 |
| Matthew Stafford | DET | 0.25 | 3.2% | 141 | 565 | 4446 |
| Philip Rivers | LAC | 0.22 | 2.8% | 126 | 575 | 4515 |
| Marcus Mariota | TEN | 0.21 | 2.9% | 93 | 453 | 3232 |
| Kirk Cousins | WAS | 0.20 | 2.6% | 108 | 540 | 4093 |
| Blake Bortles | JAX | 0.19 | 2.7% | 98 | 523 | 3687 |
| Case Keenum | MIN | 0.19 | 2.5% | 89 | 481 | 3547 |
| Josh McCown | NYJ | 0.16 | 2.2% | 65 | 397 | 2926 |
| Drew Brees | NOR | 0.15 | 1.8% | 79 | 536 | 4338 |
| Eli Manning | NYG | 0.15 | 2.4% | 83 | 571 | 3468 |
| Tom Brady | NWE | 0.14 | 1.8% | 84 | 581 | 4577 |
| Matt Ryan | ATL | 0.13 | 1.7% | 69 | 529 | 4095 |
| Jameis Winston | TAM | 0.12 | 1.5% | 54 | 442 | 3504 |
| Brett Hundley | GNB | 0.12 | 2.0% | 37 | 316 | 1836 |
| Joe Flacco | BAL | 0.11 | 1.9% | 60 | 549 | 3141 |
| Mitch Trubisky | CHI | 0.11 | 1.6% | 35 | 330 | 2193 |
| Cam Newton | CAR | 0.10 | 1.5% | 48 | 492 | 3302 |
| Jay Cutler | MIA | 0.07 | 1.2% | 32 | 429 | 2666 |
| DeShone Kizer | CLE | 0.07 | 1.2% | 34 | 476 | 2894 |
| Tyrod Taylor | BUF | 0.05 | 0.8% | 21 | 420 | 2799 |
| Carson Palmer | ARI | 0.04 | 0.6% | 11 | 266 | 1968 |
| Trevor Siemian | DEN | 0.01 | 0.2% | 4 | 349 | 2285 |
The top five QB’s by ANY/A were close neighbors, but things looks quite different if we subtract surplus yards. Brees and Brady only lose 0.15 and 0.14 ANY/A respectively, while Goff and Smith crater by 0.48 and 0.47. The ANY/A leaderboard adjusted for surplus yards looks like this:
1) Drew Brees 7.56
2) Tom Brady 7.42
3) Philip Rivers 7.38
4) Jared Goff 7.24
5) Alex Smith 7.18
Without their unsustainable long completions, Goff and Smith fall behind the elite trio at the top. As it should be.
References
| ↑1 | You may be wondering why I choose 40 yards as the cutoff for a “normal” play. After digging through years of play-by-play and running some correlations, 40 yards seems to be the inflection point where randomness takes over. The ability to complete passes in the 30-40 yard range is a repeatable skill, and is often the determining factor that separates the great QB’s from the average ones. But beyond 40 yards, the yardage picked up very long pass plays is almost entirely random from season to season. I calculated the surplus yards for all qualifying QB’s from 1994-2017, then compared all cases where a QB attempted 224+ passes in consecutive seasons. To avoid biasing the results by playing time, I converted the data into Surplus %, or the percentage of passing yards that came via surplus yards. Over a sample of 513 season pairs, the correlation of Year N to Year N+1 surplus % was a miniscule .04 with an R^2 of .002! |
|---|