≡ Menu

Week 3 (2019) Passing Stats: Kyler Murray Hits Rock Bottom

If you took a quick glance at the passing stats from week 3, you might not notice how bad number one overall pick Kyler Murray performed against the Panthers. You’d see that he threw for only 173 yards with 2 TDs and 2 INTs, and might think that it was a typical underwhelming performance by a rookie quarterback.

What you might not have noticed was that Murray had 43 pass attempts and also was sacked a whopping 8 times, losing 46 yards. He also only passed for 9 first downs, a pitiful number given his 51 passing plays (17.6%). Murray threw for just 127 net passing yards against Carolina, a shockingly-low 2.49 net yards per attempt average. In fact, no passer had averaged under 2.50 NY/A in a game with 40+ attempts since 2003.

Murray finished week 3 with a 1.51 ANY/A average, the second-worst performance in week 3 by any starting quarterback. The worst? Well, that honor belongs to Jets third string QB Luke Falk, who was basically useless against the Patriots. Falk had 27 passing plays on Sunday: 20 of them produced negative EPA, meaning they were a negative play, 3 were slightly positive plays (i.e., a 5-yard pass on 1st-and-10), and 4 picked up first downs. New York scored 14 points courtesy of a special teams touchdown and a defensive touchdown.

On the positive side of things, the top three passing stat lines belonged to Patrick Mahomes, Deshaun Watson, and Kyle Allen. The full week 3 passing stats below: [continue reading…]

{ 0 comments }

Super Bowl Teams And Passing Efficiency

Over the last two days, I have argued that the value of a top passing offense is lower than it used to be. One natural counter to that might be, hey Chase, haven’t you noticed that Tom Brady and the Patriots tend to always win the Super Bowl?

But that’s not exactly as convincing an argument as you might think. The Patriots won the Super Bowl in 2014, 2016, and 2018. And let’s be super clear about what I’m saying: I am not saying that quarterbacks are not critical, just that they are less critical than they used to be! From 1958 to 1979, the team that won the NFL championship or Super Bowl had a Hall of Fame quarterback in all but two of those seasons.

So yes, Tom Brady may be winning Super Bowls, but that’s hardly evidence that quarterbacks matter more than ever. Especially when you consider that Brady being at his best has borne little relation to whether or not the Patriots win the Super Bowl.

The graph below shows the Patriots passing offense in each season from 2001 to 2018, measured by New England’s Adjusted Net Yards per Attempt average minus league average ANY/A. Yes, New England has had an above-average passing offense each year. The team has won 6 Super Bowls, and those dots are in gold and black. [continue reading…]

{ 0 comments }

More Thoughts On The Value Of A Passing Offense

This is Part 2 to yesterday’s post about how value is determined. Please read that before proceeding.

Here’s a hypothetical situation to consider. In a few months, the NFL owners get together and decide that passing is too easy, scoring is too high, and offenses are too good. As a result, they have agreed upon a drastic rules change: starting in the 2020 season, NFL defenses will be allowed to put 12 players on the field, while NFL offenses will still be constrained to 11 players.

This will significantly change the NFL landscape, of course. Scoring is going to plummet. Passing efficiency is going to tank, and rushing with any sort of consistency is going to be impossible.

Now, here’s a question. You are the Kansas City Chiefs with Patrick Mahomes, who — for the sake of this argument — has just completed his second consecutive MVP season. He’s the clear best quarterback in the NFL, but he will now be playing in an NFL where passing is going to be much, much harder.

Does this rule change help or hurt your team’s chances of winning?

Think about it for a minute.

*****************************

I can wait.

***************************** [continue reading…]

{ 1 comment }

How Is Value Determined?

You are offered the opportunity to win some money by picking two marbles, one each out of two different bags. First, you get to dip your hand into a bag of six red marbles, with each marble worth a different dollar amount. The dollar amounts are $10, $20, $30, $40, $50, and $60. You will next get to dip your hand into a bag of six blue marbles, with the marbles worth $60, $64, $68, $72, $76, and $80.

Simple math will tell you that the average red marble is worth $35 and the average blue marble is worth $70; it’s clear which bag has the better marbles, and you can also expect to walk away with about $105 once this game is completed. Now, our benevolent contest operator says he will make your life even better. In one of the bags, he will discard the bottom three marbles: he will remove either the $10, $20, or $30 marbles from the red bag, or the $60, $64, or $68 marbles from the blue bag. This, of course, is great news. [continue reading…]

{ 0 comments }

2018 Surplus Yards, By Adam Steele

Adam Steele is back for another guest post. You can view all of Adam’s posts here. As always, we thank him for contributing.


Last year I introduced a metric called Surplus Yards to measure the percentage of yards a QB gains from long passing plays. If you haven’t read that post I strongly encourage you to do so before continuing.

Here is a table showing every 40+ yard completion from the 2018 regular season, listed from longest completion. As you can see, Ben Roethlisberger had a 97-yard completion, a 78-yard completion, two 75-yard completions, and so on. Roethlisberger had 15 completions last year of 40+ yards, second-most in the NFL: [continue reading…]

{ 0 comments }

1962 in Review: Comparing Starting QBs to 2018

In 1962, Eagles QB Sonny Jurgensen averaged 8.9 yards/attempt. In 2018, Eagles QB Carson Wentz averaged 7.7 yards per attempt.

In 1962, Packers QB Bart Starr averaged 8.6 yards/attempt. In 2018, Packers QB Aaron Rodgers averaged 7.4 yards per attempt.

In 1962, 36-year-old Giants QB Y.A. Tittle averaged 8.6 yards/attempt. In 2018, 37-year-old Giants QB Eli Manning averaged 7.5 yards/attempt.

In 1962, Redskins QB Norm Snead averaged 8.3 yards/attempt. In 2018, Washington QB Alex Smith averaged 6.6 yards/attempt.

And while those were the four best quarterbacks of 1962, a cherry-picked sample doesn’t explain the superiority of the ’62 passers.

  • Vikings QB Fran Tarkenton averaged 7.9 yards/attempt in ’62, besting ’18 successor Kirk Cousins and his 7.1 Y/A average.
  • Bears QB Billy Wade averaged 7.7 yards/attempt in ’62, while Chicago QB Mitchell Trubisky averaged 7.4 yards/attempt last year.
  • The Cardinals? Forget about any comparison here. In 1962, Charley Johnson averaged 7.9 yards/attempt, while 2018 Josh Rosen gained just 5.8 yards per attempt for the Cardinals.
  • In 1962, Dallas split its quarterback duties between Eddie LeBaron and Don Meredith. The 32-year-old LeBaron averaged 8.7 yards per attempt in 6 starts, while the 24-year-old Meredith averaged 7.9 yards per attempt in 8 starts; either way, both bested 2018 Dak Prescott, who averaged 7.4 yards per attempt for the Cowboys.

At this point, you’re probably thinking that I’m engaging in some form of misdirection about the 1962 season versus the 2018 season. I can assure you I am not. In 1962, Lions QB Milt Plum gained 7.3 yards per attempt; in ’18, Detroit QB Matthew Stafford averaged 6.8 yards per attempt. What about the Colts? Well, in 1962, John Unitas averaged 7.6 yards per attempt; that’s better than 2018 Andrew Luck, who gained 7.2 yards per pass attempt. In 1962, Cleveland QB Frank Ryan averaged 7.9 yards per attempt; in 2018, Cleveland QB Baker Mayfield averaged 7.7 yards per attempt.

There were 14 teams in the NFL in 1962, and all 14 teams are still around today (albeit with some relocation). Relative to the starting quarterbacks for those teams in 2018, 11 of the starting quarterbacks in 1962 averaged more yards per pass attempt than their 2018 successors. The three outliers were in Pittsburgh, San Francisco, and Los Angeles. In 1962, John Brodie averaged a very respectable 7.5 yards per attempt, but 2018 Nick Mullens averaged 8.3 yards per attempt. If you expected to read an article about how Nick Mullens helped save the 2018 NFL season from looking weak relative to 1962, you are a better prophet than me. In ’62, Steelers 36-year-old QB Bobby Layne averaged 7.2 yards per attempt; last year, Pittsburgh’s 36-year-old QB Ben Roethlisberger averaged 7.6 yards per attempt. And finally, the 1962 Los Angeles Rams were awful: Zeke Bratkowski averaged a league-low 7.0 yards per attempt, and the team went 1-12-1. Last year, Jared Goff of the Los Angeles Rams averaged 8.4 yards per attempt as he helped the team win the NFC. [continue reading…]

{ 0 comments }

One of my favorite articles was written back in 2012, and the idea began during my law school days.

One of my law school professors was very quirky, even by law school professor standards. His preferred examination method was multiple choice, but with a twist. After grading each exam, he would then divide the students into quarters based on their test score. He would then re-examine each question, and measure how the top quarter of students performed on each question relative to the bottom quarter. Any question that more bottom-quarter students answered correctly than top-quarter students would be thrown out, and the exam would be re-graded. As he delicately put out, ‘if the wrong students are getting the question right, and the right students are getting the question wrong, it’s a bad question.’

NFL passing records are falling for a variety of reasons these days, including rules changes and league policies that make the passing game more effective. But there’s another reason: for the first time in awhile, the right people are throwing the most passes in the league. And there’s no better example of that than Drew Brees. Since coming to the Saints in 2006, he’s ranked 1st or 2nd in pass attempts four times, and ranked in the top three in net yards per attempt four times. But even since ’06, we’ve seen the passing game evolve, as the best quarterbacks are now the most likely ones to finish near the top of the leaderboard in pass attempts. In 2010, Peyton Manning had his first 600-attempt season… when he threw 679 passes for the Colts. Tom Brady threw 611 passes last year for the 13-3 Patriots, making New England one of just three teams to threw 600 pass attempts and win 13 or more games in a season. The other two teams? The ’09 Colts and the ’11 Saints.

In this early 1970s, the best passing teams often didn’t throw very often. In 1972, the top four teams in ANY/A — the Dolphins, Redskins, Giants, and Jets — all ranked in the bottom half of the NFL in pass attempts. And as I wrote in a 2014 update, there is a way to measure whether the best passing teams in the NFL are also the most frequent passing teams:

[W]hen we say the average completion percentage in the NFL is 61.2%, this is generally assumed to reflect the fact that in 2013, there were 18,136 passes thrown in the NFL, and 11,102 of them were completed.

An alternative method of measuring completion percentage in the NFL is take the average completion percentage of each of the 32 teams. That number won’t be very different, but it won’t be identical, either. The difference, of course, is that this method places the same weight on each team’s passing attack when determining the league average. The former, more common method, means that the Cleveland Browns make up 3.755% of all NFL pass attempts and the San Francisco 49ers are responsible for only 2.299% of the league-average passing numbers. The latter method puts all teams at 3.125% of NFL average.

Believe it or not, that background presents an interesting way to look at how the NFL has become more of a passing league.

For example, let’s look at the 1972 season. Miami led the NFL in points scored and in rushing attempts, while ranking 24th out of 26 teams in pass attempts. Does this mean the Dolphins weren’t a good passing team? Of course not; in fact, Miami had the highest Adjusted Net Yards per Attempt average of any team that season! That year, only two teams threw over 400 passes: New England and New Orleans. And both teams were below-average in ANY/A, with the Patriots ranking in the bottom three.

In 1972, the average pass in the NFL gained 4.28 Adjusted Net Yards. But an average of each team’s ANY/A average was 4.34, because good passing teams like Miami and Washington passed less frequently than bad passing teams like New England and New Orleans. The league-wide average was only 98.5% of the “average of the averages” average; whenever that number is less than 100%, we can conclude that the better passing teams are passing less frequently.

The graph below shows the passing data for the 32 teams in the NFL in 2018. The X-Axis shows each team’s Adjusted Net Yards per Attempt average; the Y-Axis shows each team’s number of dropbacks (pass attempts plus sacks). In a league where the teams with the best quality of passing attacks also have the most quantity of pass plays, the data will generally fit a line that slopes up and to the right. That’s not quite the case here, but there is a positive relationship between the two variables. Yes, the Saints were very efficient but didn’t pass very often, but the Chiefs led the NFL in ANY/A and were 12th in passing dropbacks, while the Falcons were 3rd in ANY/A and 5th in dropbacks. And the bottom three teams in dropbacks — the Jets, Bills, and Cardinals — all ranked in the bottom 10 in ANY/A.

In 2018, the NFL as a league averaged 6.32 ANY/A. However, if you average the ANY/A averages of each of the 32 teams, you get an average of 6.29. This means the average ANY/A was equal to 100.5% of the “average of the averages” ANY/A; that result only exceeds 100% when the better passing teams pass more frequently than the weaker passing teams. Twenty years earlier, in 1998, the league as a whole averaged 5.31 ANY/A, but an average of each team’s ANY/A would give you a result of 5.34. That’s because by assigning the same weight to each passing offense, you would have a higher result in 1998 than if you weighted efficiency by pass attempts because in 1998, weaker passing teams passed more often than stronger passing teams.

The graph below shows the relationship between these two variables. In short, it shows for each season since 1970, the league-wide ANY/A average divided by the ANY/A average for each of the teams in the league that year. A result of more than 100% means the better passing teams passed more often than the weaker passing teams.

Pretty neat, right? And at least in 2018, the better passing teams passed more often than the weaker passing teams.

{ 1 comment }

Yesterday, I looked at the era-adjusted leaders in completion percentage. Today, we’ll do the same thing but with yards per attempt.

The traditional passer rating formula measures Y/A by taking a passer’s Y/A, subtracting 3.0, and dividing the result by four. This makes sense when the average Y/A is around 7.0; in that case, 7.0 minus 3.0 equals 4.0, and dividing that by 4 gives a result of 1.00. But when the average passer isn’t averaging 7.0 yards per attempt, this formula isn’t so great. The graph below shows the average Y/A for all passers since 1932:

[continue reading…]

{ 0 comments }

Two years ago, I wrote a 6-part series describing how to adjust passer rating for era. I posted the career results in Part V, and the whole series is background reading for anyone who wants to learn how to adjust passer rating for era.

Last year, I updated those numbers based on the 2017 results. Earlier this year, I posted the 2018 single-season results, and today, I am going to update the career ratings.

Here’s how to read the table below. Otto Graham threw 2,626 passes, and played from 1946 to 1955. His actual passer rating was 86.6, but his era adjusted passer rating was 95.2, the best in pro football history. The final column shows whether a player is in the Hall of Fame, is a HOF lock (attributed to five players), is not in the Hall of Fame, or has never been eligible for the HOF. [continue reading…]

{ 1 comment }

Matt Stafford (And Other Passers) Through Age 30

A few days ago, I noted that Falcons wide receiver Julio Jones turned 30 years old on February 3, 2019, and he held the record for receiving yards through age 29.   Well, on February 7, 2019, Lions quarterback Matt Stafford turned 31 years old.  The two former SEC stars played each other once, in 2008, but that was it: Stafford entered the league in 2009 at the age of 21, while Jones waited until he was 22 years old and entered the 2011 draft. But both have been very productive in the NFL: Stafford is now the record-holder in passing yards through age 30.

Is Stafford in play to set the all-time record in passing yards? It’s tough to say, but I’d argue that he’s got a better chance than Jones, just because of the way age seems to impact quarterbacks in modern times relative to wide receivers.  This graph shows how many career passing yards, at each age X, each of Stafford, Peyton Manning, Brett Favre, Tom Brady, Drew Brees had: [continue reading…]

{ 0 comments }

2018 Era-Adjusted Passer Ratings

Two years ago, I wrote a six-part series on adjusting passer ratings for era.

Last year, after the 2017 regular season ended, I posted the single-season results and also updated the career ratings. Today is the 2018 update.

Passer rating is made up of four variables: completion percentage, yards per attempt, touchdown percentage, and interception percentage. The reason passer rating needs to be adjusted for era? Well, that’s pretty simple to explain.

When the formula was derived in the early ’70s, an average rating in each variable was achieved with a 50% completion rate, averaging 7.0 yards per pass attempt, a 5% touchdown rate, and a 5.5% interception rate.  Since those numbers are wildly out of date, I came up with a formula that perfectly matches the intent of passer rating but ties the variables to the league average in any given season. You can get the formulas and read more background in the linked posts.

In 2018, the four averages were 64.9%, 7.37, 4.79%, and 2.37%. The big changes, of course, are in completion percentage and interception rate; yards per attempt is much more stable throughout history (although 2018 was higher than in recent years), while touchdown rate is actually slightly lower than it was in the ’70s.

One thing to keep in mind: these adjustments will not change the order of passer ratings in a given season. So Drew Brees, Patrick Mahomes, Russell Wilson, Matt Ryan, Philip Rivers will remain your top 5 leaders; the way the formula works, it simply subtracts a fixed amount from each passer’s actual passer rating. In 2018, that amount was an enormous 26.3 points from each passer. [continue reading…]

{ 1 comment }

Let’s start with the obvious: Patrick Mahomes was never bad.  He had 7 games this season where he averaged at least 10.0 AY/A, 11 games where he averaged at least 9.0 AY/A, and 15 games where he averaged at least 7.0 AY/A.  His worst statistical game of the season came against a good Jaguars defense in a game that got out of hand in Kansas City’s favor early.

The Chiefs also became the first team in history to score at least 26 points in every game; the 1998 Minnesota Vikings had been the previous champion in this category, having scored at least 24 points in every game.

Mahomes finished with 50 touchdown passes, 11 more than every other quarterback in the league. He averaged 8.13 Net Yards per Pass Attempt, a half-yard better than every other full-time starter in the league (Ryan Fitzpatrick has a way of mucking up these stats), and threw for over 5,000 passing yards.  Mahomes led the league with a remarkable 8.89 ANY/A average, the 6th best in modern history.

The table below shows the final passing leaders for the 33 quarterbacks who threw enough pass attempts to qualify for the passing crown. That’s all 32 teams plus both quarterbacks for Tampa Bay. The league average ANY/A this season was a remarkable 6.32, which tops 2015 (6.26) for the most efficient passing season in NFL history. Mahomes, with an 8.89 AY/A average over 606 dropbacks, meaning he provided 1,554 Adjusted Net Yards of value over average. That easily led the league: [continue reading…]

{ 0 comments }

Week 16 Passing Stats: Late Season Nick Foles Is Back

Late season Nick Foles is back! The Eagles backup quarterback — and 2018 postseason hero — was your top passer in week 16. Foles set a franchise record with 471 passing yards, and averaged 9.94 ANY/A on 50 dropbacks.

The second-best quarterback of the week also wears green: it was Jets rookie Sam Darnold, who has been very good since returning from a foot injury. He threw for over 300 yards and 3 TDs in a losing effort against the Packers.

On the other side, Panthers fans don’t have to worry about a quarterback controversy. Backup Taylor Heinicke led the Panthers on a 14-play, 73 yard opening drive for a touchdown, but the team’s final 10 drives ended with 3 punts, 3 interceptions, 2 turnovers on down, 1 fumble, and 1 field goal. He finished with a 2.58 ANY/A on 55 dropbacks. More notably, Philip Rivers had one of the worst games of his career, gaining just 1.39 ANY/A on 41 dropbacks against the Ravens. [continue reading…]

{ 0 comments }

For purposes of grading each team’s passing attack in each season since 2002, let’s look at where each team ranked in Adjusted Net Yards per Attempt. Next, let’s group teams into 5 buckets of four teams each based on the following ranks:

— Best passing offenses — i.e., the teams that rank 1, 2, 3, and 4 in ANY/A
— Good passing offenses — those teams that rank 8, 9, 10, and 11
— Average passing offenses — teams that rank 15, 16, 17, and 18
— Bad passing offenses — teams that rank 22, 23, 24, and 25
— Worst passing offenses — teams that rank 29, 30, 31, and 32

I went ahead and calculated the ANY/A of those teams for each season since 2002. In the graph below, I’ve plotted the results, taking the average ANY/A of those teams.

The most remarkable part of this: in 2018, the teams that rank 22nd, 23rd, 24th, and 25th in pass efficiency have an average ANY/A of 5.86. In 2002 and 2003, the teams that ranked 8th, 9th, 10th, and 11th in ANY/A had average ANY/A of 5.82 (’02) and 5.84 (’03). Those same teams are at 7.17 this year.

What stands out to you?

{ 0 comments }

Which teams are throwing the most to one receiver? Which teams are spreading it around the most? A good way to answer that is by using a Concentration Index. Let’s use Andrew Luck and the Indianapolis Colts as an example. Eric Ebron is the team’s leading receiver with 326 receiving yards, which represents 18.2% of the team’s total 1,796 receiving yards. To calculate a team’s concentration index in receiving yards, you need to square the percentage of receiving yards by each player, and sum the results. For example, 18.2% squared is 3.3%; do that for every player on Indianapolis and the total is 12.6%.

As it turns out, that’s the most diverse passing attack in the NFL. The most concentrated passing attack? That’s in Detroit:

The table below shows the concentration index for each team through six weeks, along with each team’s passing efficiency (as measured by ANY/A). Here’s how you read the top line. Detroit has the highest concentration index. The Lions have 1,404 receiving yards and have averaged 6.17 ANY/A, which ranks 20th in the NFL. Tate is the team’s leading receiver with 31% of the Lions receiving yards, and the team has a concentration index of 23%. [continue reading…]

{ 1 comment }

Completion percentages continue to skyrocket, and part of the reason for the increase is the rise of low value completions. As a result, the best way to measure the consistency of a passing game isn’t with completion percentage, but with passing first down percentage. That’s defined as simply:

Passing First Downs / (Pass Attempts + Sacks)

As noted last week, the Giants and Texans provided good real world examples for 2018. Through four weeks, Houston ranked 25th in completion percentage but 8th in passing first down percentage. Meanwhile, the Giants ranked 2nd in completion percentage but 22nd in passing first down percentage. My proposition is that passing first down percentage is a better reflection of the passing game and a more meaningful statistic than completion percentage; and that’s why, through four weeks, Houston ranked 15th in points/game, while the Giants ranked 29th.

But does that argument hold up over time? How do we *know* that Passing 1st Down Rate is more important than Completion Percentage? Here’s a simply study I did.

1) Calculate the completion percentage relative to league average for every team since 1970.

2) Calculate the passing first down percentage relative to league average for every team since 1970.

3) Identify teams that ranked two percentage points better than league average in one metric and two percentage points worse than league average in the other metric.

4) Compare those teams. [continue reading…]

{ 1 comment }

Some Thoughts On Interceptions

On Thursday night, Sam Darnold had an ugly performance against the Browns in a 21-17 loss. Darnold completed 15 of 31 passes for 169 yards, with no touchdowns and two interceptions (he also took two sacks). Now, if you didn’t watch the game, you might think Darnold’s two interceptions were the worst part of his game, or the main reason the Jets lost. But that’s not true: Darnold two picks came on his final three passes of the game. With 90 seconds left, the Jets trailed 21-17 with the ball at their own 37-yard line. Darnold was 14 of 28 for 144 yards with no interceptions and two sacks — a still terrible stat line that translated to an average of just 4.5 Net Yards/Attempt.

Yes, Darnold’s interception on the next play cost the Jets a chance to complete a comeback (and his second interception was close to meaningless from a win probability perspective), but the main reason the Jets lost was the ugly play over the first 58:30, not the last 1:30.

Not all interceptions are created equally, and Browns fans know this well. In the season opener, Cleveland had the ball at the Steelers 43 with 23 seconds left in the game. It was tied 21-21, and the Browns had 1st-and-10. The Browns had a great chance of winning, but Tyrod Taylor threw an interception on the next pass, ending Cleveland’s chances of winning the game in regulation.

The next week, Cleveland led New Orleans 12-10 with 5 minutes left in the 4th quarter. The Browns had somewhere between a 3-in-5 and 2-in-3 chance of winning the game at this point, facing 2nd-and-4 from the Cleveland 30-yard line. A moment later, Taylor threw an interception, and now the Saints had a 60-66% chance of winning the game. One could argue that Taylor has thrown the two most impactful interceptions of the season thus far.

The best way to analyze the impact of interceptions is through win probability. But that’s not always easy to understand or readily available, so let’s use some quick workarounds. If nothing else, the analysis here should help provide some context around interceptions.

I looked at all passes that were intercepted over the prior three seasons. [continue reading…]

{ 1 comment }

Pass Efficiency By Pass Direction

Thanks to the always wonderful PFR Play Index, it’s easy to analyze NFL pass plays by direction. The official play-by-play logs released on behalf of the league label all passes as either short (less than 15 yards from the line of scrimmage) or deep, and either left, middle, or right.

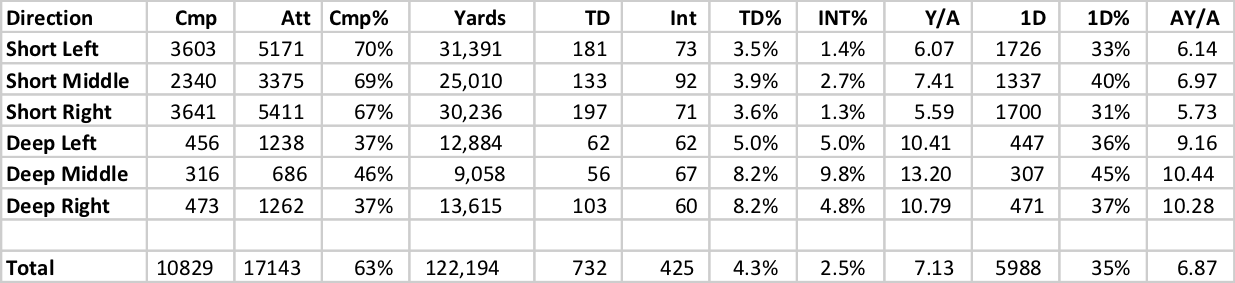
The table below shows the results of passes last year in those six directions, along with the totals:

A few things stand out. NFL teams have a slight preference for throwing right rather than throwing left, which likely reflects (or is a cause of!) the fact that every quarterback in the NFL is now exclusively righthanded. The effect is not large, but there are slightly more short passes to the right than the left.

Another is that passes in the middle of the field seem very good, but with two big caveats. On short passes, teams averaged 7.41 Y/A and pick up a first down on 40% of all throws; meanwhile, teams averaged 5.93 Y/A and a 32% first down rate on short throws to the left or right. That makes passes to the short middle appear about 20% more efficient than passes that are thrown short and outside. And on deep throws, the completion percentage is significantly higher on throws in the middle of the field (46% vs. 37%), with higher first down rates (duh) and AY/A averages, too.

Ah, but the caveats. One is that throws in the middle of the field are less safe, almost certainly due to the heavy congestion. The interception rate was twice as high on short throws last season as it was on short throws to the outside, and it was also twice as high on deep middle throws relative to passes deep and to the outside. Throwing in the middle of the field is riskier, but it appears to have a higher reward.

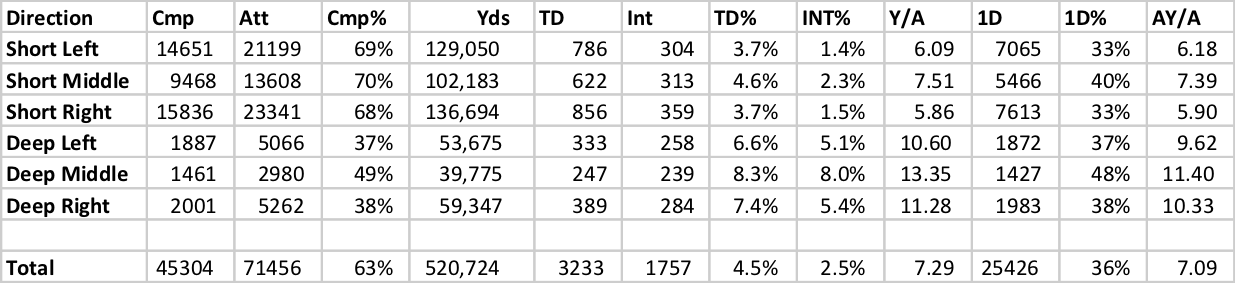
We’ll get to the other caveat in a minute, but first, let’s look at passes from 2013 to 2016, again using the PFR Game Play Finder.

We see similar results here. The NFL still looks like a right-handed league, with just a few more passes coming to the right than the left. On short passes, the interception rate is much higher on passes to the middle of the field, but the Y/A and first down rates are also way higher. In fact, both AY/A and first down rates were 22% higher on passes short and to the middle relative to short and outside. On deep throws, completion percentage was significantly higher on throws in the middle of the field, as was the touchdown rate, first down rate, and well, the interception rate.

But the elephant in the room in this analysis isn’t that passes thrown in the middle of the field are more effective than passes thrown to the outside. Perhaps the most important data point in these tables isn’t even given its own column, but savvy readers likely picked up on it. On short passes, just under 25% of them (in both 2017 and 2013-2016) were thrown to the middle of the field; on deep passes, 22% of throws (2017 and 2013-2016) were to the middle of the field. Meanwhile, passes to the right (short/deep/2017/2013-2016) approach 40% in all cases.

This means we are not necessarily comparing apples to oranges. There is a likely survivorship bias going on here. I don’t have data on time from snap to throw, which would supplement (and make more interesting!) today’s analysis, but it seems likely that passes to the middle of the field happen quicker. In other words, a quarterback is much more likely to do this:

Read 1 is to middle of the field —–> player covered —-> Read 2 –> throw to outside

Than to do to this

Read 1 is to outside of the field —–> player covered —-> Read 2 –> throw to middle of field

If your first option is covered, that play’s overall success rate is likely going down. A “backup” plan is to throw to the outside, which would explain why passes to the outside are both greater in number and lower in efficiency.

And let’s not forget that targets themselves — or pass attempts, in this case — are also measures of quality.  The fact that teams throw to the outside more is evidence (not conclusive, of course, but evidence nonetheless) that throwing to the outside more is better.  Let’s consider the 2017 Eagles, with Alshon Jeffery and Torrey Smith (who spent most of their time on the outside) and the team’s slot receiver, Nelson Agholor, who had been heavily criticized much of his career.   Agholor averaged 8.08 yards per target last year on 95 targets, while Jeffrey (6.58) and Smith (6.42) were much worse on 120 and 67 targets, respectively.

Let’s look just at short passes for the Eagles last year.  Philadelphia quarterbacks had a 96.5 passer rating and picked up a first down on 31.5% of passes that were short and to the outside; meanwhile, those same players had a 119.6 passer rating and picked up a first down on 47.8% of passes that were short and in the middle of the field.

But for Philadelphia, short throws to the middle of the field comprised only 21% of all short throws.  Perhaps, just like with Agholor, Philadelphia only threw to the middle of the field when the middle was open, and threw short no matter what (and if everyone was covered, a check down to the running back in the flat may be more likely to be charted as an outside pass).

It’s easy to look at efficiency numbers and conclude that teams should be doing more of what’s most efficient. But that only works when we’re comparing the same sort of data, and it’s not clear that we can do that just yet.

{ 1 comment }

Yesterday, I looked at Norm Van Brocklin and how he set the single-game passing record with 554 passing yards.  This was done way back in 1951, in a game against the New York Yanks.  In that post, I noted that big passing games in Van Brocklin’s era tended to come against bad teams in blowouts, while big passing games now come in more competitive games. Let’s investigate that a bit more today.

In the 1950s, there were 10 games where a team threw for at least 400 gross passing yards (that is, without deducting sack yards). In those games, the average team threw for 444.5 yards, while the opponent had just 159.3 passing yards. And the 400-yard passing team led by, on average, 5.4 points, 13.3 points, 24.6 points, and 26.6 points after each quarter.

In other words, those were one-sided affairs where the winning team was able to name its score (and number of passing yards).  Van Brocklin’s game against the Yanks is a good example; in modern times, this is much less common, with the Patriots/Titans snow game from 2009 being an outlier (New England passed for 442 yards, while Tennessee had negative passing yards even without including sacks!).

Let’s compare that to the 2010s. There have been 126 passing games of 400+ yards, with an average of 436.6 passing yards. On average, the opponents in those games had a 300-yard game — 306.9 passing yards, to be exact. And the games were almost always close, with the margin being within 2 points at the end of each quarter (in fact, it was negative for the big passing team). [continue reading…]

{ 1 comment }

Super Bowl LII. Nine seconds left, New England down by eight. Tom Brady had already thrown for 505 yards, but the Patriots still needed another 51 yards from him to have a chance to extend the game. Brady launches a prayer to Rob Gronkowski, who …

… nearly comes down with it in the end zone. Had the Hail Mary been completed, Brady would have thrown for 556 yards, setting a new single-game passing yardage record. The current record, as trivia experts know, is 554 passing yards, set by Norm Van Brocklin way back in 1951.

Eight years ago, I first wrote about how Van Brocklin held the record for most passing yards in a single game. I’ll be reprinting and updating that post today.

Let’s begin with the obvious: Van Brocklin is a Hall of Famer and all-time great quarterback who, at his very best, produced some of the most efficient and valuable seasons in NFL history. He should be on most top-20 quarterback lists, and his net yards per pass attempt — one of the most basic but important measures of quarterback play — is the best of all time.

On the other hand, he set the record in 1951.  How the heck did that happen?  Below, I have plotted all games where a team has passed for at least 450 gross yards (that is, without deduction for sacks).  As you can see, the dot at (1951, 554) is a pretty large outlier: [continue reading…]

{ 1 comment }

Yesterday, I looked at a larger percentage of touchdown passes are coming from shorter distances. While longer touchdown throws used to rule the day, about two-thirds of all touchdown passes now come from inside the red zone.

The average touchdown pass was, at one point, north of 30 yards. Now? It’s south of 20 yards:

Three years ago, I wrote about the average length of touchdown pass. Let’s update that post today, using all quarterbacks who either threw 100+ career touchdown passes or threw a touchdown pass in 2017 and have at least 20 career touchdown passes.  Ed Brown is your career leader, although if we raise the limit to 125 touchdowns, Norm Van Brocklin would still be your career leader: [continue reading…]

{ 0 comments }

Back in June, I wrote about how the average length of touchdown passes was declining significantly. I wanted to revisit that post with a graph that really highlights the change in the type of touchdown passes thrown over time. The graph below shows, for each season from 1950 to 2017, the percentage of touchdown passes each year that were:

  • At least 50+ yards, plotted in dark red;
  • 30-49 yards, plotted in in red;
  • 20-29 yards, plotted in gray;
  • 10-19 yards, plotted in light blue;
  • Inside of 9 yards, plotted in dark blue.

The overall trend is obvious: while in the ’60s, fewer than 25% of touchdown passes came from inside of 9 yards, in modern times, well over 40% of touchdown passes come from that range. On a raw basis, as recently as 1975, there were more touchdown passes from 30+ yards (85 from 30-49, 44 from 50+) than from 9 yards and in (128).  Last season, there were 314 touchdown passes from the 9 yard line or closer, and 157 from 30+ (76 from 31-49, 71 from 50+).

What’s really notable is that while passing touchdowns are on the rise, that is entirely a function of short touchdowns. There are 32 teams and 16 games per season, providing for 512 team games in modern times. In the graph below, the dark red line shows the number of passing touchdowns in each season per 512 team games. The high-water mark was 2015, when there were 842 passing touchdowns, and therefore 842 passing touchdowns per 512 team games. But the dark blue line shows the number of passing touchdowns per 512 team games but excluding all touchdown passes inside of 9 yards.  That number has been relatively constant across NFL history (well, at least since the merger), but if anything, the trend (both shot-term since 2015, and long-term) is negative for gross passing touchdowns once you eliminate the shortest throws.

Pretty interesting, eh?

{ 0 comments }

The 1991 Eagles had a very bad passing offense. Philadelphia was one of four teams to finish with an ANY/A below 4.00, wasting a legendary defense along the way. You may have already known that, but here’s something you may not have known: Jim McMahon was Philadelphia’s starting quarterback that season, and he had a good season, ranking 12th in ANY/A and 13th in passer rating.

So yes, Philadelphia’s starting quarterback was an above-average passer despite Philadelphia’s passing attack being terrible. How did that happen? Well, it’s pretty simple: McMahon was responsible for 61% of the Eagles pass attempts that year, but also 66% of the team’s completions, 71% of the passing yards, 71% of the passing touchdowns, and only 47% of the sacks and just 41% of the interceptions. McMahon averaged 5.59 ANY/A; the rest of the Eagles passers averaged 0.77 ANY/A! That’s not a typo:

 
No. Player Age Pos G GS QBrec Cmp Att Cmp% Yds TD TD% Int Int% Y/A Y/C Y/G Rate Sk Yds NY/A ANY/A Sk% 4QC GWD
9 Jim McMahon 32 QB 12 11 8-3-0 187 311 60.1 2239 12 3.9 11 3.5 7.2 12.0 186.6 80.3 21 128 6.36 5.59 6.3 1 2
16 Jeff Kemp 32 qb 7 2 1-1-0 57 114 50.0 546 5 4.4 5 4.4 4.8 9.6 78.0 60.1 12 61 3.85 2.86 9.5 2 2
8 Brad Goebel 24 qb 5 2 0-2-0 30 56 53.6 267 0 0.0 6 10.7 4.8 8.9 53.4 27.0 6 37 3.71 -0.65 9.7
10 Pat Ryan 36 4 0 10 26 38.5 98 0 0.0 4 15.4 3.8 9.8 24.5 10.3 4 21 2.57 -3.43 13.3
12 Randall Cunningham 28 qb 1 1 1-0-0 1 4 25.0 19 0 0.0 0 0.0 4.8 19.0 19.0 46.9 2 16 0.50 0.50 33.3
41 Keith Byars 28 FB 16 16 0 2 0.0 0 0 0.0 1 50.0 0.0 0.0 0.0 0 0 0.00 -22.50 0.0
Team Total 27.2 16 10-6-0 285 513 55.6 3169 17 3.3 27 5.3 6.2 11.1 198.1 63.2 45 263 5.21 3.64 8.1 3 4

Thought of another way, non-McMahon passers had 226 dropbacks.  Using McMahon’s average of 5.59 ANY/A, we would “expect” McMahon to have produced 1,263 Adjusted Net Yards on those dropbacks.  In reality, other Eagles passers produced just 175 Adjusted Net Yards on those dropbacks, in large part due to 16 interceptions on 202 pass attempts.  This means McMahon “would have” produced 1,088 more Adjusted Net Yards than his backups.

That’s… a lot.  In fact, it’s the second-most in history using the following methodology:

  • 1) Calculate the ANY/A for each passer on each team.  So for 1991 McMahon, it’s 5.59.
  • 2) Calculate the ANY/A for the rest of that team’s passers for each passer.  For 1991 McMahon, it’s 0.77.
  • 3) Subtract the result in step 2 from the number in step 1. This leaves us with 4.82 in the case of ’91 McMahon.
  • 4) Multiply the result in step 3 by the smaller number of (a) that passer’s number of dropbacks and (b) the total number of dropbacks by the rest of the team.  In ’91 McMahon’s case, we use (b), which is 226, to get a result of 1,088.

The biggest difference in NFL history wasn’t McMahon, but Dan Fouts on the 1983 Chargers.   He averaged 7.32 ANY/A and threw 347 passes.  His backup, Ed Luther, averaged 3.77 ANY/A and threw 287 passes.  Fouts threw 20 TDs and 15 INTs, while Luther had 7 TDs and 17 INTs!  Non-Fouts passers in 1983 on San Diego had 308 dropbacks and averaged 3.66 ANY/A, exactly half of Fouts’ average!  Therefore, Fouts had 1,130 Adjusted Net Yards above expectation that season.

Three players from 2017 make the top 75 using this methodology, and my hunch is you could guess them pretty easily.  Then again, this formula isn’t supposed to shock you: it’s just a way of measuring which teams had a really good passer play about half a season, and really bad passers the rest of the season.

RkPlayerYearTeamANY/AOth ANY/ADiffDBOth DBValue
1Dan Fouts1983SDG7.323.663.673543081130
2Jim McMahon1991PHI5.590.774.823322261088
3Jesse Freitas1948CHR5.9-0.146.041671741009
4Joe Ferguson1976BUF7.040.996.05162254980
5Dave Krieg1988SEA6.872.884240225899
6Marc Bulger2002STL7.673.73.97226455897
7Tom Flores1966OAK8.131.996.14306144884
8Aaron Rodgers2013GNB85.132.87311304874
9Dave Smukler1936PHI1.99-10.7112.6968102863
10Donovan McNabb2005PHI6.143.123.02376285861
11Damon Huard2006KAN7.493.783.71260231857
12Bill Nelsen1966PIT10.873.567.3112289818
13John Friesz1996SEA6.873.273.6223309803
14Bill Kenney1987KAN6.241.914.33295185802
15Jake Plummer2003DEN6.632.374.26316188801
16Earl Morrall1959DET6.80.965.84137191800
17Jay Cutler2011CHI6.251.984.27337185790
18Seneca Wallace2008SEA6.0233.02256254768
19Nick Foles2013PHI9.185.633.55345209742
20Vinny Testaverde1995CLE6.572.44.16409178741
21Tony Banks1999BAL5.462.482.97353249741
22Frank Filchock1939WAS11.223.098.1489112724
23Dave Krieg1994DET7.414.243.17226259716
24Earl Morrall1963DET7.53-1.599.1232878712
25Bob Celeri1951NYY5.721.983.74238190710
26Neil O'Donnell1995PIT6.662.833.83431185708
27Dick Shiner1969PIT4.10.783.32233210697
28Pat Haden1981RAM4.011.013295232696
29Phil Simms1987NYG6.123.262.86317243695
30Deshaun Watson2017HOU7.194.133.06223356682
31Boomer Esiason1997CIN8.324.833.48193357672
32Bill Kenney1984KAN5.953.722.23300326669
33Warren Moon1988HOU7.152.64.55306146664
34Tim Couch2000CLE5.072.112.95225298664
35Jim McMahon1984CHI7.633.34.34153273664
36Ace Parker1946NYY6.851.085.77115159664
37Erik Kramer1997CHI50.164.84502136659
38Doug Williams1978TAM4.411.183.22200213644
39Bobby Thomason1955PHI7.153.383.77171229644
40Jeff Blake1994CIN5.873.422.46325261641
41Scott Hunter1977ATL4.410.463.95162175640
42Billy Kilmer1968NOR5.06-0.095.15315124639
43Craig Morton1970DAL7.221.395.83227109636
44Marc Bulger2005STL6.344.312.03313332634
45Jug Girard1949GNB2.41-2.75.11175124633
46Dutch Clark1936DET3.9-4.998.897175631
47Case Keenum2016LAR5.062.442.62345240630
48Mike Pagel1984IND4.271.542.73240229626
49Norm Van Brocklin1952RAM6.11.065.04205124625
50Derek Anderson2008CLE4.541.642.9297215624
51Tom Flores1960OAK5.712.772.93252211619
52Jay Schroeder1985WAS5.442.682.76224340619
53Tommy Kramer1984MIN4.862.52.35260337612
54Vinny Testaverde1993CLE6.363.892.47247276611
55Lynn Dickey1984GNB60.735.26433115605
56Marc Bulger2009STL4.652.352.3261326600
57Aaron Rodgers2017GNB5.993.682.31260353599
58Rodney Peete2002CAR5.12-1.086.241296595
59Bill Nelsen1965PIT4.86-2.197.0527084592
60Bill Kenney1985KAN6.143.023.12366188587
61Craig Morton1980DEN4.941.753.18327183583
62Charlie Batch2001DET5.123.191.93374301582
63Billy Joe Tolliver1998NOR6.283.522.76210382580
64Jeff Garcia1999SFO5.552.722.83390203574
65Sammy Baugh1949WAS6.42.294.12255139572
66Josh McCown2015CLE6.454.641.81315347570
67Frank Reich1996NYJ4.93.151.75345325569
68Jim McMahon1987CHI5.963.522.44232309567
69Jim Kelly1987BUF5.480.215.27446107564
70Jimmy Garoppolo2017SFO7.624.593.03186464563
71Michael Vick2010PHI7.294.522.76406204563
72Bob Snyder1938RAM4.21-2.236.4487158560
73Sammy Baugh1945WAS9.39-2.7412.1318246558
74Steve Pelluer1988DAL5.511.354.16456134557
75Matt Moore2009CAR7.113.343.76147351553
{ 0 comments }

On Tuesday, I looked at the best passing seasons in NFL history. On Thursday, I looked at the worst passing seasons in NFL history, but by measuring quarterbacks against average.  There are “problems” with that to the extent there are ever problems with anything presented as trivia, and Adam suggested a fix in the comments: use 75% of league average as replacement level, and compare the worst passers to replacement level rather than average.

Let’s look at Bobby Hoying in 1998. He was horrible that year: he averaged a league-worst 1.43 ANY/A, even worse than the dread 1.93 ANY/A by a rookie Ryan Leaf. In fact, since 1979, Hoying/Leaf ’98 (not to be confused with Sosa/McGwire ’98) are the only two players to average less than 2.0 ANY/A on 200+ pass attempts in a season. That is not likely to be seriously challenged anytime soon: JaMarcus Russell, who averaged 2.31 ANY/A in 2009, is the closest since.

How bad was Hoying that year? He threw a record 224 pass attempts without a touchdown, also unlikely to be seriously challenged ever again.  The league average ANY/A that year was 5.31, and Hoying had 259 dropbacks.  As a result of being  3.88 ANY/A below average, he produced -1,004 yards of value over average, as noted last week.  That was the 10th-worst season of all time.

If we use replacement level, then Hoying gets compared to 75% of 5.31 ANY/A, or 3.98 ANY/A, which gives him -660 yards below replacement.  That’s actually the lowest of any season in NFL history, although if you pro-rated older seasons, it drops down to 15th. The worst season by this method comes from Cardinals quarterback Ronnie Cahill in 1943. Cahill was a star running back at Holy Cross, and he played exactly how you would expect a running back at Holy Cross would play quarterback in the NFL. He threw 3 TDs against 21 INTs, had a passer rating of 33.5, and averaged -2.5 AY/A. He had the second-worst season against league average, and jumps to the lowest season once we pro-rated for the fact that 1943 was a 10-game season. This means the war-ravaged ’43 season produced the best and worst passing seasons in NFL history. [continue reading…]

{ 0 comments }

On Tuesday, I looked at the best passing seasons in NFL history. What about the reverse? Blake Bortles had one of the worst seasons in 2014 in NFL history, in terms of quality combined with quantity.  There are a lot of bad seasons, but what makes that Bortles year stand out was that he played nearly the full season.  This was his rookie year, and Bortles started 13 games; he averaged 3.81 ANY/A when the league average was 6.14 ANY/A.  Bortles therefore produced -1,234 Adjusted Net Yards of Value above average, since he had 530 dropbacks.  That’s actually the worst in NFL history, which isn’t too surprising; most of the bad years with a large number of dropbacks came in recent history.

The table below shows the 500 “worst” seasons in passing history in terms of Adjusted Net Yards of Value below average. Note that the 500th-worst passing season (pro-rated, as on Tuesday) is -365. This means that a season that is 0.70 ANY/A below average on 550 attempts will make this list. That’s not a really bad season, of course. So just a reminder when you view these lists that quantity is a key component here: [continue reading…]

{ 0 comments }

In 1984, Dan Marino averaged 8.94 Adjusted Net Yards per Attempt (ANY/A, defined as passing yards + 20*Pass TDs – 45*INTs – sack yards, all divided by pass attempts plus sacks) while the league average was 5.00 ANY/A.   Marino had 577 dropbacks (pass attempts plus sacks), so he had 3.94 ANY/A over average over 577 dropbacks; that means he provided 2,271 Adjusted Net Yards of Value over average.

In 2004, Peyton Manning averaged 9.78 ANY/A while the league average was 5.63 ANY/A. Manning had 510 dropbacks, so he is credited with 2,113 yards of Value that season.  This was Manning’s best year: even better than what he did in 2013, when averaged 8.87 ANY/A, the league average was 5.87, and Manning had a whopping 677 dropbacks. So he had 2,031 yards of Value that season.

The table below shows the top 500 passing seasons by this metric. For non-16 game seasons, the final column (ProRt value) prorates the value as if it was a 16-game season.For AFL seasons 1960 to 1964, in the pro-rated column, I assigned only 50% credit in 1960, 60% in ’61, 70% in ’62, 80% in ’63, 90% in ’64, and then full credit in the remaining seasons. I also assigned full credit for all AAFC seasons. [continue reading…]

{ 1 comment }

A couple of months ago, I asked this question on Twitter:

Do you know the answer? I’ll give you a couple of moments to think about it. First, a graph showing the 200 players with the most pass attempts in NFL history (all have at least 1,325 attempts). On the X-Axis is completion percentage; on the Y-Axis is Yards per Completion. There are no era adjustments here, which can also make it kind of fun: over time, completion percentages have skyrocketed, while the average yardage gained per completion has decreased. As a result, a player with a very high yards per completion percentage almost certainly played long ago, and therefore has a low completion percentage (and vice versa). Take a look: [continue reading…]

{ 1 comment }

Brad Oremland is a longtime commenter and a fellow football historian. Brad is also a senior NFL writer at Sports Central. There are few who have given as much thought to the history of quarterbacks and quarterback ranking systems as Brad has over the years. What follows is Brad’s latest work on quarterback statistical production.


Brees threw a lot in garbage time

What I thought was an off-hand musing about Drew Brees’ production in low-leverage situations (for my ongoing series about the greatest statistical QBs in history) sparked a surprisingly contentious debate about whether Brees had padded his stats in garbage time.

I tried to align this with a very conservative definition of “garbage time” … all data are from 2004-17 — 2004 was Brees’ first good season — and none of the game/score situations below produced any wins by any team during those years. “P/B/R” indicates the combined total of Peyton Manning, Tom Brady, and Aaron Rodgers.

Please pardon the informal prose and formatting; this was originally composed as a comment, not an article. [continue reading…]

{ 1 comment }

Brady vs. Manning, Yearly ANY/A

Yesterday, Brad Oremland’s great series on his top-ranked QBs in Total Statistical Production concluded. You should give that a read today, especially if you missed it because of the holiday.One thing that Brad wrote about in the Manning section was how Manning was nearly always better than Brady during the ’00s. It’s easy to forget about that now — Brady has been the much better QB for each of the last three years, and for most years in the ’10s. But during the ’00s, the only year that Brady was clearly better was ’07.I decided to make a graph of the Adjusted Net Yards per Attempt for Tom Brady (in red with blue dots) and Peyton Manning (in blue with white dots for his Colts years, and orange with blue dots for his Broncos years) for each of the last 20 seasons. Brady missed all or nearly all of the ’98 (college), ’99 (college), ’00 (backup), and ’07 (injury) seasons, while Manning missed all of the ’11 (injury), ’16 (retired), and ’17 (retired) seasons. They each get a zero for those seasons, even tho Brady threw 14 passes combined in those years. The thin black line represents league average ANY/A each season.You can break this down into a few categories. [continue reading…]

{ 0 comments }

Are Interceptions More Or Less Damaging Now?

In the ’60s and ’70s, interceptions didn’t have nearly the negative stigma attached to them that they do now. Part of this was because interceptions were just an accepted part of the high variance strategy known as throwing the ball. Today, with offenses being more efficient, the opportunity cost of throwing an interception is greater. And, while I don’t have data to prove this claim, I am confident that interceptions on average happen closer to the line of scrimmage now than they used to, meaning the defense will be getting the ball in better field position. So it seems as though interceptions should be more highly correlated with losing than they used to be.

On the other hand, interceptions are pretty rare events now. Last year, a team threw zero interceptions in 46.3% of team games (counting each game as two individual games; one for the home team and one for the road team). That set a new record, breaking the old record of 45.7% set in… 2016. That broke the record of 44.0%, set back in… 2015. Okay, you get the point: teams are throwing fewer interceptions.

On the other hand, teams throwing zero interceptions won only 64% of games last season, which is the second-lowest mark (it was at 63% in 1994). By way of comparison, in 1981, teams threw zero interceptions in just 25.5% of games, but won 80% of those games. Of course, this is misleading in that it is not an apples-to-apples comparison. In 2017, when teams threw zero interceptions, their opponents averaged 0.92 interceptions per game, also the lowest mark ever. In 1981, teams that threw zero interceptions saw their opponents average 1.65 interceptions per game, so a zero interception game “should have” been more valuable back then because it meant you were winning the INT battle by +1.65 rather than just +0.92.

So perhaps we should look at net interceptions. Last year happened to be a pretty odd one. Teams that won the interception battle by exactly one interception won 65% of their games, which is pretty low. But over the ten prior years, teams that won the INT battle by 1 had a 72% winning percentage, up over the general historical average.

[continue reading…]

{ 1 comment }
Next Posts Previous Posts