
In the ’60s and ’70s, interceptions didn’t have nearly the negative stigma attached to them that they do now. Part of this was because interceptions were just an accepted part of the high variance strategy known as throwing the ball. Today, with offenses being more efficient, the opportunity cost of throwing an interception is greater. And, while I don’t have data to prove this claim, I am confident that interceptions on average happen closer to the line of scrimmage now than they used to, meaning the defense will be getting the ball in better field position. So it seems as though interceptions should be more highly correlated with losing than they used to be.
On the other hand, interceptions are pretty rare events now. Last year, a team threw zero interceptions in 46.3% of team games (counting each game as two individual games; one for the home team and one for the road team). That set a new record, breaking the old record of 45.7% set in… 2016. That broke the record of 44.0%, set back in… 2015. Okay, you get the point: teams are throwing fewer interceptions.
On the other hand, teams throwing zero interceptions won only 64% of games last season, which is the second-lowest mark (it was at 63% in 1994). By way of comparison, in 1981, teams threw zero interceptions in just 25.5% of games, but won 80% of those games. Of course, this is misleading in that it is not an apples-to-apples comparison. In 2017, when teams threw zero interceptions, their opponents averaged 0.92 interceptions per game, also the lowest mark ever. In 1981, teams that threw zero interceptions saw their opponents average 1.65 interceptions per game, so a zero interception game “should have” been more valuable back then because it meant you were winning the INT battle by +1.65 rather than just +0.92.
So perhaps we should look at net interceptions. Last year happened to be a pretty odd one. Teams that won the interception battle by exactly one interception won 65% of their games, which is pretty low. But over the ten prior years, teams that won the INT battle by 1 had a 72% winning percentage, up over the general historical average.
The graph below shows the league-wide winning percentage for teams when they won the interception battle by 1, 2, or 3 interceptions in each year since 1960:
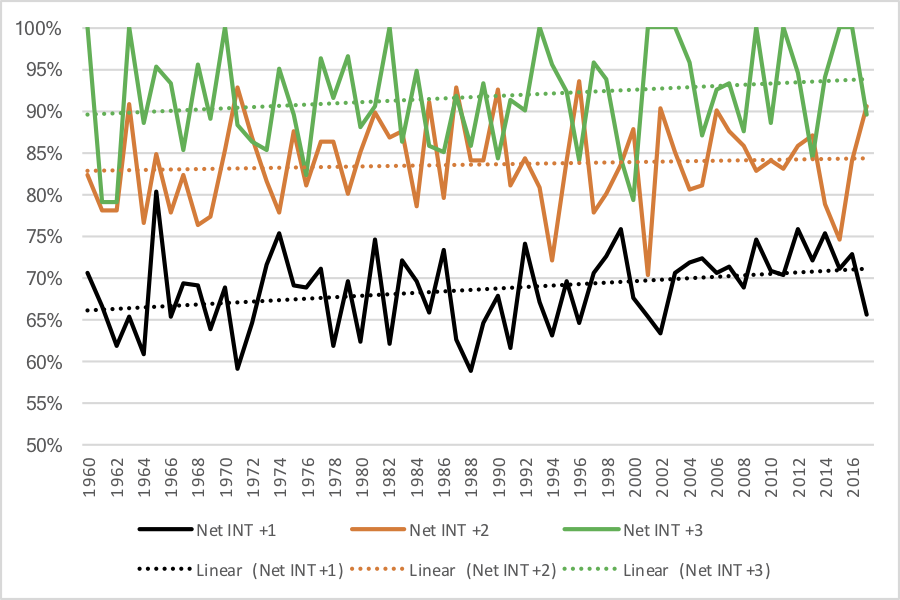
There are probably a number of different directions we could go from here, so I’ll open this up to you. What would you do next?