≡ Menu

Myles Garrett Is Your 2017 Combine Champion

Myles Garrett is in good shape.

Over the last few days, we have looked at how the top college athletes performed in various drills at the NFL combine, after adjusting for height and weight. Today, we look at the full results and crown a combine champion.

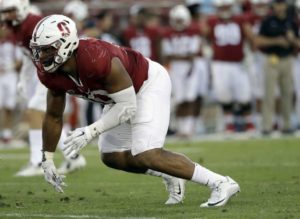
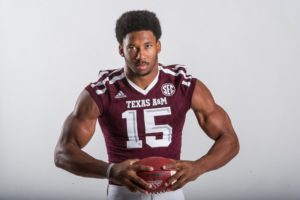
That is a pretty easy thing to do, as it turns out. Texas A&M defensive end Myles Garrett is likely going to be the first overall pick in the draft, and his performance in Indianapolis cemented such a distinction. Garrett had the 2nd best performance in three separate drills: the 40-yard dash, the bench press, and the vertical jump. Then, he produced a 5th-place finish in the broad jump, while sitting out the 3-cone drill. Garrett competed in four of these five events and his averaged finish was 2.8. That’s tremendous.

The table below shows the results in these five drills. I have also included an average rank, excluding all events where a player didn’t participate. That’s not the best way to do this, but I don’t know of a simpler method to rank them. The far right column shows how many of the 5 events each player competed in, so that can be a useful guide. It’s clear to me that the runner up for Combine King is Solomon Thomas rather than Aviante Collins. Thomas had an average rank of 7.6, but he competed in all five events. Collins has a higher rank at 5.0, but the TCU tackle only competed in the 40 and the bench press. To me, a 1-7-8-8-14 is more impressive than a 5-5-dnp-dnp-dnp, but to keep things simple, I just used a simple average. [continue reading…]

{ 1 comment }

Thomas was a combine superstar

As you can imagine, heavier players fare much worse in the 3-cone drill, and taller players have a slight advantage, too. Here was the best-fit formula from the 2017 combine:

7.3397 -0.0317 * Height (Inches) + 0.0091 * Weight (Pounds)

Stanford running back Christian McCaffrey is one of the more interesting prospects from this draft, and he dominated in the 3-cone drill, finishing in 6.57 seconds, just one hundredth of a second behind the leader. Given his dimensions — 71 inches, 202 pounds — he’d be expected to complete the drill in 6.93. McCaffrey therefore finished the drill in 0.36 seconds more than expected, the 7th-best adjusted performance in this drill.

The top performance belonged to a different Stanford player, defensive end Solomon Thomas, who finished a full 0.50 seconds above expectation. The full results, below: [continue reading…]

{ 1 comment }

Hey, look who it is again.

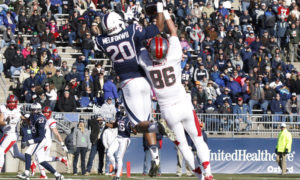
Yesterday, we looked at the vertical jump, which is biased towards lighter players. The star at the combine was Connecticut safety Obi Melifonwu, who had both the top vertical jump and the top weight-adjusted vertical jump. Well, Melifonwu also had the longest broad jump at the combine.

The broad jump is also biased in towards lighter players, but it’s also biased towards taller players. As a result, we need to adjust broad jump results for both weight and height: the best-fit formula from the results of the 2017 combine is:

Broad Jump = 84.14 + 1.0766 * Height (Inches) – 0.1940 * Weight (Pounds)

For Melifonwu, he weighed 224 pounds and was 76 inches tall; that means he’d be projected to jump a solid 122.5 inches. That’s a pretty high projection, showing that Melifonwu’s body is well-tailored for this drill. But even still, he exceeded that jump by 18.5 inches, courtesy of his remarkable 141 inch jump. As a result, he once again had both the top jump and the top adjusted jump: [continue reading…]

{ 0 comments }

Being able to jump high might be useful for a safety

Let’s begin with the most remarkable of today’s feats: Myles Garrett is getting pretty good at this number two thing. After finishing second in the weight-adjusted 40 and second in the height and weight adjusted bench press, Garrett has again finished second in a combine drill, this time the weight-adjusted vertical.

When it comes to the vertical jump, weight is by far the most important thing that matters. For every additional 16.7 pounds a player weights, his expected vertical declines by one inch. That’s because the best-fit formula for projecting the vertical jump at the 2017 combine was 46.38 – 0.0597 * weight (pounds). Connecticut safety Obi Melifonwu weighed 224 pounds in Indianapolis, which would project him to jump an even 33 inches if he was average at this drill.

Well, Melifonwu was anything but average. He jumped an incredible 44 inches: for comparison’s sake, Florida State / Jacksonville safety Jalen Ramsey had a 41.5 inch vertical last year, tied for the most of any player at the 2016 combine. And that was at 209 pounds. Melifonwu was 15 pounds heavier and jumped 2.5 inches higher. That’s a remarkable feat, and brings to mind some of the great verticals from the 2015 combine.

And while Melifonwu was 11 inches better than expected, Garrett was right on his heels at +10.9 inches. Garrett weighed 272 pounds at the combine, but still jumped an insane 41 inches. That’s only three fewer inches than Melifonwu at 48 pounds heavier. Now because the average player lost 16.7 inches for every pound, that makes Melifonwu’s jump just slightly better, but the two of them were far ahead of the rest of the pack. Below are the full results: [continue reading…]

{ 1 comment }

Lawson, when he’s not on the bench press

Yesterday, I looked at the best weight-adjusted 40-yard dash times at the 2017 NFL Combine. The Browns are expected to select Texas A&M defensive end Myles Garrett with the first overall pick, and with good reason: he had the 2nd best weight-adjusted 40-yard dash time, and he comes in 2nd place again today in the height and weight adjusted bench press.

In 2015, Clemson/Atlanta Falcon Vic Beasley was the bench press champion, using a formula involving expected bench press reps based on a player’s height and weight.  That turned out to be pretty predictive of future success; on the other hand, last year’s winner was Nebraska fullback Andy Janovich, who wound up being a 6th round pick and a minor contributor as a rookie with the Broncos.

The best-fit formula to project bench press reps for the 2017 Combine was:

17.401 -0.3354 * Height (Inches) + 0.1075 * Weight (Pounds)

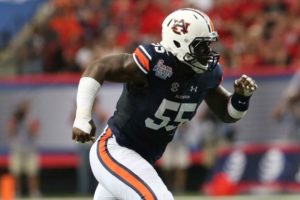
Using that formula, Garrett — at 76 inches and 272 pounds — would be projected to bench press 225 pounds for 21.1 reps. In reality, Garrett produced a whopping 33 reps, or 11.9 more than expected. The only way to top him was Auburn’s Carl Lawson, who measured at 74 inches and only 261 pounds. Being shorter is better, but being lighter is worse, and Lawson would be projected using the regression to have 20.6 reps on the bench press. Instead, he had 35, or 14.4 more than projected, easily the largest margin at the combine.
[continue reading…]

{ 0 comments }

O.J. Howard is fast.

As I have done for the last few years, this week I will be using the raw NFL combine data and adjusting them various metrics.  With respect to the 40-yard dash, the only adjustment I’ve made is for weight, as no other variable (e.g., height) impacts a player’s 40 time quite like weight.  The best-fit formula to predict 40-yard dash time during the 2017 combine was 3.283 + 0.00606 x weight. ((This time around, I excluded punters, kickers, and long snappers when running regressions, as those players aren’t invited to their combine for their raw athleticism (and removing them made the numbers a little tighter). As you can see

Let’s use Alabama tight end O.J. Howard as an example.  He weighed 251 pounds at the combine, which means he would be projected to run the 40-yard dash in 4.81 seconds. Instead, he ran it in just 4.51 seconds, a full 0.30 better than expected.

That was the best performance of any player at the combine. A very close second was produced by the presumptive number one pick in the draft, Myles Garrett. The Texas A&M defensive end weighed 272 pounds, so using the formula above, a player of Garrett’s size should run the 40 in 4.93 seconds.  But Garrett was 0.29 seconds better than expected, completing the drill in 4.64 seconds. Garrett reportedly bested that time by running 40 yards in 4.57 seconds at his Pro Day, too. [continue reading…]

{ 4 comments }

The Broncos thought they had found their heir apparent.

The Giants, Saints, Steelers, and Chargers all have older franchise quarterbacks, leading many to speculate that one or more of those teams will spend an early pick on a quarterback. That could even include a first round pick, which made me wonder: how often do teams do that?

I looked at all teams since 1967 that:

  • Used a first round pick on a quarterback;
  • Had a QB on the roster the year before and that upcoming season who was at least 32 years old in the upcoming season;
  • That QB threw at least 100 passing touchdowns with that team.

There are 15 examples that fit those specific criteria.  Let’s review: [continue reading…]

{ 9 comments }

2016 Team AV and Draft Value

Last year, I looked at each team’s “average” draft value, with average being defined as the AV-weighted average of the team’s roster. And yesterday, I did the same thing for every Super Bowl champion. Today, we look at the draft value for each team in 2016.

One thing that’s interesting, if not surprising: there’s not a ton of turnover from year to year in this stat. The top five teams in this metric last year were also the top five teams this year, although the order switched around notably. The Falcons were fifth last season, but were first this year, and would have been in the top 10 among all Super Bowl champions had they won. That’s what happens when Matt Ryan (3rd overall), Julio Jones (6th), Alex Mack (21st), Jake Mathews (6th), and Vic Beasley (8th) were the team leaders in AV.

The table below shows all teams in 2016: [continue reading…]

{ 1 comment }

Super Bowl Champions, by Draft Value

The New England Patriots won Super Bowl LI, but it wasn’t because the team was packed full of high draft picks. Of the five Patriots who had more than 10 points of AV, only one was drafted in the first four rounds. Regular readers know that I created an AV-based draft value chart, which assigns points to each draft pick based on the expected marginal production produced by that pick.

Well, you can calculate a team’s weighted average draft value by doing the following:

  • Calculate the draft value spent on each player on the roster who produced at least 1 point of AV that season.
  • Calculate the percentage of team AV produced by each player. This is key, otherwise Chris Long would skew the results in the wrong direction.
  • Multiply the results in steps 1 and 2, and then sum those values.

Here’s how it would work with the 2016 Patriots, who had an average draft value (as a roster, and weighted by AV) of 6.72.

PlayerPosAVPerc of TmAV%Draft PkDraft ValWt Draft Val
Dont'a HightowerILB145.4%2514.10.76
Malcolm ButlerCB135%udfa00.00
Tom BradyQB135%1990.90.05
Marcus CannonOL135%1383.20.16
Julian EdelmanWR114.2%23200.00
Devin McCourtyDB103.8%2713.60.52
Nate SolderT103.8%1716.60.64
Alan BranchDT93.5%3312.30.43
LeGarrette BlountRB83.1%udfa00.00
David AndrewsC83.1%udfa00.00
Shaq MasonC83.1%1313.60.11
Joe ThuneyOG83.1%786.90.21
Malcom BrownDT83.1%3212.50.38
Chris HoganWR72.7%udfa00.00
James WhiteRB72.7%1303.60.10
Trey FlowersDE72.7%1015.20.14
Martellus BennettTE72.7%618.40.23
Rob NinkovichDE62.3%1353.40.08
Jabaal SheardDL62.3%3711.60.27
Patrick ChungDB62.3%3412.10.28
Chris LongDE62.3%230.20.70
Nate EbnerDB51.9%19710.02
Logan RyanCB51.9%836.50.13
Jamie CollinsOLB51.9%529.40.18
Rob GronkowskiTE51.9%4210.80.21
Elandon RobertsILB41.5%2140.40.01
Cameron FlemingOT41.5%1403.10.05
Malcolm MitchellWR41.5%1124.60.07
Shea McClellinDE41.5%1915.80.24
Dion LewisRB31.2%1492.70.03
Stephen GostkowskiK31.2%1184.20.05
Vincent ValentineDT31.2%965.50.06
Eric RoweCB31.2%4710.10.12
Danny AmendolaWR20.8%udfa00.00
Jonathan FreenyDE20.8%udfa00.00
Ryan AllenP20.8%udfa00.00
Ted KarrasOG20.8%2210.20.00
Duron HarmonFS20.8%915.90.05
Jacoby BrissettQB20.8%915.90.05
Jimmy GaroppoloQB20.8%628.30.06
Kyle Van NoyOLB20.8%4011.10.09
Barkevious MingoOLB20.8%623.20.18
Jonathan JonesDB10.4%udfa00.00
Anthony JohnsonDT10.4%udfa00.00
Justin ColemanCB10.4%udfa00.00
Brandon KingDB10.4%udfa00.00
Woodrow HamiltonDL10.4%udfa00.00
Joe CardonaLS10.4%16620.01
Geneo GrissomOLB10.4%975.50.02
Jordan RichardsSS10.4%648.10.03
Cyrus JonesCB10.4%608.50.03
Total260100%6.72

[continue reading…]

{ 0 comments }

Draft Capital Used By Position: DB

Regular readers know all about the Football Perspective Draft Value Chart, which is derived from the approximate value actually produced by draft picks at each draft slot. Over the next week, I will be showing how much draft capital has been used to select players at certain positions in every draft since 1990. This will allow us to see how much the league’s view on the value of a position has changed, while also giving us a visual insight into the volatility among the talent in draft classes is from year-to-year.

I will be staying out of the commentary for now, so I encourage you to post your thoughts. To make comparison across positions easier, I will be using the same scale for each position. Let’s look at the graph for defensive backs: [continue reading…]

{ 1 comment }

Draft Capital Used By Position: LB

Regular readers know all about the Football Perspective Draft Value Chart, which is derived from the approximate value actually produced by draft picks at each draft slot. Over the next week, I will be showing how much draft capital has been used to select players at certain positions in every draft since 1990. This will allow us to see how much the league’s view on the value of a position has changed, while also giving us a visual insight into the volatility among the talent in draft classes is from year-to-year.

I will be staying out of the commentary for now, so I encourage you to post your thoughts. To make comparison across positions easier, I will be using the same scale for each position. Let’s look at the graph for linebackers: [continue reading…]

{ 2 comments }

Draft Capital Used By Position: DL

Regular readers know all about the Football Perspective Draft Value Chart, which is derived from the approximate value actually produced by draft picks at each draft slot. Over the next week, I will be showing how much draft capital has been used to select players at certain positions in every draft since 1990. This will allow us to see how much the league’s view on the value of a position has changed, while also giving us a visual insight into the volatility among the talent in draft classes is from year-to-year.

I will be staying out of the commentary for now, so I encourage you to post your thoughts. To make comparison across positions easier, I will be using the same scale for each position. Let’s look at the graph for defensive linemen: [continue reading…]

{ 3 comments }

Draft Capital Used By Position: OL

Regular readers know all about the Football Perspective Draft Value Chart, which is derived from the approximate value actually produced by draft picks at each draft slot. Over the next week, I will be showing how much draft capital has been used to select players at certain positions in every draft since 1990. This will allow us to see how much the league’s view on the value of a position has changed, while also giving us a visual insight into the volatility among the talent in draft classes is from year-to-year.

I will be staying out of the commentary for now, so I encourage you to post your thoughts. To make comparison across positions easier, I will be using the same scale for each position. Let’s look at the graph for offensive linemen: [continue reading…]

{ 3 comments }

Draft Capital Used By Position: TE

Regular readers know all about the Football Perspective Draft Value Chart, which is derived from the approximate value actually produced by draft picks at each draft slot. Over the next week, I will be showing how much draft capital has been used to select players at certain positions in every draft since 1990. This will allow us to see how much the league’s view on the value of a position has changed, while also giving us a visual insight into the volatility among the talent in draft classes is from year-to-year.

I will be staying out of the commentary for now, so I encourage you to post your thoughts. To make comparison across positions easier, I will be using the same scale for each position. Let’s look at the graph for tight ends: [continue reading…]

{ 3 comments }

Draft Capital Used By Position: WR

Regular readers know all about the Football Perspective Draft Value Chart, which is derived from the approximate value actually produced by draft picks at each draft slot. Over the next week, I will be showing how much draft capital has been used to select players at certain positions in every draft since 1990. This will allow us to see how much the league’s view on the value of a position has changed, while also giving us a visual insight into the volatility among the talent in draft classes is from year-to-year.

I will be staying out of the commentary for now, so I encourage you to post your thoughts. To make comparison across positions easier, I will be using the same scale for each position. Let’s look at the graph for wide receivers: [continue reading…]

{ 2 comments }

Draft Capital Used By Position: RB

Regular readers know all about the Football Perspective Draft Value Chart, which is derived from the approximate value actually produced by draft picks at each draft slot. Over the next week, I will be showing how much draft capital has been used to select players at certain positions in every draft since 1990. This will allow us to see how much the league’s view on the value of a position has changed, while also giving us a visual insight into the volatility among the talent in draft classes is from year-to-year.

I will be staying out of the commentary for now, so I encourage you to post your thoughts. To make comparison across positions easier, I will be using the same scale for each position. Let’s look at the graph for running backs: [continue reading…]

{ 6 comments }

Draft Capital Used By Position: QB

Regular readers know all about the Football Perspective Draft Value Chart, which is derived from the approximate value actually produced by draft picks at each draft slot. Over the next week, I will be showing how much draft capital has been used to select players at certain positions in every draft since 1990. This will allow us to see how much the league’s view on the value of a position has changed, while also giving us a visual insight into the volatility among the talent in draft classes is from year-to-year.

I will be staying out of the commentary for now, so I encourage you to post your thoughts. To make comparison across positions easier, I will be using the same scale for each position. Let’s start with the graph for quarterbacks: [continue reading…]

{ 6 comments }

With the 2nd pick in the 2nd round of the 2016 Draft, the Cowboys drafted Notre Dame linebacker Jaylon Smith at 34th overall.  Smith tore his ACL and MCL in the Fiesta Bowl, but Dallas was willing to take the risk with by giving Smith a redshirt season.

With the 41st pick, Buffalo traded up for linebacker Reggie Ragland, who wound up missing his entire rookie season after tearing the ACL in his left knee in training camp. With the 50th pick, Houston drafted offensive lineman Nick Martin, who also was injured in training camp and wound up missing his entire rookie year.

Those three players, and Bengals first round pick William Jackson (who tore his pec in August), were four of the five players selected in the first two rounds of the 2016 Draft who failed to see the field. Jets second round pick, quarterback Christian Hackenberg, was the fifth.

That makes Hackenberg the 17th quarterback since the common draft (1967) to fail to make the field as a rookie despite being drafted in the first or second round. For the most part, that’s because those quarterbacks were behind entrenched starters. [continue reading…]

{ 2 comments }

Today at 538: A look at draft value by team, based on the number of snaps taken by each player:

Based on the draft value calculator I created to measure the approximate average production level provided by each draft pick, we can convert each draft slot into a draft value (undrafted players receive a draft value of zero). Then, with the help of Pro-Football-Reference.com, I was able to calculate the snap-weighted draft value of each team’s offense and defense. For example, Palmer, as the first overall pick in the draft, has a draft value of 34.6. And since Palmer has taken 77 percent of all snaps for the Cardinals this season and he is one of 11 players on the offense, that means that 7 percent (i.e., 77 percent divided by 11) of Arizona’s snap-weighted offensive draft value is driven by Palmer’s 34.6 rating. This isn’t a perfect proxy for the production we can expect from a top pick — Palmer is on the back end of his career, when we expect even the best quarterbacks to be in decline — but it’s a fun way to look at the rosters.

Perform this calculation for each player on each team through the first six weeks of the 2016 NFL season and we can calculate the average draft value of each offense and defense, with all snap data coming from Pro-Football-Reference.com. Arizona has the best-pedigreed offense in the NFL; the Seahawks’ offense, on the other hand, has the lowest average draft value.

You can read the full article here.

{ 0 comments }

The 2010 Draft Class was not very good when it came to quarterbacks.  Take a look:

 
Rnd Pick Tm Player Pos Age To AP1 PB St CarAV DrAV G Cmp Att
Yds TD Int
1 1 STL Sam Bradford QB 22 2016 0 0 4 33 25 66 1444 2387 15509 82 52
3 85 CLE Colt McCoy QB 24 2015 0 0 2 12 10 34 508 842 5586 26 23
5 155 ARI John Skelton QB 22 2012 0 0 0 4 4 20 320 602 3707 15 25
2 48 CAR Jimmy Clausen QB 23 2015 0 0 1 3 0 22 255 472 2520 7 14
1 25 DEN Tim Tebow QB 23 2012 0 0 1 12 11 35 173 361 2422 17 9
6 176 TEN Rusty Smith QB 23 2012 0 0 0 1 1 3 23 45 234 0 4
4 122 PHI Mike Kafka QB 23 2011 0 0 0 0 0 4 11 16 107 0 2
6 204 CAR Tony Pike QB 24 2010 0 0 0 0 0 1 6 12 47 0 0
7 209 BUF Levi Brown QB 23 2010 0 0 0 0 0 1 2 3 24 0 1
5 168 SDG Jonathan Crompton QB 23 0 0 0
6 181 CHI Dan LeFevour QB 23 0 0 0
7 239 NOR Sean Canfield QB 24 0 0 0
7 250 NWE Zac Robinson QB 24 2012 0 0 0 0

So far this year, Bradford is the only quarterback from the 2010 Draft Class to throw a pass, tho McCoy is currently Washington’s backup.  The graph below shows the amount of passes so far this year in 2016 thrown by quarterbacks from each draft class: [continue reading…]

{ 13 comments }

Bryson Albright was a defensive end for Miami (Ohio) who went undrafted in 2016, but has made the Buffalo Bills roster. Albright is a relatively unknown, so when he made the final cut, the Bills media asked Rex Ryan about him:

Q: How much do you like those stories? You know the odds for undrafted guys. To have a guy like that’s got to feel pretty good, right?

A: Well it does and I think that’s where you really saw our scouting department and our coaching department get together and focus on a couple of these guys and we hit on one. So we’ll see how it is, the kind of career he has, but yeah, you’re right. And I mention it every year to these guys that there’s more guys that went undrafted that have a 10 year or more career than there are first round picks. So I think every now and then you hit a guy that—and I’m not saying he’s going to be that, that would be great if he is—but as much effort and everything else that goes into the drafting of players, there’s some exceptions. And we’ll see if this young man will be one of those exceptions.

Mike Schopp, who works for WGR in Buffalo, tweeted me after hearing this claim, and wondered if it was true. And, well, I was pretty curious, too.

If we want to measure 10+ year careers, we need to look at players who entered the NFL in 2006 or earlier. To have a large enough sample, I picked 20 years, which means we’ll be looking at all players who entered the NFL from 1987 to 2006. There were 1,062 players who entered the league during that time frame and played for 10+ years, or roughly 53 per year.

255 of those players, or 24%, were first round picks. Undrafted players? Well, that’s limited to just 182 players. [continue reading…]

{ 4 comments }

2015 Team AV and Draft Value

Did you know Wilson was a 3rd round pick?

Did you know Wilson was a 3rd round pick?

The Kansas City Chiefs and the Seattle Seahawks both had very good seasons in 2015, with each team ultimately losing in the division round of the playoffs. But they got there with very different rosters when it comes to the NFL Draft.

The Chiefs have Alex Smith at quarterback, and while he wasn’t drafted by Kansas City, he was the first overall pick in 2005. Eight years later, offensive tackle Eric Fisher went first overall, while safety Eric Berry gives the team a third top-five pick, tied with five other teams for most in the league. Dontari Poe, Derrick Johnson, Marcus Peters, Jeremy Maclin, and Tamba Hali were all top-20 picks, too. Thought of another way, all of the top 5 Chiefs in Approximate Value were drafted in the top 20; the team’s next three leaders in AV are Hali and two high third round picks (Travis Kelce and Justin Houston).

Smith had 16 points of AV last year, or 7% of the Chiefs total AV. Since he was the first pick, and the first pick is worth 34.6 points, that means 7% of the Chiefs weighted “average draft value” is 34.6 points. Kelce had 8 points of AV, or 4% of KC’s AV; as a result, 4% of the Chiefs weighted “average draft value” is equal to 8.2, the value of the 63rd pick in the draft. Do this for every player on the team, and Kansas City’s average draft value is equal to 11.5 points, or in between the 37th and 38th picks in the draft.  That maybe doesn’t mean much in the abstract, but it’s the most average draft value of any team in the NFL.

Now, let’s look at Seattle. Eight Seahawks had at least 10 points of AV last year: those players were Russell Wilson (3rd round), Bobby Wagner (2nd), Richard Sherman (5th), Michael Bennett (undrafted), Doug Baldwin (undrafted), Garry Gilliam (undrafted), K.J. Wright (4th round), and Earl Thomas (14th overall). It’s easy to forget, given how talented Seattle is, but only Russell Okung, Bruce Irvin, Marshawn Lynch, and Thomas were first round picks (and only Thomas returns for 2016). And only two of the team’s regular contributors — Wagner and Justin Britt — were second round picks. In fact, Seattle’s averaged draft value using the weighting formula described above was 5.15 points, equivalent to the 101st pick in the Draft. That’s two full rounds lower than Kansas City’s average. [continue reading…]

{ 7 comments }

The 2000 NFL Draft was supposed to bring an incredible infusion of wide receiver talent. Peter Warrick, Plaxico Burress, and Travis Taylor were top-10 picks, making it one of only four classes since 1970 were three wide receivers drafted in the top ten. In addition, Sylvester Morris, R. Jay Soward, Dennis Northcutt, and Todd Pinkston all went in the top 36 picks, one of only seven classes since the merger with seven wide receivers in the top 36. Avion Black was the 20th wide receiver taken with the 121st pick: add it all up, and the 2000 draft had unmatched levels of quality and quantity. The graph below shows the amount of draft value spent on wide receivers (you can click here for value spent on wide receivers and tight ends) in each draft from 1970 to 2011: [continue reading…]

{ 24 comments }

In the 2016 Draft, the Jets selected Christian Hackenberg with the 51st pick. It was a curious move, given Hackenberg’s underwhelming college career; the book on him, though, is that he needs some time to be “rehabilitated” as a quarterback, whatever that means. [1]This anecdote about him making easy conversation about the Masters doesn’t exactly settle my fears about his inability to read defenses or throw accurately under pressure.

But how much time will he get? On average, how many games until a 2nd round quarterback starts his first game? There were no quarterbacks drafted in the second round in 2015, while in 2014, Derek Carr and Jimmy Garoppolo were selected. Carr started his first game as a rookie, while Garoppolo will get his first start in the 33rd team game of his career, thanks only to a Tom Brady suspension.

In 2013, only one quarterback was drafted in the 2nd round…. and it was Geno Smith. The Jets didn’t exactly hand Smith the job, but he won a quarterback competition with Mark Sanchez by default when Sanchez suffered a season-ending shoulder injury in the fourth quarter of the team’s third preseason game against the Giants.

The Jets don’t plan on starting Hackenberg in 2016, but they didn’t plan on starting Geno Smith as a rookie, and they didn’t plan on starting Ryan Fitzpatrick last year, either, until Smith was on the receiving end of a, um, training camp injury. Smith or Fitzpatrick is the likely week 1 starter for the 2016 Jets, and even Bryce Petty probably has better odds than Hackenberg of starting the opener. But with New York, strange things tend to happen.

The table below shows how many team games it took until a player started. For non-16 game seasons, I pro-rated them for 16 seasons, to make that applicable to modern times. So, for example, a 53 (like next to Ken Stabler) means a player started in the 5th game of his 4th year (i.e., after 48 games had passed), regardless of the actual facts. [continue reading…]

References

References
1 This anecdote about him making easy conversation about the Masters doesn’t exactly settle my fears about his inability to read defenses or throw accurately under pressure.
{ 3 comments }

You remember the 1987 Draft, right? It was a terrible draft for pass catchers.  The first TE drafted was Robert Awalt in the third round; only two more, Ron Hall and Jim Riggs, went before the sixth round, and Ron Embree was the final TE selected before the seventh round. At wide receiver, Haywood Jeffires was the first off the board at #20; the only other first rounders were Ricky Nattiel and Mark Ingram. The only other receiver in the top 50 was Lonzel Hill.  Mark Carrier, Kelvin Martin,Curtis Duncan, and Bruce Hill went in the later rounds,  but it was a terrible draft for pass catchers.

Using the Draft Value Chart, there were 177.4 points of draft value used on wide receivers and tight ends in the 1987 Draft.  That was the second year in a row when the league moved away from pass catchers.  Well, in this past draft, less draft capital was spent on wide receivers and tight ends than on any year since 1987. Take a look: [continue reading…]

{ 1 comment }

Yesterday, I looked at the number of players drafted at each position in the 2016 Draft, the draft capital spent at each position, and also the draft capital spent at each position on a per-snap basis.

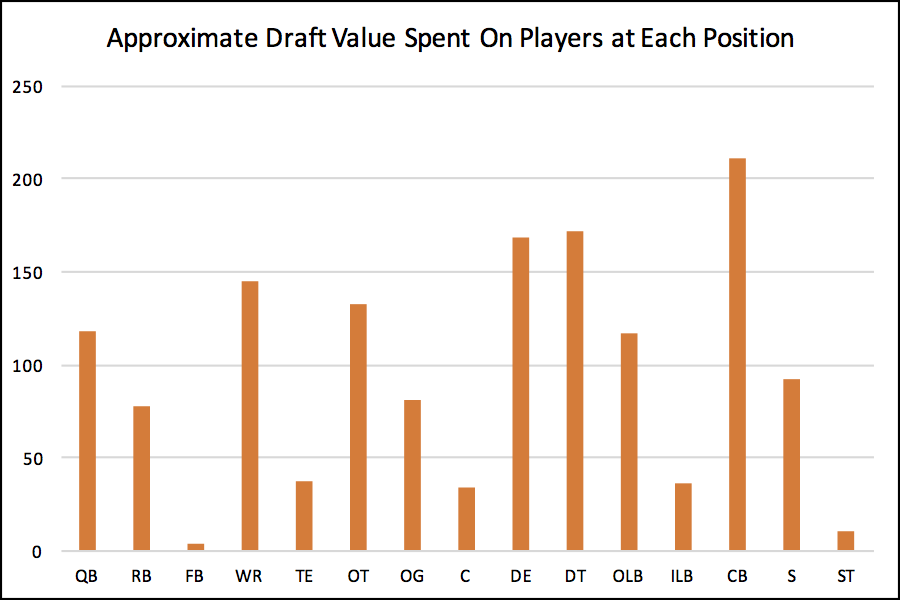
Those numbers are fun, but are more meaningful with some context. So let’s look at the chart I find most useful — the per-snap data — and compare it to the drafts from 2013 to 2015. In the chart below, you can see that in the 2016 Draft (in green), there was 118 points of draft value spent on QBs (of course, only 1 QB per snap), compared to an average of 78 from 2013-2015 (in orange). This means the 2016 Draft was heavy on quarterbacks, which makes sense: after all, Jared Goff and Carson Wentz were the first two picks, and Paxton Lynch also went in the first round. In the three prior years, there was an average of just one QB in the top 3 (Blake Bortles, Jameis Winston, Marcus Mariota) and one later in the first round (EJ Manuel, Johnny Manziel, Teddy Bridgewater). [continue reading…]

{ 2 comments }

In the 2016 NFL Draft, 32 cornerbacks and 31 wide receivers were selected, making those the two most commonly-drafted positions this year. That’s not too surprising, of course, as cornerbacks and wide receivers litter the field on Sundays. But the graph below shows the number of plays drafted at each position:

players position 2016 draft

A little more interesting would be the Draft Value used on each player: after all, spending a high pick on a player means a lot more than spending a low pick on one. Here, we see that cornerback stands out: teams are more likely to use high picks on cornerbacks and late-round picks on wide receivers, at least in 2016:

value position 2016 draft [continue reading…]

{ 21 comments }

Today at 538, you can read my thoughts on Ohio State’s insane 2016 draft.  It is, by a large measure, the best in modern history.  And while some have noted that the Buckeyes dominated the draft, I don’t think people have realized exactly how impressive it truly was:

Incredibly, Ohio State had five players drafted in the top 20 and another five in the top 100. As a result, a total of 151.2 points of draft value was used on Buckeyes players. That’s the most — by a very large margin — in 70 years. The table below shows the top 25 draft classes as measured by points of draft value used to select players:

You can read the full article here.

{ 13 comments }

Longtime commenter Jason Winter has chimed in with today’s guest post. Jason is a part-time video game journalist and full-time sports fan. You can read more of him at his blog: https://jasonwinter.wordpress.com/, and follow him on twitter at @winterinformal.

As always, we thank Jason for contributing.


The 2016 NFL Draft is over, and that means just one thing: It’s time to start talking about the 2017 NFL Draft! Or at least, it’s time to start publishing 2017 mock drafts, for all those sweet, sweet clicks.

A lot can happen in a year, of course. Draft status can go up or down based on a number of factors, from a player’s performance during his final college season to injuries to combine performance to… well, whatever happened to Laremy Tunsil. The draft order – whether set by a team’s record or trades – also plays a significant part. Is it really possible to accurately predict how the draft will go a year in advance? Or is it just a cheap ploy to get people to look at your website?

In the two weeks following last year’s draft, I copied first-round mock drafts from 10 different sources around the web, to see how they would stack up with the real results a year later. Sample size warnings are obvious; this is just one year, just 10 people’s mock drafts, and maybe the draft class was especially predictable or unpredictable. Still, it was a fun project, and I plan to do the same thing with mock drafts this year and see how they stack up in 2017.

All the mock drafts from a year ago were published before Deflategate penalties were handed out, so they have 32 picks, including one from New England. As such, for this article, when I refer to “first round,” I’ll be including the first 32 picks of the 2016 draft, including Emmanuel Ogbah, selected by Cleveland with the first pick of the second round.

I applied two different scoring systems to each mock draft. The first, which I call the “Strict” method, better rewards exact or very close hits: 10 points for getting a pick’s position exactly right; 8 points for being 1 pick off; 6 for being 2 off; 4 for being 3-4 off; 3 for being 5-8 off; 2 for being 9-16 off; and 1 for being 17-32 off. [continue reading…]

{ 6 comments }

At 538 on Friday, I looked at the trades in round 1 of the NFL Draft. Today, let’s look at the trades that happened on Day 2.

1)

Jacksonville receives: second-round pick (No. 36 overall) (UCLA LB Myles Jack)
Baltimore receives: second-round pick (No. 38 overall) (Traded to Miami), fifth-round pick (No. 146 overall) (Grand Valley St. DE Matt Judon)

Football Perspective Draft Value Chart: Baltimore received 121 cents on the dollar
Jimmy Johnson Draft Value Chart: Baltimore received 102 cents on the dollar

Jack was an outstanding college player who many thought would go in the top five of the first round if he had a clean bill of health.  Unfortunately, that’s not the case, and Jack’s injured right knee caused him to slide to the second day of the draft. It’s tempting to call this a steal for Jacksonville, but remember that many teams that could use a player like Jack — including Baltimore — felt he wasn’t worth the risk.  The Jaguars paid a decent price to get him, but this trade will be a home run for the Jaguars if Jack stays healthy. As for Baltimore, the team traded down just two picks later, and did even better….

2)

Miami receives: second-round pick (No. 38 overall) (Baylor CB Xavien Howard)
Baltimore receives: second-round pick (No. 42 overall) (Boise St. DE Kamalei Correa), fourth-round pick (No. 107 overall) (Cincinnati WR Chris Moore)

Football Perspective Draft Value Chart: Baltimore received 137 cents on the dollar
Jimmy Johnson Draft Value Chart: Baltimore received 108 cents on the dollar

The Ravens wound up dropping from 36 to 42 and collected a fourth and a fifth to drop six slots; that’s a great haul, as it landed the team three players rather than one. The Dolphins gave up a lot to move up four slots, which is emblematic of an organization that puts little emphasis on depth relative to star power. [continue reading…]

{ 2 comments }
Next Posts Previous Posts