≡ Menu

Parity Does Not Exist In The 2018 NFL

With three weeks left, the NFL playoff picture is nearly complete.  In the AFC, the Chiefs, Patriots, and Chargers are all going to make the postseason; in 2017, Kansas City and New England won their divisions, and the Chargers won 9 games.

The Steelers and Ravens are favorites to go to the postseason; Pittsburgh won the AFC North last year, and Baltimore won 9 games.  The AFC South will likely go to Houston, and that would be the only “surprise” in the AFC this year.  The Texans won just 4 games last year, although expectations were much higher this year with a healthy Deshaun Watson.  The Titans, who made the playoffs last year, are still technically in the hunt for the division title, which would make the AFC (lack of) turnover even more extreme.

Things aren’t much different in the NFC.  The Saints and Rams have already clinched their division titles for the second year in a row. The Seahawks and Cowboys, who each won 9 games last year, will likely be in the postseason this year.  The Bears are the Texans of the NFC, going from 5-11 to division champion with a first round quarterback from the 2017 Draft.  Nobody in the NFC wants the 6th spot, but the Vikings — who went 13-3 last year — are the current favorite.

Think about that: if the season ended today, then 10 of the 12 playoff teams in 2018 had a winning record in 2017. There is still time for the Dolphins or Colts to snag the 6 seed in the AFC from the AFC North runner up, but in the NFC, the Eagles and Panthers (who both won 11+ games last year) are on deck for the 6 seed if the Vikings falter.

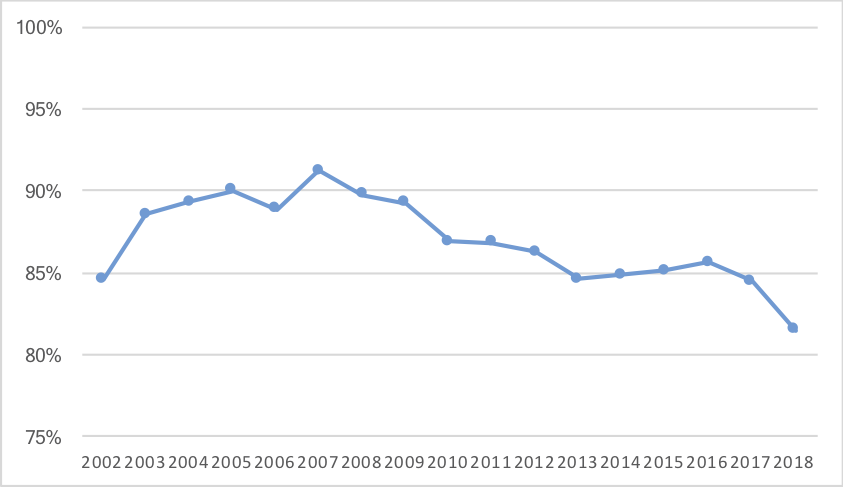
How does that compare to prior years? Assuming 10 of the 12 2018 playoff teams — 83% — had a winning record in 2017, that would stand out as a pretty big outlier. It would mark a reversion to the 1980s, pre-salary cap and free agency era of the NFL, where parity didn’t play a central role. The graph below shows, for each year since 1970, the percentage of teams that made the postseason and had a winning record the prior year. [continue reading…]

{ 0 comments }

Week 14 Passing Stats: Primetime Flops

You don’t expect to see Jared Goff’s at the bottom of the weekly ANY/A rankings, at least not since his rookie year.  But Goff had the worst game of his career on Sunday night, throwing for only 180 yards while also throwing 4 interceptions and zero touchdowns against the Bears.  Savvy readers will know that since an interception is worth -45 yards in the ANY/A formula, a passer with 180 yards, no TDs, and zero INTs will have an ANY/A of 0.00, regardless of their number of attempts.

Goff also took three sacks, so he finished with an ANY/A of -0.53.  The quarterback on the opposing sideline, Mitchell Trubisky, wasn’t much better. Trubisky threw a touchdown, but picked up just 110 yards while throwing 3 interceptions; he finished with an ANY/A of -0.48 on 31 dropbacks.

And then on Monday Night Football, we saw some more bad passing from a pair of star quarterbacks.  Russell Wilson was the winning quarterback, and the Seahawks became just the second team in the last 9 years to win a game with 60 or fewer passing yards on 20 or more passing stats (the 2017 Seahawks being the other). Wilson finished with an ANY/A of 0.68 and a passer rating of 37.9, the single worst performance of his career.

Kirk Cousins was the losing quarterback on MNF, and while his final statistics don’t look too bad, they are a bit misleading.  Cousins took a strip sack with three minutes to go that was recovered and returned for a touchdown, putting Seattle up 21-0.  After that, Cousins threw for 70 yards and a touchdown on his final 6 meaningless passes; prior to that moment, he was averaging 4.45 ANY/A.  He had thrown for just 5 first downs on his first 29 passes.

The table below shows the weekly passing results: [continue reading…]

{ 0 comments }

Week 14 Was Pretty Weird

Entering week 14, the top of the 2019 NFL Draft order was San Francisco at 1, Oakland at 2, and the New York Jets at 3. All three teams promptly won in week 14. The Los Angeles Rams were 11-1, and promptly got embarrassed by the Chicago Bears; Jared Goff, who had never thrown more than 2 interceptions in a game, threw 4 interceptions against a punishing Bears defense. The Oakland Raiders won as 10.5-point underdogs against Pittsburgh, but depending on when you measure it, there was en even more shocking result. The Miami Dolphins were 9.5-point underdogs against the Patriots, trailed by 5 points with 7 seconds left and 69 yards to go, and still won.

In a week like this one, the Texans seeing their 9-game winning streak end at home against the Colts doesn’t quite register as surprising. And the Browns beating anyone, let alone the Panthers? Well, that’s not even a top-5 upset. The table below shows each upset this season, based upon the — as of right now — SRS ratings of each team this year. Here’s how to read it: in week 14, Oakland beat Pittsburgh, 24-21. Oakland has an SRS of -9.1, while the Steelers have an SRS of +5.1. That’s a difference of -14.2 points. There were 6 upsets this week, and a Minnesota upset in Seattle tonight would bring that total to 7. [continue reading…]

{ 0 comments }

On the surface, the Raiders pass defense doesn’t look that terrible. Oakland has allowed 2,920 passing yards, which is actually slightly above average (14th fewest in the NFL). Opposing passers are completing just 62.9% of passes against Oakland, which ranks as the 8th best mark in the NFL. Even in interceptions, where the Raiders are below average, the defense’s 9 interceptions still ranks tied for 21st in the league. So bad, but not particularly noteworthy.

But there are three places where Oakland’s pass defense looks really, really bad.

  • The Raiders have just 10 sacks this season and a 2.8% sack rate; both marks are easily the worst in the league. Only four teams ever have had a sack rate below 3.0% for a full season: the 2008 Chiefs (1.9%), 1981 Colts (2.6%), 2009 Jaguars (2.7%), and 1958 Packers (2.9%). There are 9 players this year with more than 10 sacks, and Khalil Mack (9 sacks in 10 games) is averaging more sacks per game than the entire Raiders defense (10 sacks in 12 games).
  • Opposing passers are averaging 13.76 yards per completion this season.  In the modern era, the average yards per completion has been declining for decades.   The Lions are allowing 12.5 yards/completion this year, the second worst rate in the NFL. How bad has Oakland been? The last time a pass defense allowed this many yards per completion was the 1990 Patriots.
  • The Raiders have allowed 29 touchdown passes, the most in the NFL.  That’s despite facing just 345 pass attempts, the fewest in the NFL.  That’s remarkable and it is because Oakland has allowed a touchdown pass on 8.4% of all passes.  That’s the worst rate of any team since the 1967 Dolphins.

Oakland has allowed 8.7 ANY/A this year, which puts the Raiders in shouting distance for the worst pass defense ever (without adjusting for era, of course). That mark is currently held by the 2015 Saints.

{ 1 comment }

Yesterday, I wrote that NFL yards per carry is at an all-time high. But running backs — while performing very, very well — are not the only reason. In fact, running backs have been responsible for just 81% of all rushing yards this year, which is the lowest since at least 2002:

[continue reading…]

{ 0 comments }

Rushing yards per carry continues to rise: a month ago, I noted that the league-wide yards per carry average was 4.34. If that held, it would set a new record, breaking the 4.29 mark set in 2011.

Since then, rushing efficiency has soared: since week 9, the Panthers are averaging over 6 yards per carry, 9 more teams are averaging over 5 yards per carry, and a total of 23 teams are averaging 4.29 YPC or better. The great rushing performance of the last month (4.61 YPC) has raised the 2018 league average mark to an incredible 4.44 yards per carry.

And yet, rushing quantity has never been lower. For the season, teams are rushing just 25.7 times per game, and even since week 9, that level is just 26.0 rushing attempts per game. This will go down as the season with the fewest rushing attempts in history, and also the season with the highest yards per carry average in history. The common theme here is passing: teams are passing more than ever, and defenses don’t seem very concerned about stopping the run. Offenses want to pass, and defenses are more than happy to allow teams to run (including via non-running back runs). That’s how you get crazy results like this.

And how crazy are these results? Well, take a look at the graph below, which shows every NFL season since 1932.  Each year is on the X-Axis, and there are two Y-Axes: the left Y-Axis shows yards per carry, and the right Y-Axis shows rushing attempts per game.  The NFL average yards per carry is shown in blue dots against that left Y-Axis, and the NFL rushing attempts per game is shown in red diamonds against the right Y-Axis.

{ 0 comments }

Previously:

I am short on time this week, so just a few notes:

The Chargers won with a -6.5 Game Script in Pittsburgh, while the Titans beat the Jets at home despite a -8.2 Game Script. The worst Game Script this year by a winning team was Green Bay at -9.3 in the season opener; the Titans game is the second lowest, followed by the Bears against the Cardinals in week 3, the Panthers in Philadelphia in week 7, and the Chargers/Steelers game. [continue reading…]

{ 0 comments }

On Sunday, the Jets lost to the Titans, 26-22. The Jets averaged 2.47 Adjusted Net Yards per Attempt, which is terrible; Tennessee averaged 7.05 ANY/A, which is a bit above average. In 2018, the average team is gaining 6.47 ANY/A. In other words, the Jets were 4.00 ANY/A below average, and Tennessee was +0.58 ANY/A above average.

Sadly for the Jets, that’s par for the course. There have been 21 games (out of 60) since the start of the 2015 season that the Jets were below average in passing offense and below average in passing defense. Here’s how to read the following graph:

X-Axis: Jets passing ANY/A, relative to league average
Y-Axis: Jets opponent’s passing ANY/A, relative to league average

Each year from 2015 to 2018 has a different data label, shown in the legend in the graph. But here’s the shorthand: dots to the left of the graph mean the Jets passing offense was bad; dots high in the graph mean the Jets passing defense was bad (because the opponent had a positive ANY/A relative to league average). Unfortunately for the Jets, things are getting worse: there are 6 large green dots (representing 2018) where the opponent was above average in ANY/A and the Jets were below average in ANY/A.

Here’s the raw data:

YearG#OppResultANY/AOpp ANY/ALg AvgRANY/AOpp RANY/A
201812TENL 22-262.477.056.47-40.58
201811NWEL 13-275.0910.426.47-1.393.95
201810BUFL 10-410.710.336.47-5.773.86
20189MIAL 6-130.513.716.47-5.96-2.76
20188CHIL 10-245.678.266.47-0.811.78
20187MINL 17-371.716.546.47-4.760.06
20186INDW 42-348.195.726.471.71-0.75
20185DENW 34-168.876.166.472.4-0.31
20184JAXL 12-314.439.36.47-2.042.83
20183CLEL 17-212.154.636.47-4.32-1.84
20182MIAL 12-205.6866.47-0.79-0.47
20181DETW 48-177.611.836.471.14-4.65
201716NWEL 6-265.185.315.91-0.73-0.6
201715LACL 7-141.717.755.91-4.21.84
201714NORL 19-312.57.675.91-3.411.76
201713DENL 0-23-0.166.335.91-6.070.43
201712KANW 38-319.7512.635.913.846.72
201711CARL 27-358.774.975.912.86-0.94
201710TAML 10-154.314.465.91-1.59-1.45
20179BUFW 34-217.486.045.911.570.14
20178ATLL 20-257.679.535.911.763.63
20177MIAL 28-316.57.355.910.591.44
20176NWEL 17-245.576.635.91-0.340.73
20175CLEW 17-145.246.195.91-0.660.28
20174JAXW 23-204.593.085.91-1.31-2.82
20173MIAW 20-610.122.65.914.21-3.3
20172OAKL 20-456.6110.365.910.74.45
20171BUFL 12-212.157.15.91-3.761.19
201616BUFW 30-107.813.446.221.59-2.78
201615NWEL 3-41-0.279.036.22-6.492.82
201614MIAL 13-342.6314.266.22-3.588.05
201613SFOW 23-174.174.866.22-2.05-1.36
201612INDL 10-412.6112.076.22-3.615.85
201611NWEL 17-229.366.526.223.150.3
201610LARL 6-944.76.22-2.22-1.52
20169MIAL 23-273.785.236.22-2.44-0.98
20168CLEW 31-286.725.566.220.51-0.66
20167BALW 24-168.483.136.222.26-3.09
20166ARIL 3-282.8276.22-3.40.78
20165PITL 13-316.449.486.220.223.26
20164SEAL 17-272.9310.246.22-3.284.02
20163KANL 3-24-1.866.896.22-8.080.67
20162BUFW 37-3111.1410.396.224.934.17
20161CINL 22-235.088.086.22-1.131.86
201516BUFL 17-222.186.076.26-4.08-0.2
201515NWEW 26-208.215.946.261.95-0.33
201514DALW 19-166.680.466.260.42-5.81
201513TENW 30-88.545.46.262.28-0.86
201512NYGW 23-207.796.926.261.530.65
201511MIAW 38-209.325.516.263.05-0.76
201510HOUL 17-243.028.366.26-3.242.1
20159BUFL 17-2244.96.26-2.26-1.36
20158JAXW 28-238.366.266.262.10
20157OAKL 20-345.7411.476.26-0.525.21
20156NWEL 23-307.886.616.261.610.35
20155WASW 34-209.542.696.263.27-3.58
20154MIAW 27-146.662.496.260.39-3.78
20153PHIL 17-243.074.416.26-3.2-1.85
20152INDW 20-76.83.656.260.54-2.62
20151CLEW 31-107.255.496.260.99-0.78

What do you think?

{ 0 comments }

It was a rough week 13 for many franchise quarterbacks.

But Patrick Mahomes was just fine, once against finishing as the top quarterback of the week.  It was yet another 4-TD, 120+ passer rating game for Mahomes, the fifth of this season.  By way of comparison, Jim Kelly and Joe Montana only had four such games in their entire careers.  Mahomes now has had a passer rating of at least 110 in 10 of 12 games this year, the second most by a player through 12 games in history (2011 Rodgers did it 11 times).

Of course, none of those stats are adjusted for era. But Mahomes is having a top-4 season for a 2nd-year quarterback since the merger even once you adjust for era, and arguably a top-2 season depending on how you feel about 2013 Nick Foles and a 28-year-old Kurt Warner in 1999. No, it’s not Dan Marino 1984, but it’s pretty clearly the best season a 23-year-old quarterback has had since Marino.

The full week 13 passing stats below: [continue reading…]

{ 0 comments }

It was not a happy birthday for Rodgers

Aaron Rodgers threw 50 passes on Sunday, but only threw for 233 yards. That’s very un-Aaron Rodgers like, who entered the day as the active leader in career yards per pass attempt. For his career, Rodgers averaged 7.87 yards per attempt prior to Sunday, but after yesterday’s performance — a 4.66 average — his career average dropped to 7.84.

Was this the worst game of Rodgers’s career? He had a game where he averaged 0.00 yards per attempt on one pass, but I don’t think you want to count that. He averaged 2.67 yards/attempt is a game against the Patriots in 2006, but he didn’t start the game and he threw just 12 passes. Maybe you prefer the 22-pass game against the 2015 Broncos as the worst Y/A game of his career, since he picked up just 3.5 yards per pass. Then again, there’s also this game against the Bills in 2014, where he averaged 4.4 yards per attempt on 42 passes; that feels even worse than the Denver game.

Because of the large variance in pass attempts, it’s hard to figure out what’s the worst Y/A game of a player’s career. But here’s one method I like: if you remove game X from a player’s career, how much does his career Y/A change? The game that causes the biggest change could be considered the best or worst game of that player’s career.

And by this methodology, the game against the Cardinals yesterday was in fact the worst game of Rodgers’s career. His career yards/attempt average is 7.840. Remove the game where he threw 1 pass for 0 yards, and his career Y/A is 7.841.  If instead you removed the 12-pass Patriots game, Rodgers’s career average would be 7.851.  If you instead removed the Denver game, his career average would be 7.858.  If the one game from Rodgers’s career you had to remove was that Bills game, his career Y/A would rise to 7.867.

But if you want to get his career Y/A average to 7.87, then you need to take out yesterday’s game.  That’s the game that has lowered his career average the most.  Take a look: [continue reading…]

{ 0 comments }

Marcus Mariota Needs To Throw More Incomplete Passes

Mariota is taken down for another sack.

Marcus Mariota is having the worst season of his career.  As a rookie in 2015, he ranked 22nd in ANY/A.  In 2016, he had a very strong year, finishing 8th in Adjusted Net Yards per Attempt. Last year, he fell back to 22nd in ANY/A, and this season, he ranks just 28th in ANY/A.

Of course, it’s important to know which statistics to examine. Mariota has completed 70.3% of his passes; before this year, his career best was a 62.2% rate as a rookie.  But there are two factors that make his completion percentage meaningless: one, completion percentage is rising league-wide, and more importantly, Mariota has taken a ton of sacks.

He has a 12.8% sack rate this year, easily the worst of his career.  What’s really remarkable is the interplay between his completion rate and his sack rate.  Mariota has thrown just 71 incomplete passes all season, while he’s taken 35 sacks.  That’s nearly a 2:1 ratio of incomplete passes to sacks!  By way of comparison, AFC South rival Andrew Luck has a ratio of nearly 13:1 — he’s thrown 138 incomplete passes and taken only 11 sacks.

There have been seven games this season where a quarterback had more sacks than incomplete passes: Mariota is responsible for 3 of those 7, and all 3 were losses (all other quarterbacks are 3-1 in such games): [continue reading…]

{ 0 comments }

The Bucs offense continues to fascinate me. Whether it’s Ryan Fitzpatrick or Jameis Winston, this passing offense continues to be very good but also very turnover prone. Tampa Bay has completed 67.0 percent of passes this season, but the Bucs have also thrown interceptions on 5.1% of all passes. We all know that interception rates have been falling and completion percentage rates have been rising over the last few decades. So let’s put these outlier stats in perspective.

Before the 2018 Buccaneers, the last two teams to have interception rates at 5% or higher were the 2013 Giants and 2010 Vikings. In other words, it’s pretty unusual for this era. And a 67.0% completion rate is pretty rare for older eras. Consider:

  • The 1980 Houston Oilers, with a 35-year-old Ken Stabler, completed 63.9% of passes and threw an interception on 6.0% of passes; that’s the highest completion percentage in history among teams to throw an INT on 5% of passes, but the Bucs are currently on pace to shatter that mark.
  • The 2001 St. Louis Rams, behind Kurt Warner, completed 68.8% of passes and threw an interception on 4.0% of passes.  That’s the highest interception rate among teams to complete 67% of their passes or better; the 2010 Saints (68.1%; 3.3%) and 1993 49ers (67.6%; 3.2%) are the only other teams with a completion percentage above 67% and an interception rate higher than even 3%.  The Bucs are currently blowing that mark out of the water, too.

The graph below shows the completion percentage (X-Axis) and interception rate (Y-Axis) for every team since 1950.  I have put all of the 2018 teams, through 12 weeks, in red dots.  And then the 2018 Bucs are the black dot at (67%, 5%): [continue reading…]

{ 0 comments }

Previously:

Buffalo and Jacksonville played a remarkably run-heavy game in week 12. The two teams combined for 393 rushing yards and just 267 passing yards. That means 59.5% of the total yards in this game came on the ground, making it the first time in a non-December game since 2012 that such a high percentage of yards came on the ground. Josh Allen had 101 yards on the ground prior to kneels, and Blake Bortles added 39 yards rushing.  These are two of the best running quarterbacks in the league, although the Bortles experiment may be ending in Jacksonville.

If this is the end for Bortles, he won’t be remembered as one of the best running quarterbacks ever, but perhaps he should be. He’s one of just six players in NFL history to average over 6 yards per carry and 20 rushing yards per game in his career (minimum 200 carries): [continue reading…]

{ 0 comments }

Checkdowns: Appearance on The Bill Barnwell Show Podcast

You can hear me on the Bill Barnwell podcast today discussing this article on why possession in the NFL matters more now than ever before, but first, you have to hear me talk about the 2018 Jets.

Listen here

Or on iTunes

My segment begins at 29:25.

{ 0 comments }

In 2008, Philip Rivers average 8.04 ANY/A, the best rate in the NFL.  This season, Rivers is averaging 8.96 ANY/A, and yet he ranks just fourth in that metric in 2018. That’s a sign of how far the passing environment has changed in the last decade.

Drew Brees led the NFL in ANY/A in 2009 with an 8.31 average; he’s currently having his best statistic season (without adjusting for era), with a 9.69 ANY/A average that would rank as the second best of the modern era.  He is the frontrunner in the MVP race, and for good reason: his team has the best record in football and he leads all QBs in ANY/A, a double feature that would surely lock up the MVP crown if it is still true by the end of the year.

Below are the season to date passing stats. [continue reading…]

{ 0 comments }

Marcus Mariota went 22/23 against the Texas and he averaged 13.2 yards per attempt. That sounds like it should be one of the great games in NFL history. So how come the Titans scored just 17 points and lost despite such a high completion percentage and no turnovers until the team’s final offensive play? Tennessee even set a new record for completion percentage in a loss! One reason is that the team punted six times, and you might be wondering how is that even possible to have 6 times as many punts as incompletions.

For starters, Mariota took a whopping 6 sacks, a 21% sack rate. And 7 of Mariota’s 22 completions were negative plays according to EPA. That includes three obvious ones: a 4-yard completion on 3rd-and-19, a 7-yard completion on 3rd-and-9, and a 7-yard completion on 3rd-and-8. (Tennessee went for it on 4th-and-1 after that, but failed; the other four failed third down plays that yielded to punts were two Mariota sacks, a Mariota scramble for 8 yards on 3rd-and-16 after another Mariota sack, and a rushing play on 3rd-and-29 following a 15-yard facemask penalty and yet another sack.) But there was also a 2-yard pass on 1st-and-10, a -1 yard completion on 2nd down, a 2-yard completion on 2nd-and-10, and even a 3-yard completion on 2nd-and-5 is considered a negative play (you’d rather re-do the down than take a 3-yard gain on 2nd-and-5). All of the sudden, Mariota’s 22/23 game turns into 15 positive completions on 29 dropbacks, which is a far different story. That’s still a good game, but not a great one, much less an all-time great one.

Mariota finished with the 5th-best performance of the week; below are your week 12 passing stats. [continue reading…]

{ 1 comment }

The college football regular season is over, with the exception of Army/Navy in two weeks. Below are the final ratings prior to the conference championship games: [continue reading…]

{ 0 comments }

Why Field Goals Are Less Valuable Than They Used To Be

Nearly two decades ago, David Romer analyzed data from games during the 1999, 2000, and 2001 seasons. Doug Drinen wrote a series of articles about his paper, and one of Doug’s key takeaways was that the value of possession following a kickoff was worth +0.6 points to the receiving team. The natural extension of this is that it means a touchdown is worth 6.4 points and a field goal worth 2.4 points. That also means that a touchdown isn’t just 2.33 times (7 divided by 3) as valuable as a field goal, but 2.67 times as valuable.

Now how did Romer derive that value of +0.6 points? Or, as Doug wrote, what does it mean to say that it is worth +0.5 points to the team with the ball to have 1st-and-10 at your own 20?

The half-a-point value of a first at the 20 includes not only the points that you might score on that drive, but also the points your opponent might score with the field position you’re likely to give them if you don’t score, and the points you’re likely to score with the field position they give you after they do or don’t score, and so on.

But we don’t need to go into the fine details of the system to get to what I want to talk about today. And that is possession has never been more valuable in the NFL. [1]One other reason: teams are better at making field goals, including from very far away, which means getting into likely field goal range requires less yardage than it used to for the offense.

The graph below shows the average points scored by the receiving team following a kickoff in each season since 1999. Note that this includes all quarters (Romer’s study was mostly limited to the first quarter) and all teams, and only includes points scored by the receiving team (Romer’s study focuses on net points (meaning points scored by the kicking team on the ensuing possession), so the numbers are of course lower). But the key is that teams are scoring more points after kickoffs than they did in the early ’00s.


[continue reading…]

References

References
1 One other reason: teams are better at making field goals, including from very far away, which means getting into likely field goal range requires less yardage than it used to for the offense.
{ 1 comment }

How to Calculate Drive Success Rate

Every 1st down represents a new set of downs that gives a team a chance another small battle against the defense.

Take the Saints, for example. How many 1st-and-10s (or 1st-and-goals or 1st-and-longer than 10s) have they had this year? By my count, 339. How did I get there? New Orleans has had 105 drives this year (more on that in a moment) and 282 first downs this year. Now remember that in the NFL, a touchdown is also a first down, and the Saints offense has scored 48 touchdowns this year. Therefore, New Orleans has recorded 234 non-scoring first downs. Add in the 105 1st downs that began every drive, and this means the Saints must have had 339 sets of downs this season.

Let’s look at the Jets for another example. New York has had 126 drives, 153 first downs, and 18 offensive touchdowns. Therefore, the Jets must have had 261 new sets of downs with which to operate.  This methodology should be a pretty accurate way of capturing the number of new sets of downs a team has, although it may be off by 1 or 2 for some teams. (For example, the Jets are probably at 260, not 261; one drive began with an interception but Trumaine Johnson fumbled the return.) You can’t use the actual number of first down plays, because teams often have multiple first down plays due to penalties on the same set of downs (think of a 1st-and-10 where a rusher gains 4 yards and a holding is called, and a team then has a 1st-and-16).

So to calculate the number of sets of downs a team has, you use this formula:

Drives + First Downs Made – Touchdowns

Now how do we calculate the number of drives? That’s pretty simple using the PFR Play Index.

Remember from our work on estimated drives, every drive ends in one of seven ways: [continue reading…]

{ 1 comment }

In 2017, Indianapolis ranked 30th in points and 31st in yards. The Colts also ranked 29th in Net Yards per Attempt and 31st in touchdown passes.

This year, with Andrew Luck back, the Colts rank 5th in points and 9th in yards, while ranking 13th in NY/A and 2nd in touchdown passes. No offense has improved more from 2017 to 2018 than the Colts, and Luck is a big reason why.

Early on this season, it looked like there was something wrong with Luck; through 3 games, he was averaging just 5.34 yards per attempt! Since then, he’s upped his average to 7.63 yards per attempt; that’s actually below the median over that time frame, but coupled with his stellar sack rate and remarkable TD/INT numbers, and he’s been a very valuable quarterback over the last two months.

There are three remarkable Luck numbers this season, but chances are you have only heard of two of them. The Colts star has now gone five straight games without a sack, making him just the 5th player since 1981 to go five straight games with 20+ pass attempts and zero sacks. And Luck has thrown at least 3 touchdown passes in seven straight games, a feat that puts him in even rarer company.

But perhaps the biggest reason for the Colts success right now is how excellent Luck has been on third downs. On average, teams have picked up a first down on 36.9% of all third down pass plays this year. Luck has done it at a rate of 51.9%, making him the most valuable third down passer this season. [continue reading…]

{ 0 comments }

Previously:

In week 11, the Ravens turned to Lamar Jackson, and responded with one of the most run-heavy games in recent memory. Baltimore rushed a whopping 54 times, the most in a non-overtime game since 2014. Jackson himself was responsible for half of those carries, 5 more than any player with at least five pass attempts in a game since 1950.

Not surprisingly, the Ravens dominated time of possession in this game, holding the ball for over 38 minutes. Jackson was an effective enough passer: he picked up a first down on 7 of 21 dropbacks, which is league average. We’ll see if this strategy can work for Baltimore once again — a quarterback running 15 times a week feels unsustainable, let alone 27 — but it certainly makes the Ravens more interesting.

Arizona and Jacksonville were your most run-heavy teams of the week. Leonard Fournette had 28 carries for the Jaguars, and the team rushed on 35.8% of all plays.  For the Cardinals, David Johnson had 25 carries, and Arizona had just 21 dropbacks, despite trailing for much of the second half.

The full week 11 Game Scripts below: [continue reading…]

{ 0 comments }

The Least-Conforming Game of 2018 Might Surprise You

There have been two really remarkable upsets this season: one at the time, and one particularly in retrospect.

In week 3, the Bills went on the road and hammered the Minnesota Vikings, 27-6. Buffalo was a 16.5-point underdog; this season, no other team has won a game as an underdog of more than 10 points. It was an anomaly of historic proportions, marking the first time a team was ever a 15-point underdog and won by 15 or more points.

The other remarkable game was in week 1, when the Saints lost at home to Tampa Bay. The Bucs are 2-7 since that game, while New Orleans is 9-0. So while it was a huge upset at the time — it is tied with Titans/Jaguars as the second biggest upset of the season (10-point spread) — it’s even more remarkable in retrospect. [continue reading…]

{ 0 comments }

Week 11 Passing Stats: The Stars Shine

The top 5 passers of week 11 consist of the three best QBs this season — Drew Brees, Patrick Mahomes, and Jared Goff — and the two quarterbacks who, at various times, have been considered the most valuable quarterback assets in the league: Andrew Luck and Aaron Rodgers.

Brees had zero sacks and zero interceptions while averaging over 12 yards per pass attempt and throwing for 4 TDs, making him the best passer of the week. Luck also had no sacks or interceptions, averaged over 10 yards per attempt, and threw 3 TDs. Rodgers averaged 11 yards per attempt and threw a pair of touchdowns, but his 5 sacks knocked him down below Luck. Mahomes had 478 yards and 6 TDs, but also 3 INTs and 3 sacks. Still, he averaged over 10 yards per attempt and threw 6 TD. It’s kind of a quirky stat, but Mahomes had by far the best passer rating in NFL history among players with at least 3 INTs in a game. Jared Goff took 5 sacks, but threw no interceptions and threw for 413 yards and 4 TDs.

The average ANY/A in week 11 was 6.24, making it a below-average week by 2018 standards. Below are the week 11 passing stats: [continue reading…]

{ 0 comments }

Reid looks up at the scoreboard and sees more points

Tonight is one of the games of the year: the 9-1 Chiefs against the 9-1 Rams. This is perhaps the best regular season game, by record, since another primetime game featuring Andy Reid’s Chiefs back in 2013, when the 9-0 Chiefs traveled to Denver to face the 8-1 Broncos.

Back then, I wrote about the best regular season matchups ever. And I’ve also written about the worst regular season matchups ever. And to be clear, there’s no right or wrong way to identify the best or worst matchup ever, even if you just base things on record.

You can’t use just winning percentage, because it’s hard to compare teams who have played a different number of games (is a matchup of two 3-0 teams better than a matchup of two 9-1 teams? I don’t think so, but winning percentage says otherwise). One solution is to add 11 games of .500 football to each team; in other words, add 5.5 wins and 5.5 losses to each team. For the Chiefs and Rams, that would make both teams 14.5-6.5, which translates to an adjusted winning percentage for both Kansas City and Los Angeles of 0.690. A game between two 3-0 teams would have an average adjusted winning percentage of only 0.607, which is one reason why I like this formula.

So where does Rams/Chiefs rank? With all due respect to the classic 49ers/Browns games from 1948, I’m limiting today’s post to games since 1950. And tonight’s matchup is the 20th best game during that period. The table below shows the best matchups in the NFL since 1950. Each game is listed from the perspective of the winner, and displays each team’s each team’s adjusted winning percentage and the average of the two adjusted records. Finally, I’ve included a linkable boxscore to each game. [continue reading…]

{ 0 comments }

Ohio State has beaten Michigan 13 times in the last 14 years. And the only time since 2003 that Michigan beat Ohio State was in 2011, when the Buckeyes were 6-6 and in the bridge year between Jim Tressel and Urban Meyer. And Ohio State nearly pulled off the upset!

For a rivalry known as The Game, it’s been remarkably one-sided for a long time: the last time Michigan beat an Ohio State team of any note, Santonio Holmes and Braylon Edwards were the stars of the game. It’s been awhile.

And yet, this year, both teams are likely in control of their own destiny. The winner of Saturday’s matchup will win the Big 10 East, and head to Indianapolis to face Northwestern in the Big 10 title game. A win there all but guarantees a playoff spot for a 12-1 Michigan team, and a 12-1 Ohio State team would be a favorite to make the college football playoff, too.

Here’s how I’d rank each team’s chances of being one of the four to make the College Football Playoff. Read it as such: keep going down the list until you find four teams that actually exist.

1. SEC Champion Alabama
2. ACC Champion Clemson
3. SEC Champion Georgia
4. 12-0 Notre Dame
5. B10 Champion Michigan

—– Those 5 teams are all “win out and they’re in”, although I note that if Georgia narrowly beats Alabama in an epic SEC Championship Game, there will be some murmurs to take an 12-1 Alabama over a 12-1 Michigan. Both teams will have lost to two playoff teams (Georgia, Notre Dame), and Alabama had been more dominant throughout the season. But the committee seems to value conference championships pretty highly, so I think they would go with Michigan.

6. 12-1 Bama (losing in the SEC Championship Game)
7. 12-1 Big 10 Champion Ohio State
8. 12-1 Big 12 Champion Oklahoma

—– This is the real pressure point for the committee: do you take a 12-1 Ohio State over a 12-1 Oklahoma? The Buckeyes have a much, much worse loss and arguably a tougher schedule. Oklahoma is, subjectively, a better team, too. But the Big 10 has been the better conference this season, and my gut is the committee would take Ohio State at 12-1 over Oklahoma at 12-1. I’d go the other way.

9. 12-1 Pac-12 Champion Washington State

—– Last year, the Pac-12’s best team was USC, and the Trojans playoff hopes were dashed with a Friday night loss on the road against Washington. This year, the Pac-12’s best team is Washington State, and the conference’s best chance to send a team to the playoff was crushed by a Friday night road loss to … USC. Washington State has had a great year, but there are zero notable non-conference games and the Pac-12 as a whole is a down conference. As such, even going 12-1 isn’t enough if there’s a 12-1 conference champion (or a 12-0 Notre Dame or a 12-1 Alabama) still out there.

10. 12-1 Clemson (L-ACCCG)
11. 11-1 Notre Dame

—– Chaos needs to ensue for us to get here.

12. 13-0 UCF
13. B12 Champion West Virginia

Below are the college football SRS ratings through 12 weeks. [continue reading…]

{ 0 comments }

Aaron Rodgers On Pace To Set Interception Record

Aaron Rodgers has thrown just one interception in 10 games this year. That’s 1 interception on a league-high 385 pass attempts. And this was it:

Damon Huard (2006) holds the current record for interception rate in a season at 0.4%; he threw 1 interception on 244 passes, so to beat him, a quarterback would need to either throw no interceptions and 224 passes (to qualify), 1 interception on more than 244 passes, 2 interceptions on more than 488 passes, or 3 interceptions on more than 672 passes. Rodgers has 1 interception so far this year on 385 pass attempts (0.26%!); he has room to throw one more interception this year and still win the crown, but he probably doesn’t have wiggle room to throw two more.

Josh McCown (2013) had 1 interception on 224 pass attempts (0.4%), putting him second all-time on the single-season list. Tom Brady (2016), Nick Foles (2013), Tom Brady (2010), Dak Prescott (2016), Steve DeBerg (1990), Sam Bradford (2016), and David Garrard (2007) are the only other players to throw fewer than 1 interception for every 100 passes in a season, min 14 pass attempts per team game. (Oh, and Drew Brees has a 0.3% interception rate this year, too: he has 1 interception on 304 passes).

Interceptions rates have plummeted, of course, so it’s hard to truly compare this season by Rodgers to some of the low interceptions of years past. Here’s the league average interception rate in every season since 1970:

Another thing that makes Rodgers’ 2018 interception rate so interesting, particularly compared to Brees, is that Rodgers has thrown a lot of incomplete passes. In fact, he’s thrown more than twice as many incomplete passes as Brees — 147 to 69. The graph below shows every player this season with an interception (no regular quarterback has zero interceptions). The X-Axis shows interceptions; the Y-Axis shows incomplete passes. Rodgers really stands out here, and while you didn’t need the help finding him, I colored his dot in Packers colors:

Rodgers is tied with Joe Flacco for the league lead in incomplete passes at 147, and yet he is also tied with Brees for the fewest interceptions among qualifying passers. That’s how extreme Rodgers has been this year. Consider that Rodgers has thrown an interception on just 0.7% of his incomplete passes; Brees ranks second with an interception on 1.4% of his passes, and nobody else has thrown an interception on fewer than 2.8% of interceptions. Huard in 2006 (1.0%) currently has the record for interception rate on incomplete passes, and that’s another mark Rodgers has in his sights.

It’s been an up-and-down year for Rodgers. For example:

  • His winning percentage is below .500, the worst of his career since his first year as a starter in 2008.
  • His touchdown rate is below 5.0% for the first time in his career.
  • His completion percentage is 62%, the second lowest of his career.

On the other hand, his sack rate is slightly better than his (not very good) career average, his yards/attempt is slightly better than (his remarkably good) career average, he’s averaging more passing yards/game than any season other than 2011, and he’s posting by far the best interception rate of his career, which has been littered with remarkable interception rates.

Rodgers entered the season with a remarkable TD/INT ratio, and it’s only gotten better.  He’s now at 4.20/1, easily the best in history (only Brady and Russell Wilson — both are at 3.02 to 1 — have more than 3 touchdown passes for every interception).  And while it’s been a rough year for Rodgers, he’s in position to set a new record in 2018.

{ 1 comment }

Punting on 4th-and-2, Trailing, Late in the Game

Last night, Mike McCarthy decided to punt on 4th-and-2, from the Green Bay 33-yard line, with 4:20 remaining and the Packers trailing the Seahawks 27-24. Aaron Rodgers never again took the field, as Seattle picked up two first downs and ran out the clock.

Since 2008, there have been 17 examples where a team trailed by 1-7 points, in the final 5 minutes of the game, and punted on 4th and short (1, 2, or 3 yards).

Three times, those teams won: JaMarcus Russell and the Raiders pulled it off against the Broncos in 2009, Russell Wilson and the Seahawks famously defeated the Patriots in 2012 in this situation, and Derek Carr and the Raiders pulled it off against the Chiefs in 2017.

In his career, Rodgers has had 99 cases where the Packers had a 3rd-and-2 or 4th-and-2 from at least 30 yards away from the end zone. Green Bay picked up a first down 55% of the time.

What do you think?

{ 0 comments }

Week 10 (2018) Game Scripts

Previously:

No time for commentary from me today, but here are the Week 10 Game Scripts.

TeamH/ROppBoxscorePFPAMarginGame ScriptPassRunP/R RatioOp_POp_ROpp_P/R Ratio
BUF@NYJBoxscore41103120.4274637%371867.3%
NOR@CINBoxscore51143720.3274736.5%271662.8%
PITCARBoxscore52213119.4283048.3%342260.7%
CHIDETBoxscore34221215.3312258.5%482466.7%
TENNWEBoxscore34102412.3273642.9%461970.8%
GNBMIABoxscore3112199.5302554.5%432365.2%
CLEATLBoxscore2816128.5212942%541974%
KANARIBoxscore2614128332358.9%442563.8%
INDJAXBoxscore292637292355.8%383452.8%
LAC@OAKBoxscore206145.8272650.9%412166.1%
WAS@TAMBoxscore163134.4292652.7%432464.2%
DAL@PHIBoxscore272073.7402858.8%461674.2%
LARSEABoxscore363150.5412364.1%303446.9%
NYG@SFOBoxscore27234-1.5322358.2%392957.4%
{ 0 comments }

For purposes of grading each team’s passing attack in each season since 2002, let’s look at where each team ranked in Adjusted Net Yards per Attempt. Next, let’s group teams into 5 buckets of four teams each based on the following ranks:

— Best passing offenses — i.e., the teams that rank 1, 2, 3, and 4 in ANY/A
— Good passing offenses — those teams that rank 8, 9, 10, and 11
— Average passing offenses — teams that rank 15, 16, 17, and 18
— Bad passing offenses — teams that rank 22, 23, 24, and 25
— Worst passing offenses — teams that rank 29, 30, 31, and 32

I went ahead and calculated the ANY/A of those teams for each season since 2002. In the graph below, I’ve plotted the results, taking the average ANY/A of those teams.

The most remarkable part of this: in 2018, the teams that rank 22nd, 23rd, 24th, and 25th in pass efficiency have an average ANY/A of 5.86. In 2002 and 2003, the teams that ranked 8th, 9th, 10th, and 11th in ANY/A had average ANY/A of 5.82 (’02) and 5.84 (’03). Those same teams are at 7.17 this year.

What stands out to you?

{ 0 comments }

In March, the Jets inexplicably signed Josh McCown to a 1-year, $10M contract.

A few days later, the Jets sent three 2nd round picks along with the 6th pick in the 2018 Draft to Indianapolis to move up to the 3rd spot. That made the McCown signing even more odd in retrospect:

The Jets have mucked up the quarterback position for as long as anyone can remember, and you can add giving McCown $10M to Mike Maccagnan’s tab next to “trading up for Bryce Petty,” “using a second round pick on Christian Hackenberg”, and “sending a fortune to get a top-3 quarterback prospect”, and “getting into a stalemate with a journeyman quarterback and then giving him $12M.”

On Sunday, McCown was the worst quarterback in football. Paying $10M to a quarterback coach is not justifiable, and paying $10M to a quarterback mentor — whose mentees include Hackenberg, Petty, Johnny Manziel, and Mike Glennon — only works if he can be a great backup quarterback on a team in need of a great backup quarterback.

The full week 10 passing stats below:

RkQuarterbackTmOppResultAttYdsTDIntSkYdsANY/AVALUE
1Ben RoethlisbergerPITCARW 52-2125328501616.23243
2Mitchell TrubiskyCHIDETW 34-2230355301713.16195
3Drew BreesNORCINW 51-1425265300013153
4Baker MayfieldCLEATLW 28-1620216300013.8139
5Andrew LuckINDJAXW 29-2629285310010.34101
6Blake BortlesJAXINDL 26-293832020009.4799
7Matt BarkleyBUFNYJW 41-1025232201810.1585
8Marcus MariotaTENNWEW 34-1024228202149.7775
9Jared GoffLARSEAW 36-3139318202118.4665
10Philip RiversLACOAKW 20-62622321118.0432
11Carson WentzPHIDALL 20-2744360212107.529
12Patrick MahomesKANARIW 26-1428249205377.6425
13Jeff DriskelCINNORL 14-5134500001524
14Eli ManningNYGSFOW 27-233118830187.520
15Aaron RodgersGNBMIAW 31-1228199202177.416
16Darius JenningsTENNWEW 34-1012100002114
17Ryan FitzpatrickTAMWASL 3-164140602287.1613
18Logan ThomasBUFNYJW 41-101150000158
19Brian HoyerNWETENL 10-3417000070
20Julian EdelmanNWETENL 10-341600006-1
21Logan CookeJAXINDL 26-291400004-3
22Russell WilsonSEALARL 31-3626176304356.7-5
23Teddy BridgewaterNORCINW 51-141000000-7
23Taysom HillNORCINW 51-141000000-7
25Dak PrescottDALPHIW 27-2036270104316.48-16
26Alex SmithWASTAMW 16-32717810386.33-16
27Joshua DobbsPITCARW 52-212-30000-1.5-17
28Matt RyanATLCLEL 16-2852330202196.5-20
29Dontrell HilliardCLEATLW 28-16100100-45-52
30Tom BradyNWETENL 10-3441254003235.25-71
31Derek CarrOAKLACL 6-2037243004404.95-79
32Nick MullensSFONYGL 23-273925012004.62-88
33Cam NewtonCARPITL 21-5229193215464.18-91
34Andy DaltonCINNORL 14-5120153124242.46-106
35Matthew StaffordDETCHIL 22-3442274226453.73-151
36Brock OsweilerMIAGNBL 12-3137213016502.74-177
37Josh RosenARIKANL 14-2639208125422.18-206
38Josh McCownNYJBUFL 10-4134135023190.7-228
Total92571445018695096.87

This was another remarkable week for NFL passers, who completed 630 of 925 passes (68.1%) for 7,144 yards, with 50 TDs and just 18 INTs. That translates to a 100.9 passer rating, and there were 19 quarterbacks who had a passer rating of over 100 and threw 20+ passes. This came despite there being just 28 teams active in week 10! The quarterbacks took 69 sacks for 509 yards, and finished with a 6.87 ANY/A average. It was yet another remarkable passing week in the best passing season of all time.

Finally, let’s look at the full season passing stats: you have Philip Rivers at #4, and in front of him is a rival quarterback from his own division, a rival quarterback from his own city, and his former teammate. And the bottom three are all rookies, in a narrative twist from the “why are rookies all of the sudden good” trend we had seen in recent years:

RkQuarterbackTmAgeAttYdsTDIntSkYdsANY/AValue
1Patrick MahomesKAN23345315031717959.28994
2Jared GoffLAR243323134226191149.09895
3Drew BreesNOR3930426012119719.28859
4Philip RiversLAC37272245921412759.24767
5Matt RyanATL333533015213241638.32672
6Ryan FitzpatrickTAM36225219917913698.68509
7Ben RoethlisbergerPIT36369288821712797.65423
8Aaron RodgersGNB353552741171251867.5366
9Carson WentzPHI262692148153231567.39248
10Mitchell TrubiskyCHI242902304197181147.32242
11Deshaun WatsonHOU232852389177301497.19206
12Russell WilsonSEA302471967215292047.09154
13Tom BradyNWE413712748177161116.88132
14Kirk CousinsMIN303632685175241416.87129
15Cam NewtonCAR292922086175171306.751
16Andrew LuckIND29371247226910766.5920
17Alex SmithWAS34301204510319996.28-81
19Blake BortlesJAX26328234112818896.16-130
20Andy DaltonCIN3131222551810201536.06-158
21Derek CarrOAK273202441108281696.07-163
22Matthew StaffordDET303312385168291816.01-189
23Eli ManningNYG373462565116322396.02-195
24Brock OsweilerMIA28178124764161245.48-205
25Joe FlaccoBAL33379246512616795.96-226
26Marcus MariotaTEN25203149875251495.54-226
27Baker MayfieldCLE232851984137221545.78-232
28Dak PrescottDAL252731930115321845.71-253
29Jameis WinstonTAM24148118161013604.91-261
30C.J. BeathardSFO25169125287181565.03-281
31Case KeenumDEN3033024001110241745.64-318
32Josh AllenBUF2213983225211673-566
33Josh RosenARI21208128068211553.86-612
34Sam DarnoldNYJ2128919341114211294.5-632
Lg Avg00104677879152324574849126.540

What stands out to you?

{ 0 comments }
Next Posts Previous Posts