≡ Menu

Previously:

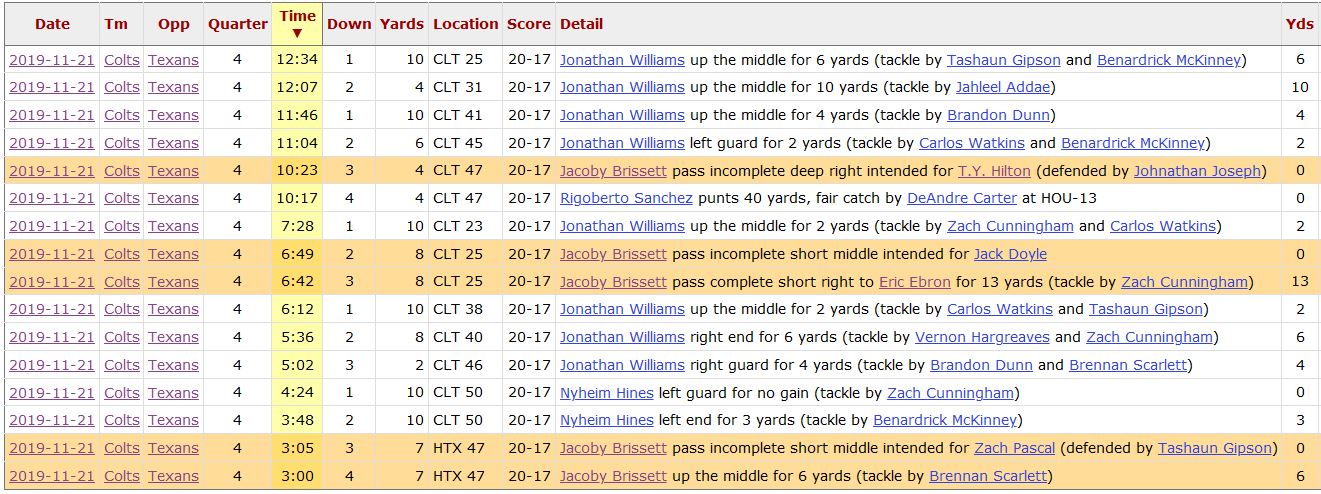
Jacksonville won with a Game Script of -8.1 on Sunday, giving the Jaguars one of the best comebacks of the season. Jacksonville started the game with a 65-yard drive, then had drives of 3 yards, -5 yards, -2 yards, 14 yards, and 6 yards. Jacksonville trailed 16-3 in the third quarter, but the team responded with a 72-yard field goal drive, a 53-yard TD drive, and a 56-yard TD drive to steal a victory in Oakland.

The Steelers were the most pass-happy team of the week, which was pretty odd considering how poorly Devlin Hodges played. Pittsburgh had a positive Game Script for the week, but Hodges still finishes with 42 dropbacks. James Conner finished with only 8 carries for 42 yards, although a costly fumble on a wildcat play perhaps led the Steelers towards a more pass-happy game plan. Hodges finished with just 8 first downs (a 19% rate), so nothing was really working for Pittsburgh against a tough Bills defense.

TeamH/ROppBoxscorePFPAMarginGame ScriptPassRunP/R RatioOp_POp_ROpp_P/R Ratio
NORINDBoxscore3472717303347.6%351767.3%
DALLARBoxscore44212314.9234533.8%541479.4%
BALNYJBoxscore42212114253442.4%332457.9%
TAM@DETBoxscore38172112.6442960.3%451871.4%
KANDENBoxscore2332012.4372559.7%421573.7%
MIN@LACBoxscore39102910.4253740.3%421968.9%
SEA@CARBoxscore3024610.3293446%432959.7%
ARICLEBoxscore3824148.7253442.4%442365.7%
GNBCHIBoxscore211388.4342458.6%562767.5%
NWE@CINBoxscore3413217.4313249.2%313249.2%
HOU@TENBoxscore242135.7283544.4%392858.2%
NYGMIABoxscore3620165.1303347.6%442563.8%
BUF@PITBoxscore171071.6263840.6%421573.7%
PHI@WASBoxscore372710-1.5452861.6%282354.9%
ATL@SFOBoxscore29227-2.1412067.2%352756.5%
JAX@OAKBoxscore20164-8.1312258.5%403255.6%

The Cowboys, Bills, and Bengals stood out as the most run-heavy teams of the week. Dallas ran on 66% of its plays against the Rams in week 15, making it the most run-heavy game the Cowboys have had in 13 years! How long ago was that? This game came four weeks before Tony Romo‘s first start!

Meanwhile, the Bengals had another week of giving up. No, this wasn’t quite as bad as the run-heavy performance in a blowout loss to Baltimore, but Cincinnati finished with 31 pass attempts and 31 rush attempts in a blowout loss to the Patriots.  A 50/50 run/pass split is pretty rare in most games, but very rare when the Game Script is -7.4.  On the other hand, Andy Dalton was very bad — he threw a pick 6 on top of three other interceptions — and Joe Mixon actually had a strong day on the ground. So maybe this wasn’t the worst strategy for Cincinnati.

What stands out to you?

{ 0 comments }

Kyle Allen and Patrick Mahomes are at opposite ends of the quarterback spectrum. Allen was an undrafted free agent; Mahomes is one of the most talented quarterbacks in league history and was the 2018 NFL MVP.

Allen ranks 32nd out of 34 qualifying quarterbacks in the most basic (in a good way) of passing stats: net yards per attempt.

Mahomes ranks 1st this year in NY/A, after ranking 1st in the same stat last year among quarterbacks who started at least 8 games.  Net yards per attempt is a good stat, and Mahomes is excellent at it because he’s an excellent quarterback (or maybe vice versa).

But you know better than to expect this to be a “Mahomes good Allen bad” post. Because I did a triple take this morning when I noticed that Kyle Allen has thrown for first downs at a higher rate this season than Mahomes.  That seemed impossible, and I had to double check twice just to make sure the data wasn’t wrong.

In general, there is a significant correlation between Net Yards per Attempt (which is passing yards, net of sack yards lost, divided by pass attempts plus sacks) and Passing 1st Down Rate (which is passing first downs divided by pass attempts plus sacks).   Both of these are very good stats to measure quarterback play, and last year, Mahomes led the NFL with a 43.2% passing first down rate.   Passing 1st Down Percentage is a good quick and dirty stat, and one where the best quarterbacks tend to fare very well. It is certainly not biased against a player like Mahomes.  But this year, Mahomes ranks 13th in that metric despite still having a very good NY/A average, while Allen shockingly ranks 11th in the metric.

So we have two pretty good, and easy to calculate passing stats, that in general are very correlated.  How correlated? Take a look at the graph below, which shows the same data as the table above.  And while the logos are for teams, the data  is for individual quarterbacks, not team-level data. So the Jets logo is only Sam Darnold, not the full Jets passing stats in 2019. And for the Redskins, Titans, and Steelers, it’s Dwayne Haskins, Ryan Tannehill, and Mason Rudolph in the chart below.  The Panthers, and to a lesser extent, the Chiefs, stand out as a notable outlier: [continue reading…]

{ 33 comments }

Previous Passing Stats:

It finally happened: last night, Drew Brees threw 4 touchdown passes, to pass Peyton Manning and to move into first place on the all-time passing touchdowns list. A few years ago, Bryan Frye detailed the history of the passing TD crown, from Benny Friedman to Manning.  Manning held the record for a little over 5 years, while Brees may not hold the record for very long at all if Tom Brady gets his way.  The shortest reign belongs to Bobby Layne, who held it for just over a year.

Oh, and Brees also set a record for the best completion in NFL history by a quarterback with more than 10 passes (trivia note: Kurt Warner holds the record, at 10, for most passes in a game without an incompletion).  Brees completed 29 of 30 passes, and he did that without taking a sack, either (Warner took two in his 10/10 game).  In the list of games with just one incompletion, everyone with more than 18 pass attempts had at least four sacks.  To complete 29 passes on 30 dropbacks is remarkable.  Only Steve Young (here)  and Warner (here) have had a game with 20+ attempts and less than three combined sacks and incomplete passes.

The table below shows the week 15 passing stats. The top passers of the week were Jameis Winston, Drew Brees, Lamar Jackson, and Russell Wilson, which is hardly surprising… but Dwayne Haskins also cracked the top group, along with Dak Prescott and Patrick Mahomes. The full week 15 passing stats below. [continue reading…]

{ 0 comments }

#NFL100 – Top 6 Outside Linebackers

Previously: Running Backs; Defensive Ends; Defensive Tackles

As you know, the NFL is announcing its top 100 players in league history as part of the league’s 100-year anniversary. The nominating committee selected 12 outside linebackers [1]There are three players with labeling issues to discuss here: Chuck Bednarik, Clarke Hinkle, and Junior Seau (who isn’t on the above list). We will get to them at the end of this article. as finalists, and with the exception of the lone active player (Von Miller), every player is in the Hall of Fame. For the final team, 6 outside linebackers were chosen. The table below shows the finalists and those selected for the official team: [continue reading…]

References

References
1 There are three players with labeling issues to discuss here: Chuck Bednarik, Clarke Hinkle, and Junior Seau (who isn’t on the above list). We will get to them at the end of this article.
{ 0 comments }

Marcus Peters Is Impossible

Marcus Peters was drafted by the Kansas City Chiefs in 2015. That year, he led the NFL in four categories: interceptions (8), interception return yards (280), interceptions returned for touchdowns (2), and passes defended (26).

Two years later, Peters again led the NFL in interception return yards, with 137 on 5 interceptions. The next season, with the Ravens, he had 107 return yards on three interceptions.

This year? He’s recorded 5 interceptions for 210 yards and 3 touchdowns — leading the NFL in all three categories — while splitting his time between the Rams and Ravens.

Since the start of the 2015 season, Peters has 27 interceptions; no other player has more than 17 (Darius Slay).  Over half of his interceptions have brought above over 20 yards, and he has just 6 interceptions where he hasn’t returned the pass.

Since the start of the 2015 season, Peters has 6 picks six; Aqib Talib is second with 4, and no other player has more than three.

Since the start of the 2015 season, Peters has 797 interception return yards; that’s over 150 more yards than the number two and three players (Talib and Stephon Gilmore) combined. Peters has produced a monstrous edge in this category since entering the league. [continue reading…]

{ 0 comments }

Week 14 (2019) Game Scripts: The League Goes Run-Heavy

Previously:

One of the big upsets of the year came in week 14: the Broncos were 8-point underdogs to Houston, and jumped out to a 31-3 halftime lead.  That sort of blowout by a large underdog only happens about once every two years.  There was also a large comeback in week 14, as the Eagles beat the Giants with a -6.4 Game Script. The Giants raced ahead to a 17-3 halftime lead, but Philadelphia scored three touchdowns — one in each of the final three quarters — to win, 23-17.

It was a pretty run-heavy week 14; no team passed on even 71% of their plays. There were 6 games in week 13 where a team passed on at least 71% of plays, and then zero last week. If you squint, you could call the Giants, Cowboys, and Colts pass-happy last week, but none were all that one-sided.  The full Game Scripts data below:

TeamH/ROppBoxscorePFPAMarginGame ScriptPassRunP/R RatioOp_POp_ROpp_P/R Ratio
DEN@HOUBoxscore38241418.5282750.9%532270.7%
LAC@JAXBoxscore45103516.4283048.3%402363.5%
MINDETBoxscore2071311.7313944.3%452267.2%
LARSEABoxscore2812169.6323547.8%412166.1%
ATLCARBoxscore4020209.1353252.2%462267.6%
GNBWASBoxscore201558.7322853.3%312852.5%
CHIDALBoxscore312476.4333449.3%512269.9%
BAL@BUFBoxscore241776.3263344.1%452465.2%
TEN@OAKBoxscore4221216273245.8%352558.3%
KAN@NWEBoxscore231675.7412958.6%402264.5%
PIT@ARIBoxscore231765.1223538.6%352261.4%
CLECINBoxscore271983.1252748.1%413156.9%
NYJMIABoxscore222112.3373253.6%392759.1%
SFO@NORBoxscore48462-1.1392461.9%412760.3%
TAMINDBoxscore38353-4.2502864.1%372262.7%
PHINYGBoxscore23176-6.4533262.4%322061.5%


Meanwhile, Pittsburgh, Baltimore, and Washington were all pretty run-heavy.  The Redskins/Packers game reminded me a bit of the Broncos/Packers game from week 3; the Packers controlled the game, but the other team still deployed a run-heavy game plan.  Dwayne Haskins had 31 dropbacks (and no rushing attempts other than a kneel), while Adrian Peterson and company had 26 carries.  Washington opened the game with 3 3-and-outs. The first one was run for 0, run for 1, sack. The second was sack, incomplete pass, pass for 9. The third was run for 3, run for 6, incomplete.  Give the Redskins credit for variety, at least.

With the Ravens, we expect run-heavy game plans every week, and week 14 was no exception.  Lamar Jackson had 26 passing plays, while Baltimore had 33 runs (two kneels).  Interesting, none of Jackson’s 10 runs were scrambles.

As for the Steelers, Devlin Hodges led a run-heavy game plan with Pittsburgh, made easier by an 85-yard punt return touchdown in the first quarter. Against the Cardinals, Hodges went 16 for 19 for 152 yards with a TD and three sacks; he also had 4 scrambles. Pittsburgh’s running game wasn’t particularly effective, as the running backs had 28 carries for 98 yards and just three first downs.  But Hodges picked up 12 first downs on his 26 dropbacks (including scrambles), and that was enough — along with a strong Steelers defense — to carry the day.

{ 0 comments }

Lamar Jackson Leads The NFL In Adjusted Passer Rating

Jackson is the overwhelming favorite to win the MVP award.

Six years ago, I wrote about tweaking the passer rating formula. I am going to update that article today, to better analyze the remarkable season that Ravens second-year quarterback Lamar Jackson is having.

The main updates:

1) There’s no reason to exclude sack data from passer rating. Sacks happen on passing plays, and a quarterback should *not* get more credit in the passer rating formula for taking a sack rather than throwing an incomplete pass.

2) Scrambles should be treated like completed passes, and rushing yards should be counted the same as passing yards. I am going to broaden this today to include all rushing attempts, excluding kneels. A 10-yard run is just as valuable as a 10-yard pass, and a scramble on 3rd down should impact completion percentage the same way a check down to the running back does.  However, I am going to exclude all kneels from the data, which really shouldn’t be recorded as rushing plays to begin with.

3) Rushing touchdowns should be counted with passing touchdowns. This is self-evident.

4) Lost Fumbles should be counted with interceptions. Also self-evident.

Passer rating consists of four metrics, all weighted equally: completions per attempt, yards per attempt, touchdowns per attempt, and interceptions per attempt. I will use the same formula with the same weights and the same variables, but redefine what those variables are. Here are the new definitions, with the additions in blue. I have then shown the 2019 results, using the data as of this morning (i.e., through 14 weeks, plus the Ravens/Jets Thursday night game in week 15), for the 32 players with the most pass attempts so far this year. [continue reading…]

{ 1 comment }

#NFL100 – Top 7 Defensive Tackles

Previously: Running Backs; Defensive Ends

As you know, the NFL is announcing its top 100 players in league history as part of the league’s 100-year anniversary. The nominating committee selected 17 defensive ends as finalists, and with the exception of three non-eligible players (Peppers, Watt, Ware) every player is in the Hall of Fame. For the final team, 7 defensive ends were chosen. The table below shows the finalists and those selected for the official team:

PlayerTeam(s)First YrLast YrSelected?
Buck BuchananKansas City Chiefs19631975Selected
Joe GreenePittsburgh Steelers19691981Selected
Bob LillyDallas Cowboys19611974Selected
Merlin OlsenLos Angeles Rams19621976Selected
Alan PageMinnesota Vikings; Chicago Bears19671981Selected
John RandleMinnesota Vikings; Seattle Seahawks19902003Selected
Randy WhiteDallas Cowboys19751988Selected
Curley CulpKansas City Chiefs; Houston Oilers; Detroit Lions19681981Finalist
Art DonovanBaltimore Colts; New York Yanks; Dallas Texans; Baltimore Colts19501961Finalist
Cortez KennedySeattle Seahawks19902000Finalist
Gene LipscombLos Angeles Rams; Baltimore Colts; Pittsburgh Steelers19531962Finalist
Leo NomelliniSan Francisco 49ers19501963Finalist
Warren SappTampa Bay Buccaneers; Oakland Raiders19952007Finalist
Tom SestakBuffalo Bills19621968Finalist
Ernie StautnerPittsburgh Steelers19501963Finalist
Bill WillisCleveland Browns19461953Finalist

The Great Decade

Is it really possible that the 4 best defensive tackles in history were all in their primes at the start of the 1970s?

Bob Lilly entered the NFL in 1961. Merlin Olsen joined a year later. Alan Page was drafted in 1967, and Joe Greene was picked two years later.

When Brad Oremland did his series on the greatest defensive tackles in history, he ranked these four as the top four ever: he ranked Page at 30, and put Greene at 16, Olsen at 13, and Lilly at 12. As Brad noted:

Associated Press first-team All-NFL defensive tackles, 1964-75: (1964) Bob Lilly and Henry Jordan, (1965) Bob Lilly and Alex Karras, (1966) Bob Lilly and Merlin Olsen, (1967) Bob Lilly and Merlin Olsen, (1968) Bob Lilly and Merlin Olsen, (1969) Bob Lilly and Merlin Olsen, (1970) Merlin Olsen and Alan Page, (1971) Bob Lilly and Alan Page, (1972) Joe Greene and Mike Reid, (1973) Joe Greene and Alan Page, (1974) Joe Greene and Alan Page, (1975) Curley Culp and Alan Page. That’s seven selections for Lilly, five for Olsen, five for Page, three for Greene (he added a fourth in 1977), and four for everyone else combined.

That’s a mean vertical leap.

Lilly, Olsen, Page, and Greene were more or less contemporary, competing with one another for honors — Lilly, Olsen, and Page especially, since they all played in the NFC. Lilly, for instance, almost certainly would have been first-team All-Pro in 1970 if Olsen and Page hadn’t both been in their primes at the same time. The All-Pro and Pro Bowl honors showered upon these players actually undersell how dominant they were. I tend to be skeptical about claims that all the greatest players were from the same era, especially when that era is the ’60s and early ’70s — but Lilly, Olsen, Page, and Greene really were the most outstanding defensive tackles in the history of professional football. Until Aaron Donald logs a couple more seasons, only Randy White is really even close.

In Sean Lahman’s Pro Football Historical Abstract, he ranks Olsen was the best defensive tackle ever, Lilly as the second-best, Green as his third-best, and Page as his fifth-best. Only Randy White — who, yes, has a very strong claim to being a top-5 DT ever — breaks the chain, as Lahman ranks White (drafted by the Cowboys in ’75 months after Lilly retired) fourth.

John Turney ranked the top 4-3 DTs ever last summer. Turney ranked Lilly as the best ever, followed by Greene, Olsen, and Page, and then White a tier below but in fifth place.

Bryan Frye put Page, Lilly, Greene, and Olsen on his personal DT Mt. Rushmore. At this point, I’d like to remind you that Page is typically ranked 4th among this group, and Frye noted that Page was the best DT in the league for 4 different seasons, with the other three all active those years.  In ’73, Page was the Defensive Player of the Year according to both the Professional Football Writers of America and the Newspaper Enterprise Association (Dolphins safety Dick Anderson, who led the NFL in interceptions and pick sixes, won the AP award). In 1971, Page won the AP MVP award — not the Defensive Player of the Year award, but the MVP award.  In 1970, Page was named the NFC Defensive Player of the Year (in a conference featuring Lilly and Olsen) by the NEA, and easily being named a consensus first-team All-Pro.  He was better that year than a 2nd-year Greene (who lost out on the AP’s All-AFC team to Jets DT John Elliott).  And in 1969, Page was one of the stars of arguably the greatest defense of all time.  He also was the NFC Defensive Player of the Year in 1974, although Greene was the AFC DPOY and overall DPOY.  So Page, playing in the most star-studded DT of all time, was the best defensive tackle in the league 3 or 4 times, and is typically the least-heralded of the bunch.  When the #NFL100 committee put together this list, only two defensive tackles were unanimous selections: Lilly and Page. Greene and Olsen should have been, too.

So yes, it really is possible that the four best defensive tackles all played in the same era.  Strange, but true. [continue reading…]

{ 0 comments }

Leonard Williams: Where Are The Sacks?

Leonard Williams was the 6th pick in the 2015 Draft.  He hasn’t been an outright bust by any means, but he’s certainly failed to deliver much in the way of big plays.   He’s never missed a game in his career, and will only finish 2019 with 15 games played because he got to experience two bye weeks: with the Jets in week 4 and then with the Giants in week 11.  He has recorded over 200 tackles in his career, but among first round defensive linemen with that number of tackles, his sack totals are shockingly low.

For years, Williams always seemed “on the verge” of a breakout season because of his quarterback hits numbers. He had 21 as a rookie, and then 7.0 sacks in a promising second season. In year 3, he had only 2.0 sacks but a whopping 25 quarterbacks hits…. and then in 2018 he had 20 quarterback hits and only 5.0 sacks. This year? He has 12 quarterback hits and zero sacks. In general, you expect about a 40-45% ratio between quarterback hits and quarterback sacks. But Williams is an extreme outlier, recording 17 sacks against a whopping 97 quarterback hits over his 5-year career.

The graph below shows the sack totals (X-Axis) and quarterback hits totals (Y-Axis) for defensive players from 2015 to 2019. [continue reading…]

{ 0 comments }

Previous Passing Stats:

Patience is a virtue best served cold for Dolphins fans. It took six failed breakout seasons, but eventually, Dr. Kevorkian finally came for the Ryan Tannehill era in Miami. Maybe all Tannehill needed for his breakout season to be realized was to change teams?

On Sunday, Tannehill had yet another career game, completing 21 of 27 passes for 391 yards, with 3 TDs and one tipped interception. Shockingly, he didn’t take a single sack, for just the 7th time in his career. He threw for 15 first downs. In Tannehill’s last game with the Dolphins, he was seen throwing for just 8 first downs on 35 dropbacks (31 attempts, 4 sacks). His success in Tennessee is unsustainable — he’s not going to average 13.4 yards per completion or complete 73% of his passes — but he’s been legitimately great over the last two months. Nobody ever knows how the Ryan Tannehill Experience will change week to week, but it’s been a fun ride for a player who never could put it together for long with the Dolphins.

The table below shows the week 14 passing stats. [continue reading…]

{ 0 comments }

#NFL100 – Top 7 Defensive Ends

Previously: Running Backs

As you know, the NFL is announcing its top 100 players in league history as part of the league’s 100-year anniversary. The nominating committee selected 17 defensive ends as finalists, and with the exception of three non-eligible players (Peppers, Watt, Ware) every player is in the Hall of Fame. For the final team, 7 defensive ends were chosen. The table below shows the finalists and those selected for the official team:

PlayerTeam(s)First YrLast YrSelected?
Bill HewittChicago Bears; Philadelphia Eagles; Phil-Pitt Steagles19321943Selected
Len FordLos Angeles Dons (AAFC); Cleveland Browns; Green Bay Packers19481958Finalist
Andy RobustelliLos Angeles Rams; New York Giants19511964Finalist
Gino MarchettiDallas Texans; Baltimore Colts19521966Selected
Doug AtkinsCleveland Browns; Chicago Bears; New Orleans Saints19531969Selected
Willie DavisCleveland Browns; Green Bay Packers19581969Finalist
Deacon JonesLos Angeles Rams; San Diego Chargers; Washington Redskins19611974Selected
Carl EllerMinnesota Vikings; Seattle Seahawks19641979Finalist
Jack YoungbloodLos Angeles Rams19711984Finalist
Lee Roy SelmonTampa Bay Buccaneers19761984Selected
Howie LongOakland/Los Angeles Raiders19811993Finalist
Reggie WhitePhiladelphia Eagles; Green Bay Packers; Carolina Panthers19852000Selected
Bruce SmithBuffalo Bills; Washington Redskins19852003Selected
Michael StrahanNew York Giants19932007Finalist
Julius PeppersCarolina Panthers; Chicago Bears; Green Bay Packers; Carolina Panthers20022018Finalist
DeMarcus WareDallas Cowboys; Denver Broncos20052016Finalist
J.J. WattHouston Texans20112019Finalist

White with a play that was not a penalty during his era.

For years, the defensive end position was a perfect place for a Mount Rushmore designation. While historians rarely agree on everything, many agreed that there were four defensive ends who separated themselves from every other player to play the position.

We begin with Colts great Gino Marchetti, who was a first-team All-Pro selection in 9 straight seasons from 1956 to 1964. He is one of the most decorated defensive players in league history, and had the ultimate respect of opposing coaches and players. Those who saw him had no question that he was the best defensive end of his time.

In 1969, a recently-retired Marchetti was named as the defensive end on the century on the NFL’s 50th anniversary team. In 1994, Marchetti was joined by Reggie White and Deacon Jones as the three defensive ends on the 75th anniversary team. Marchetti was the first true pass rusher in NFL history, coming to age in the 1950s as the passing game was becoming more specialized. He was a sack artist who was great against the run, making him about as perfect as it gets at defensive end. Marchetti was the rare first ballot Hall of Fame choice at the position, one of just five to earn that honor (the others being the other three members of DE Mt. Rushmore, and Jason Taylor, who was ignored by the 100th anniversary committee). [continue reading…]

{ 0 comments }

Drew Brees Has The Most Touchdowns In NFL History

Drew Brees had yet another remarkable game today. The 40-year-old threw five touchdown passes and rushed for another on a sneak from the 1-yard line. The future Hall of Famer has now thrown 537 touchdowns in his regular season career, rushed for another 23, and even caught one (from LaDainian Tomlinson back in 2003).

That gives Brees 561 career touchdowns, the most in regular season history.

Most career total touchdowns:

1. 561 – Brees (537 passing, 23 rushing, 1 receiving)
2. 558 – Tom Brady (536 passing, 22 rushing)
3. 557 – Peyton Manning (539 passing, 18 rushing)

Back in the 2018 offseason, I wrote that Brady and Brees were in a close race to dethrone Manning as the all-time career passing touchdowns king. Both players finished the 2015 season tied with 428 career touchdown passes. They finished the 2017 season tied again with 488 career touchdown passes. And after week 14 of the 2019 season, Brees is up on Brady 537-536. Brees is about year and a half younger than Brady, and is playing better this season; the odds are Brees will be the one who ultimately retires as the all-time passing touchdowns king. But it’s still a toss-up as to who breaks Manning’s record first, even if today Brees set a similar record that almost nobody noticed.

Coming up next: Brees and the Saints host the Colts on Monday Night Football in week 15, and Brees will be a strong favorite to throw passing touchdowns 539 and 540 in that game.  A home game on primetime? Yes, Brees will be gunning for the record books. That said, the Patriots face the Bengals the day before, and I wouldn’t put it past Brady to throw 4 touchdowns in that game, too, being the first to break the record.  This may turn into a McGwire/Sosa race after all.

{ 0 comments }

The goal of an NFL game is to win the game. If your opponent scores 17 points, you want to score 18 points, but anything more than 18 points is unnecessary. On the other hand, if you lose a game, all of the points you scored were unnecessary: losing 17-0 counts the same as losing 17-16.

With that logic, most points in an NFL game are “wasted” or unnecessary points. The Bengals started the season 0-11, so all points scored by Cincinnati were wasted during that stretch. In the 12th game, when Cincinnati won 22-6, you could claim that 15 of the 22 points scored were wasted, too. That means 172 of the 179 points scored by the Bengals this year — or 96% — were wasted points. Said differently, Cincinnati could have scored 7 points this year, not 172, and if allocated correctly, have the same record.

For Seattle, it’s a different story. The Seahawks are 10-2 and have scored 329 points; the minimum number of points Seattle could have scored and still achieved a 10-2 record is 240 points, given how many points the team has allowed each week. That means only 27% of the Seahawks points this year have been “wasted” points:

The graph below shows all 32 teams in the NFL this season.  The X-Axis shows points per game; the Y-Axis shows the “wasted” points per game, based on the following formula:

  • In a win, all points scored after 1 point more than your opponent scored are wasted.  In a 20-17 victory, there are 2 wasted points.  In a 30-17 victory, there are 12 wasted points.
  • In a loss, all points scored are wasted points.
  • In a tie, since a tie is half a win, half of the points are wasted (i.e., you could have scored 0 points and had zero wins).

We can also look at this on a percentage basis. As you might suspect, the Bengals have wasted the highest percentage of their team’s points this year, at 96%, while the Seahawks have wasted the lowest percentage, at just 27%.

TeamPts per GameWasted Pts/GPerc
Cincinnati Bengals14.914.396%
Atlanta Falcons21.718.887%
New York Giants19.216.284%
Los Angeles Chargers20.314.973%
Detroit Lions23.317.073%
New England Patriots26.819.372%
Denver Broncos16.511.872%
Jacksonville Jaguars18.312.870%
Dallas Cowboys25.717.669%
Los Angeles Rams23.616.168%
Miami Dolphins16.711.368%
Washington Redskins14.49.868%
Cleveland Browns20.513.867%
Philadelphia Eagles22.815.266%
Tampa Bay Buccaneers28.318.465%
New York Jets17.010.964%
Arizona Cardinals21.313.563%
Baltimore Ravens33.820.862%
Carolina Panthers23.314.361%
Indianapolis Colts21.812.758%
San Francisco 49ers29.116.958%
Pittsburgh Steelers19.711.358%
Kansas City Chiefs29.015.955%
Chicago Bears18.710.053%
Minnesota Vikings26.614.153%
Buffalo Bills21.410.549%
Tennessee Titans23.011.249%
Oakland Raiders19.89.347%
Houston Texans24.410.945%
Green Bay Packers24.110.242%
New Orleans Saints24.87.831%
Seattle Seahawks27.47.427%

In its simplest terms, what we are solving for here is the fewest amount of points a team could have scored and still finished with the same record. And as it turns out, the Seahawks are historic outliers. Since 1970, the most “efficient” team at scoring was the 2016 Raiders. Oakland scored 416 points that season, and in 4 losses, scored 28, 13, 10, and 6 points for a total of 57 points. In the team’s 12 wins, the Raiders average margin of victory was only 6.67, which means only 5.67 points per game were wasted in wins, or 68 total. Overall, this means the Raiders wasted only 125 of the team’s 416 points; said differently, for the 2016 Raiders to go 12-4, given how many points they allowed in each game, the team needed to score at least 291 points. They actually scored 416, so the team only “wasted” 30% of their points. That’s the lowest of any team since 1970.

The table below shows the amount of wasted points by each team from 1970 to 2018.

RkTeamYearGWin%PtsWasted PtsWst Pts/GPerc
1OAK2016160.7504161257.830%
2RAI198290.889260839.231.9%
3TEN1999160.8133921378.634.9%
4PHI1993160.5002931066.636.2%
5PIT2004160.9383721368.536.6%
6GNB2011160.93856020512.836.6%
7IND2009160.8754161549.637%
8TAM198290.556158596.637.3%
9DAL2016160.8134211599.937.8%
10RAI1993160.6253061187.438.6%
11MIA2016160.6253631418.838.8%
12IND2006160.75042716710.439.1%
13CAR2015160.93850019712.339.4%
14HOU1978160.6252831127.039.6%
15TAM2005160.6883001197.439.7%
16DAL2018160.6253391358.439.8%
17SFO1990160.8753531418.839.9%
18CAR2003160.6883251308.140%
19IND2012160.6883571459.140.6%
20PIT2017160.81340616510.340.6%
21STL198290.556135556.140.7%
22IND1999160.81342317310.840.9%
23WAS198290.889190788.741.1%
24CHI1971140.429185765.441.1%
25CIN2003160.5003461438.941.3%
26NWE2013160.75044418511.641.7%
27CLE1980160.6883571499.341.7%
28LAR2018160.81352722013.841.7%
29CHI2010160.6883341408.841.9%
30STL1976140.7143091309.342.1%
31BUF1991160.81345819312.142.1%
32CLE1972140.7142681138.142.2%
33NWE2003160.8753481479.242.2%
34OAK1976140.92935014810.642.3%
35RAM1978160.7503161348.442.4%
36NYJ2013160.5002901237.742.4%
37ATL2010160.81341417611.042.5%
38BAL2010160.7503571529.542.6%
39KAN2016160.75038916610.442.7%
40CIN1981160.75042118011.342.8%
41ATL2017160.6253531519.442.8%
42DEN2015160.7503551529.542.8%
43ATL2004160.6883401469.142.9%
44ARI1996160.4383001298.143%
45HOU2016160.5632791207.543%
46HOU1979160.6883621569.843.1%
47CAR2017160.6883631579.843.3%
48MIA198290.778198869.643.4%
49SDG1987150.5332531107.343.5%
50NOR2009160.81351022313.943.7%
51NYG1994160.5632791227.643.7%
52OAK1974140.85735515611.143.9%
53DEN1985160.68838016810.544.2%
54OAK1980160.68836416110.144.2%
55JAX2005160.75036116010.044.3%
56DAL2007160.81345520212.644.4%
57DEN1986160.68837816810.544.4%
58GNB1989160.62536216110.144.5%
59RAI1984160.68836816410.344.6%
60PIT198290.6672049110.144.6%
61NYJ2010160.68836716410.344.7%
62ATL1998160.87544219812.444.8%
63NYG2016160.6883101398.744.8%
64GNB1970140.429196886.344.9%
65SDG2006160.87549222113.844.9%
66PIT2014160.68843619612.345%
67CLE2007160.62540218111.345%
68PHI2017160.81345720612.945.1%
69DET2016160.5633461569.845.1%
70MIA1985160.75042819312.145.1%
71DEN1996160.81339117711.145.3%
72ATL2012160.81341919011.945.3%
73DAL2014160.75046721213.345.4%
74NYG1986160.87537116910.645.6%
75DEN1998160.87550122914.345.7%
76DET2014160.6883211479.245.8%
77PHI1995160.6253181469.145.9%
78OAK1970140.6433001389.946%
79PHI2010160.62543920212.646%
80NOR2018160.81350423214.546%
81.5DAL2005160.5633251509.446.2%
81.5JAX1996160.5633251509.446.2%
83IND1995160.5633311539.646.2%
84STL1975140.78635616511.846.3%
85NYG1997160.656307142.58.946.4%
86ARI2014160.6883101449.046.5%
87PIT1997160.68837217310.846.5%
88MIA2005160.5633181489.346.5%
89SFO1970140.75035216411.746.6%
90KAN1986160.62535816710.446.6%
91.5ATL1978160.5632401127.046.7%
91.5STL1974140.7142851339.546.7%
93WAS1986160.75036817210.846.7%
94SFO1981160.81335716710.446.8%
95BAL1977140.7142951389.946.8%
96DAL1991160.68834216010.046.8%
97ATL2008160.68839118311.446.8%
98MIN2000160.68839718611.646.9%
99NYG2002160.6253201509.446.9%
100NYJ1986160.62536417110.747%
101NWE2011160.81351324115.147%
102SDG1994160.68838117911.247%
103GNB2002160.75039818711.747%
104CLE1971140.6432851349.647%
105CLE1986160.75039118411.547.1%
106NYG1970140.64330114210.147.2%
107SEA1988160.56333916010.047.2%
108WAS2012160.62543620612.947.2%
109SFO1989160.87544220913.147.3%
110DET1993160.6252981418.847.3%
111PHI2003160.75037417711.147.3%
112SFO2002160.62536717410.947.4%
113WAS1977140.643196936.647.4%
114RAI1990160.75033716010.047.5%
115DEN1991160.7503041459.147.7%
116BUF1995160.62535016710.447.7%
117STL2000160.62554025816.147.8%
119CIN2001160.3752261086.847.8%
119DET1991160.75033916210.147.8%
119PHI1979160.68833916210.147.8%
121TEN2006160.5003241559.747.8%
122NOR1987150.80042220213.547.9%
123STL2003160.75044721413.447.9%
124DEN1984160.81335316910.647.9%
125LAC2018160.75042820512.847.9%
126WAS2008160.5002651277.947.9%
127GNB1995160.68840419412.148%
128GNB1972140.71430414610.448%
129CAR2008160.75041419912.448.1%
130NOR2002160.56343220813.048.1%
131SDG2014160.56334816810.548.3%
132GNB1997160.81342220412.848.3%
133TAM1997160.6252991459.148.5%
134DEN2013160.81360629418.448.5%
135PHI1988160.62537918411.548.5%
136KAN1980160.5003191559.748.6%
137RAM1989160.68842620712.948.6%
138ARI1998160.5633251589.948.6%
139NYJ2001160.6253081509.448.7%
140IND2008160.75037718411.548.8%
141MIN1987150.53333616410.948.8%
142NWE2010160.87551825315.848.8%
143RAI1994160.5633031489.348.8%
144PIT2009160.56336818011.348.9%
145DEN2008160.50037018111.348.9%
146MIN1998160.93855627217.048.9%
147IND2003160.75044721913.749%
148BUF1998160.62540019612.349%
149OAK1977140.78635117212.349%
150DET1994160.56335717510.949%
151ATL1991160.62536117711.149%
152BUF1973140.6432591279.149%
153TEN2002160.68836718011.349%
154DAL1979160.68837118211.449.1%
155ATL1980160.75040519912.449.1%
156KAN1995160.81335817611.049.2%
157MIN2017160.81338218811.849.2%
158JAX1998160.68839219312.149.2%
159BUF1974140.6432641309.349.2%
160ATL2016160.68854026616.649.3%
161SEA1978160.56334517010.649.3%
162SDG2009160.81345422414.049.3%
163KAN1993160.68832816210.149.4%
164SEA2016160.65635417510.949.4%
165NWE1978160.68835817711.149.4%
166IND1990160.4382811398.749.5%
167JAX1997160.68839419512.249.5%
168TEN2007160.6253011499.349.5%
169NYG1990160.81333516610.449.6%
170WAS1987150.73337918812.549.6%
171CIN1986160.62540920312.749.6%
172MIA2001160.68834417110.749.7%
173NWE1996160.68841820813.049.8%
174NYJ1974140.5002791399.949.8%
175WAS1985160.6252971489.349.8%
176SEA2001160.5633011509.449.8%
177IND2015160.50033316610.449.8%
178MIA2008160.68834517210.849.9%
179JAX2010160.50035317611.049.9%
180DAL1981160.75036718311.449.9%
182.5HOU2012160.75041620813.050%
182.5ATL2011160.62540220112.650%
182.5RAI1985160.75035417711.150%
182.5BAL1983160.4382641328.350%
185SEA1983160.56340320212.650.1%
186DAL1977140.85734517312.450.1%
187MIN1996160.5632981509.450.3%
188JAX2009160.4382901469.150.3%
189MIA1994160.62538919612.350.4%
190BUF1988160.75032916610.450.5%
191NYJ2000160.56332116210.150.5%
192ARI2001160.4382951499.350.5%
193SEA1979160.56337819111.950.5%
194PIT1977140.64328314310.250.5%
195OAK1981160.4382731388.650.5%
196PHI2009160.68842921713.650.6%
197NYG2008160.75042721613.550.6%
198KAN2017160.62541521013.150.6%
199GNB2014160.75048624615.450.6%
200DEN2014160.75048224415.350.6%
201BAL1970140.821321162.511.650.6%
202WAS1983160.87554127417.150.6%
203KAN1997160.81337519011.950.7%
204ARI2015160.81348924815.550.7%
205KAN2006160.56333116810.550.8%
206NWE2007161.00058929918.750.8%
207NWE2016160.87544122414.050.8%
208PIT1978160.87535618111.350.8%
209PIT1995160.68840720712.950.9%
210MIN1999160.62539920312.750.9%
211BUF1983160.5002831449.050.9%
212DAL1983160.75047924415.350.9%
213JAX2004160.5632611338.351%
214MIN2015160.68836518611.651%
215HOU2018160.68840220512.851%
216OAK1971140.643344175.512.551%
217PIT2002160.65639019912.451%
218WAS2015160.56338819812.451%
219GNB1983160.50042921913.751%
220BUF1993160.75032916810.551.1%
221MIN1977140.6432311188.451.1%
222DAL1972140.71431916311.651.1%
223CIN1988160.75044822914.351.1%
224DEN2000160.68848524815.551.1%
225RAM1984160.62534617711.151.2%
226.5SFO1997160.81337519212.051.2%
226.5OAK1975140.78637519213.751.2%
228TEN2003160.75043522313.951.3%
229PHI2004160.81338619812.451.3%
230BAL2011160.75037819412.151.3%
231PHI1971140.464221113.58.151.4%
232NWE1985160.68836218611.651.4%
233SDG1995160.56332116510.351.4%
234MIN1994160.62535618311.451.4%
235MIN1997160.56335418211.451.4%
236MIN1976140.82130515711.251.5%
237TEN2017160.56333417210.851.5%
238NYG2011160.56339420312.751.5%
239BUF1980160.68832016510.351.6%
240MIN2005160.5633061589.951.6%
241NWE2004160.87543722614.151.7%
242SDG198290.66728814916.651.7%
243CLE2002160.56334417811.151.7%
244CIN1973140.71428614810.651.7%
245CIN2009160.6253051589.951.8%
246BUF1979160.4382681398.751.9%
247MIN198290.5561879710.851.9%
248TAM2010160.62534117711.151.9%
249MIA1972141.00038520014.351.9%
250SFO2013160.75040621113.252%
251NOR2004160.50034818111.352%
252CHI2001160.81333817611.052.1%
253DET1985160.43830716010.052.1%
254NWE1976140.78637619614.052.1%
255.5PIT2016160.68839920813.052.1%
255.5OAK2001160.62539920813.052.1%
257SDG2004160.75044623314.652.2%
258KAN2003160.81348425315.852.3%
259MIA1974140.78632717112.252.3%
260BUF2017160.5633021589.952.3%
261DET1974140.5002561349.652.3%
262KAN2018160.75056529618.552.4%
263DEN2011160.50030916210.152.4%
264SEA2005160.81345223714.852.4%
265MIA1999160.56332617110.752.5%
266MIA1981160.71934518111.352.5%
267.5MIN2012160.62537919912.452.5%
267.5MIN2008160.62537919912.452.5%
269NYJ1979160.50033717711.152.5%
270ARI2011160.50031216410.352.6%
271NOR1994160.43834818311.452.6%
272RAM1985160.68834017911.252.6%
273MIN1980160.56331716710.452.7%
274DAL1976140.78629615611.152.7%
275GNB2015160.62536819412.152.7%
276CIN2014160.656365192.512.052.7%
277CIN2013160.68843022714.252.8%
278TEN2008160.81337519812.452.8%
279CHI1987150.73335618812.552.8%
280PHI1987150.46733717811.952.8%
281CHI1991160.6882991589.952.8%
282IND2005160.87543923214.552.8%
283GNB2007160.81343523014.452.9%
284IND2007160.81345023814.952.9%
285SDG1996160.50031016410.352.9%
286CLE1979160.56335919011.952.9%
287.5SFO2014160.50030616210.152.9%
287.5IND2013160.68839120712.952.9%
289CLE1988160.62530416110.153%
290.5DEN1983160.56330216010.053%
290.5KAN1971140.75030216011.453%
292GNB2013160.53141722113.853%
293MIA1980160.5002661418.853%
294TEN2016160.56338120212.653%
295IND1988160.56335418811.853.1%
296NWE1998160.56333717911.253.1%
297SFO1988160.62536919612.353.1%
298PIT2001160.81335218711.753.1%
299DAL1975140.71435018613.353.1%
300WAS2016160.531396210.513.253.2%
301SFO2011160.81338020212.653.2%
302NYJ2006160.62531616810.553.2%
303RAI1983160.75044223514.753.2%
304CIN2011160.56334418311.453.2%
305PHI1989160.68834218211.453.2%
306RAI1986160.50032317210.853.3%
307BAL2006160.81335318811.853.3%
308SFO1984160.93847525315.853.3%
309NWE1994160.62535118711.753.3%
310.5MIA2013160.50031716910.653.3%
310.5IND1996160.56331716910.653.3%
312.5HOU1987150.60034518412.353.3%
312.5CHI1977140.6432551369.753.3%
314.5NOR2000160.62535418911.853.4%
314.5HOU1974140.5002361269.053.4%
316NYG1980160.2502491338.353.4%
317SEA2006160.56333517911.253.4%
318SFO1998160.75047925616.053.4%
319CIN198290.77823212413.853.4%
320ARI2007160.50040421613.553.5%
321MIA1992160.68834018211.453.5%
322.5SDG2013160.56339621213.353.5%
322.5KAN1996160.5632971599.953.5%
324.5NWE2015160.75046524915.653.5%
324.5DEN1980160.50031016610.453.5%
326IND2010160.62543523314.653.6%
327HOU1975140.71429315711.253.6%
328BUF1996160.62531917110.753.6%
329NOR2010160.68838420612.953.6%
330ATL2015160.50033918211.453.7%
331CIN2015160.75041922514.153.7%
332CHI2000160.3132161167.353.7%
333SEA1995160.50036319512.253.7%
334NOR2011160.81354729418.453.7%
335CIN1975140.78634018313.153.8%
336NYJ2008160.56340521813.653.8%
337.5GNB2001160.75039021013.153.8%
337.5PIT1992160.68829916110.153.8%
339ARI2009160.62537520212.653.9%
340MIA1990160.75033618111.353.9%
341SFO2007160.3132191187.453.9%
342CLE1978160.50033418011.353.9%
343HOU1980160.6882951599.953.9%
344DEN2005160.81339521313.353.9%
345PHI2014160.62547425616.054%
346CIN1996160.50037220112.654%
347MIN1979160.4382591408.854.1%
348NWE2002160.56338120612.954.1%
349PHI2000160.68835119011.954.1%
350.5GNB2016160.62543223414.654.2%
350.5GNB1998160.68840822113.854.2%
352SFO1987150.86745924916.654.2%
353PHI1996160.62536319712.354.3%
354GNB2012160.68843323514.754.3%
355MIA1997160.56333918411.554.3%
356OAK1978160.56331116910.654.3%
357GNB1992160.5632761509.454.3%
358PHI1991160.6252851559.754.4%
359CIN2005160.68842122914.354.4%
360STL2001160.87550327417.154.5%
361HOU1989160.56336519912.454.5%
362PHI2013160.62544224115.154.5%
363CHI2006160.81342723314.654.6%
364ARI2017160.50029516110.154.6%
365MIA1984160.87551328017.554.6%
366GNB1976140.3572181198.554.6%
367CHI2013160.50044524315.254.6%
368IND1992160.5632161187.454.6%
369DEN1979160.6252891589.954.7%
370NWE2017160.81345825115.754.8%
371NOR1983160.50031917510.954.9%
372OAK2015160.43835919712.354.9%
373CHI1990160.68834819111.954.9%
374RAM1980160.68842423314.655%
375ATL1995160.56336219912.455%
376STL2015160.4382801549.655%
377DET1972140.607339186.513.355%
378KAN1972140.57128715811.355.1%
379.5STL2002160.43831617410.955.1%
379.5BAL2002160.43831617410.955.1%
381MIN1973140.85729616311.655.1%
382CLE1989160.59433418411.555.1%
383CHI1986160.87535219412.155.1%
384.5MIA2018160.43831917611.055.2%
384.5CIN2017160.43829016010.055.2%
386CAR2013160.75036620212.655.2%
387BUF1981160.62531117210.855.3%
388WAS1978160.5002731519.455.3%
389DAL1994160.75041422914.355.3%
390DAL2012160.50037620813.055.3%
391BUF1992160.68838121113.255.4%
392DAL1995160.75043524115.155.4%
393OAK2011160.50035919912.455.4%
394SFO1992160.87543123914.955.5%
395CHI2008160.56337520813.055.5%
396DEN1977140.85727415210.955.5%
397NWE2018160.68843624215.155.5%
398NWE2001160.68837120612.955.5%
399.5NWE2014160.75046826016.355.6%
399.5CLE1973140.5712341309.355.6%
401BUF1990160.81342823814.955.6%
402STL1983160.53137420813.055.6%
403GNB2017160.43832017811.155.6%
404SFO1994160.81350528117.655.6%
405NOR2016160.43846926116.355.7%
406WAS1976140.71429116211.655.7%
407BUF2002160.50037921113.255.7%
408PIT2011160.75032518111.355.7%
409ATL1986160.4692801569.855.7%
410DEN2012160.81348126816.855.7%
411.5IND2004160.75052229118.255.7%
411.5NYG1989160.75034819412.155.7%
413DEN1981160.62532117911.255.8%
414BAL2012160.62539822213.955.8%
415NYG2000160.75032818311.455.8%
416GNB1978160.5312491398.755.8%
417GNB1981160.50032418111.355.9%
418BUF2000160.50031517611.055.9%
419IND2002160.62534919512.255.9%
420GNB2004160.62542423714.855.9%
421PIT1974140.750305170.512.255.9%
422DET2011160.62547426516.655.9%
423PIT1983160.62535519912.456.1%
424DEN1987150.700379212.514.256.1%
425KAN1988160.281254142.58.956.1%
426NOR2015160.43840822914.356.1%
427NYG1984160.56329916810.556.2%
428DEN1973140.57135419914.256.2%
429WAS1972140.78633618913.556.3%
430NOR2013160.68841423314.656.3%
431WAS1975140.57132518313.156.3%
432BAL1976140.78641723516.856.4%
433KAN1984160.50031417711.156.4%
434MIN2009160.75047026516.656.4%
435DAL2003160.62528916310.256.4%
436SDG2002160.50033318811.856.5%
437NOR2017160.68844825315.856.5%
438DAL1992160.81340923114.456.5%
439NYG1975140.3572161228.756.5%
440SFO1996160.75039822514.156.5%
441SEA2018160.62542824215.156.5%
442CLE1976140.64326715110.856.6%
443OAK1972140.750365206.514.856.6%
444DAL1985160.62535720212.656.6%
445NYJ2015160.62538721913.756.6%
446NYG1993160.68828816310.256.6%
447NWE2006160.75038521813.656.6%
448NWE1984160.56336220512.856.6%
449.5CAR2006160.5002701539.656.7%
449.5TAM1999160.6882701539.656.7%
451IND1994160.50030717410.956.7%
452WAS1971140.679276156.511.256.7%
453KAN1994160.56331918111.356.7%
454NYJ2004160.62533318911.856.8%
455WAS1981160.50034719712.356.8%
456TAM2008160.56336120512.856.8%
457SEA1999160.56333819212.056.8%
458.5NYJ1999160.50030817510.956.8%
458.5DAL1984160.56330817510.956.8%
460DET1999160.50032218311.456.8%
461CHI1995160.56339222313.956.9%
462OAK2002160.68845025616.056.9%
463DAL1990160.4382441398.757%
464NOR1992160.75033018811.857%
465ARI2013160.62537921613.557%
466NYG1971140.2862281309.357%
467JAX1999160.87539622614.157.1%
468NYG2005160.68842224115.157.1%
469GNB2006160.50030117210.857.1%
470KAN1990160.68836921113.257.2%
471TEN2000160.81334619812.457.2%
472MIN1981160.43832518611.657.2%
473WAS1989160.62538622113.857.3%
474SEA1989160.4382411388.657.3%
475MIN1983160.50031618111.357.3%
476PHI1990160.62539622714.257.3%
477DAL1987150.46734019513.057.4%
478PIT1989160.5632651529.557.4%
479OAK2009160.3131971137.157.4%
480PIT2015160.62542324315.257.4%
481KAN1991160.62532218511.657.5%
482RAM1973140.85738822315.957.5%
483PHI2018160.56336721113.257.5%
484PHI2006160.62539822914.357.5%
485PIT1987150.53328516410.957.5%
486OAK2000160.75047927617.357.6%
487SFO1983160.62543224915.657.6%
488HOU1996160.50034519912.457.7%
489NOR1988160.62531218011.357.7%
490SFO2001160.75040923614.857.7%
491.5CIN1997160.43835520512.857.7%
491.5HOU1985160.31328416410.357.7%
493WAS1979160.62534820112.657.8%
494STL2006160.50036721213.357.8%
495MIN2004160.50040523414.657.8%
496CIN1980160.3752441418.857.8%
497RAM1974140.71426315210.957.8%
498OAK2017160.37530117410.957.8%
499NWE1991160.3752111227.657.8%
500CLE2014160.43829917310.857.9%
501KAN1989160.53131818411.557.9%
502MIA2003160.62531118011.357.9%
503CIN2018160.37536821313.357.9%
504CLE2001160.43828516510.357.9%
505PHI1992160.68835420512.857.9%
506SDG1992160.68833519412.157.9%
507PIT1994160.75031618311.457.9%
508NYG1988160.62535920813.057.9%
509WAS1997160.531327189.511.858%
510TAM1990160.3752641539.658%
511DEN2016160.56333319312.158%
512STL2004160.50031918511.658%
513NYG1991160.50028116310.258%
514DAL2008160.56336221013.158%
515DET1995160.62543625315.858%
516GNB2000160.56335320512.858.1%
517MIA1983160.75038922614.158.1%
518DEN1974140.536302175.512.558.1%
519CHI198290.333141829.158.2%
520TEN1998160.50033019212.058.2%
521WAS2001160.5002561499.358.2%
522BAL1975140.71439523016.458.2%
523MIA1970140.71429717312.458.2%
524SEA2013160.81341724315.258.3%
525PIT2018160.594428249.515.658.3%
526DET2000160.56330717911.258.3%
527NWE2005160.62537922113.858.3%
528CAR2005160.68839122814.358.3%
529KAN2005160.62540323514.758.3%
530CHI2011160.50035320612.958.4%
531ARI1999160.3752451438.958.4%
532DAL1980160.75045426516.658.4%
533MIN1974140.71431018112.958.4%
534ATL1971140.53627416011.458.4%
535DEN1992160.5002621539.658.4%
536CIN1977140.5712381399.958.4%
537PHO1988160.43834420112.658.4%
538TEN2011160.56332519011.958.5%
539TEN2012160.37533019312.158.5%
540KAN2011160.4382121247.858.5%
541PIT2008160.75034720312.758.5%
542HOU2009160.56338822714.258.5%
543BUF1994160.43834019912.458.5%
544STL1995160.43830918111.358.6%
545CAR1996160.75036721513.458.6%
546STL1984160.56342324815.558.6%
547DET2015160.43835821013.158.7%
548SFO2012160.71939723314.658.7%
549ARI1994160.5002351388.658.7%
550NYJ1988160.531372218.513.758.7%
551MIA1993160.56334920512.858.7%
552IND2000160.62542925215.858.7%
553SEA1986160.62536621513.458.7%
554SEA2004160.56337121813.658.8%
555ATL2001160.43829117110.758.8%
556CAR2007160.4382671579.858.8%
557HOU1991160.68838622714.258.8%
558SDG1980160.68841824615.458.9%
559NOR2001160.43833319612.358.9%
560SEA1997160.50036521513.458.9%
561WAS1999160.62544326116.358.9%
562.5BUF2008160.43833619812.458.9%
562.5DEN2002160.56339223114.458.9%
564CHI2012160.62537522113.858.9%
565LAR2017160.68847828217.659%
566RAM1983160.56336121313.359%
567OAK1998160.50028817010.659%
568DEN1975140.42925415010.759.1%
569BAL2001160.62530317911.259.1%
570CIN2012160.62539123114.459.1%
571PHI1985160.43828616910.659.1%
572DAL1971140.78640624017.159.1%
573IND2018160.62543325616.059.1%
574CHI2018160.75042124915.659.1%
575ATL1983160.43837021913.759.2%
576KAN1992160.62534820612.959.2%
577NWE2012160.75055733020.659.2%
578MIN1989160.62535120813.059.3%
579NWE2008160.68841024315.259.3%
580GNB198290.61122613414.959.3%
581TAM2016160.56335421013.159.3%
582TAM1979160.62527316210.159.3%
583TEN2018160.56331018411.559.4%
584PIT1980160.56335220913.159.4%
585PHI2015160.43837722414.059.4%
586WAS1988160.43834520512.859.4%
587SEA2002160.43835521113.259.4%
588NWE198290.556143859.459.4%
589SEA1990160.56330618211.459.5%
590.5BUF2007160.4382521509.459.5%
590.5BUF1975140.57142025017.959.5%
592DET1971140.53634120314.559.5%
593KAN2010160.62536621813.659.6%
594MIN2018160.531360214.513.459.6%
595MIA1996160.50033920212.659.6%
596TEN2009160.50035421113.259.6%
597.5CHI2005160.6882601559.759.6%
597.5PIT1979160.75041624815.559.6%
599SDG1981160.62547828517.859.6%
600SFO1986160.65637422313.959.6%
601CHI2009160.43832719512.259.6%
602SFO1980160.37532019111.959.7%
603CIN1990160.56336021513.459.7%
604TAM1996160.3752211328.359.7%
605SDG1988160.3752311388.659.7%
606DET2013160.43839523614.859.7%
607DAL1996160.62528617110.759.8%
608MIN1972140.50030118012.959.8%
609TEN2001160.43833620112.659.8%
610IND2014160.68845827417.159.8%
611.5DEN2004160.62538122814.359.8%
611.5DEN2003160.62538122814.359.8%
613NWE1999160.50029917911.259.9%
614NYJ2002160.56335921513.459.9%
615CIN2004160.50037422414.059.9%
616SDG1974140.3572121279.159.9%
617CLE1985160.50028717210.859.9%
618STL1987150.46736221714.559.9%
619SDG1985160.50046728017.560%
620BAL2013160.50032019212.060%
621NYG2007160.62537322414.060.1%
622SDG1983160.37535821513.460.1%
623NWE1971140.42923814310.260.1%
624WAS1984160.68842625616.060.1%
625DAL1993160.75037622614.160.1%
626KAN1970140.571272163.511.760.1%
627MIN1991160.50030118111.360.1%
628NYG2012160.56342925816.160.1%
629GNB1990160.37527116310.260.1%
630MIN1992160.68837422514.160.2%
631WAS2005160.62535921613.560.2%
632SEA1985160.50034921013.160.2%
633TAM2001160.56332419512.260.2%
634DEN1989160.68836221813.660.2%
635.5SEA1996160.43831719111.960.3%
635.5NOR1993160.50031719111.960.3%
637.5DEN2001160.50034020512.860.3%
637.5STL1977140.50027216411.760.3%
639BUF1999160.68832019312.160.3%
640NWE1980160.62544126616.660.3%
641MIA2000160.68832319512.260.4%
642RAM1971140.60731318913.560.4%
643DAL2009160.68836121813.660.4%
644STL1985160.31327816810.560.4%
645NYJ1987150.40033420213.560.5%
646GNB1999160.50035721613.560.5%
647NYJ1991160.50031419011.960.5%
648STL2012160.46929918111.360.5%
649NYJ1998160.75041625215.860.6%
650JAX2007160.68841124915.660.6%
651DEN2007160.43832019412.160.6%
652WAS1990160.62538123114.460.6%
653MIN2006160.37528217110.760.6%
654ATL1979160.37530018211.460.7%
655NWE1986160.68841225015.660.7%
656RAM1979160.56332319612.360.7%
657KAN2015160.68840524615.460.7%
658KAN1999160.56339023714.860.8%
659CAR2012160.43835721713.660.8%
660WAS1991160.87548529518.460.8%
661NYJ1984160.43833220212.660.8%
662BAL2004160.56331719312.160.9%
663CAR2018160.43837622914.360.9%
664SEA2014160.75039424015.060.9%
665SEA1987150.60037122615.160.9%
666HOU2008160.50036622313.960.9%
667MIA1973140.85734320914.960.9%
668.5SDG2005160.56341825515.961%
668.5SEA1984160.75041825515.961%
670PIT2010160.75037522914.361.1%
671NYJ1985160.68839324015.061.1%
672KAN2004160.43848329518.461.1%
673NYJ2016160.31327516810.561.1%
674OAK1979160.56336522313.961.1%
675MIA2009160.43836022013.861.1%
676RAM1986160.62530918911.861.2%
677NWE1988160.5632501539.661.2%
678SEA2017160.56336622414.061.2%
679MIN1978160.53129418011.361.2%
680MIN2014160.43832519912.461.2%
681NOR2006160.62541325315.861.3%
682RAI1989160.50031519312.161.3%
683NYJ1978160.50035922013.861.3%
684SFO1971140.64330018413.161.3%
685.5BAL1998160.37526916510.361.3%
685.5ATL1972140.50026916511.861.3%
687TAM2000160.62538823814.961.3%
688MIA1975140.71435721915.661.3%
689WAS2007160.56333420512.861.4%
690MIN1995160.50041225315.861.4%
691NYJ1981160.65635521813.661.4%
692DAL2004160.37529318011.361.4%
693SDG1993160.50032219812.461.5%
694CLE1993160.43830418711.761.5%
695PHI2001160.68834321113.261.5%
696IND2016160.50041125315.861.6%
697BUF1997160.3752551579.861.6%
698CHI1985160.93845628117.661.6%
699CHI1994160.56327116710.461.6%
700NYJ1983160.43831319312.161.7%
701SDG1978160.56335521913.761.7%
702RAM1981160.37530318711.761.7%
703ATL198290.55618311312.661.7%
704TAM1994160.3752511559.761.8%
705.5TAM1995160.4382381479.261.8%
705.5CLE1992160.43827216810.561.8%
707PHI1973140.393310191.513.761.8%
708HOU1988160.62542426216.461.8%
709KAN1974140.35723314410.361.8%
710MIN1975140.85737723316.661.8%
711GNB2018160.406376232.514.561.8%
712SDG1970140.464282174.512.561.9%
713MIA2017160.37528117410.961.9%
714SFO2017160.37533120512.861.9%
715DET2017160.56341025415.962%
716ATL2006160.43829218111.362%
717CAR1999160.50042126116.362%
718NOR1997160.3752371479.262%
719DET1978160.43829018011.362.1%
720WAS1996160.56336422614.162.1%
721CIN1976140.71433520814.962.1%
722KAN2013160.68843026716.762.1%
723.5BUF1987150.46727016811.262.2%
723.5TAM1981160.56331519612.362.2%
725NWE1995160.37529418311.462.2%
726WAS1995160.37532620312.762.3%
727HOU1981160.43828117510.962.3%
728STL2010160.43828918011.362.3%
729DEN1997160.75047229418.462.3%
730ARI2008160.56342726616.662.3%
731OAK1999160.50039024315.262.3%
732NWE1997160.62536923014.462.3%
733IND1987150.60030018712.562.3%
734BAL2008160.68838524015.062.3%
735NYJ1997160.56334821713.662.4%
736SFO1995160.68845728517.862.4%
737NOR1990160.50027417110.762.4%
738SDG1999160.50026916810.562.5%
739BAL2000160.75033320813.062.5%
741HOU1992160.62535222013.862.5%
741DET1989160.43831219512.262.5%
741SDG1976140.42924815511.162.5%
743.5CAR2009160.50031519712.362.5%
743.5STL1981160.43831519712.362.5%
745CHI2007160.43833420913.162.6%
746GNB1985160.50033721113.262.6%
747PIT1972140.78634321515.462.7%
748TAM1984160.37533521013.162.7%
749NYG2010160.62539424715.462.7%
750NYG1998160.50028718011.362.7%
751MIA1979160.62534121413.462.8%
752CLE2018160.469359225.514.162.8%
753CIN1984160.50033921313.362.8%
754OAK1973140.679292183.513.162.8%
755.5DET1975140.50024515411.062.9%
755.5MIA1971140.75031519814.162.9%
757CLE1983160.56335622414.062.9%
758NOR1989160.56338624315.263%
759BUF2014160.56334321613.563%
760MIN2003160.56341626216.463%
761WAS2000160.50028117711.163%
762MIN2016160.50032720612.963%
763MIA2010160.43827317210.863%
764HOU1993160.75036823214.563%
765.5PIT2012160.50033621213.363.1%
765.5PHI2007160.50033621213.363.1%
767SEA2012160.68841226016.363.1%
768OAK2004160.31332020212.663.1%
769PHI2002160.75041526216.463.1%
770DAL2002160.3132171378.663.1%
771CHI1988160.75031219712.363.1%
772BAL2003160.62539124715.463.2%
773NYG1999160.43829918911.863.2%
774PIT2005160.68838924615.463.2%
775RAM1976140.75035122215.963.2%
776SDG1979160.75041126016.363.3%
777KAN1981160.56334321713.663.3%
778PIT1984160.56338724515.363.3%
779MIA1988160.37531920212.663.3%
780NOR2014160.43840125415.963.3%
781KAN2000160.43835522514.163.4%
782PIT1973140.71434722015.763.4%
783RAI1991160.56329818911.863.4%
784ATL2002160.59440225515.963.4%
785MIA1989160.50033121013.163.4%
786PIT1998160.43826316710.463.5%
787DEN1993160.56337323714.863.5%
788DAL1978160.75038424415.363.5%
789NOR198290.444129829.163.6%
790MIN1970140.85733521315.263.6%
791MIN2002160.37539024815.563.6%
792PHI1999160.31327217310.863.6%
793CHI1981160.37525316110.163.6%
794NYJ1971140.4292121359.663.7%
795NYG2009160.50040225616.063.7%
796MIN2010160.37528117911.263.7%
797SFO2008160.43833921613.563.7%
798CIN1985160.43844128117.663.7%
799KAN2014160.56335322514.163.7%
800ATL1997160.43832020412.863.8%
801BAL2018160.62538924815.563.8%
802NOR1984160.43829819011.963.8%
803ATL2018160.43841426416.563.8%
804KAN1976140.35729018513.263.8%
805CHI1975140.2861911228.763.9%
806BAL1999160.50032420712.963.9%
807CIN1995160.43834922313.963.9%
808MIN1993160.56327717711.163.9%
809NOR1971140.35726617012.163.9%
810BAL1980160.43835522714.263.9%
811DAL2011160.50036923614.864%
812CHI1999160.37527217410.964%
813DAL1974140.57129719013.664%
814SDG2012160.43835022414.064%
815BAL1978160.3132391539.664%
816PHI1997160.40631720312.764%
817SDG2011160.50040626016.364%
818BUF2004160.56339525315.864.1%
819CHI1979160.62530619612.364.1%
820TAM1989160.31332020512.864.1%
821PIT1975140.85737323917.164.1%
822SFO2006160.43829819111.964.1%
823PIT2013160.50037924315.264.1%
824MIN1985160.43834622213.964.2%
825CAR2000160.43831019912.464.2%
826SDG2008160.50043928217.664.2%
827HOU2014160.56337223914.964.2%
828SDG1998160.3132411559.764.3%
829.5CAR2002160.43825816610.464.3%
829.5PHO1989160.31325816610.464.3%
831MIA1987150.53336223315.564.4%
832WAS1974140.71432020614.764.4%
833SDG1977140.50022214310.264.4%
834DAL2013160.50043928317.764.5%
835MIN1971140.78624515811.364.5%
836WAS2002160.43830719812.464.5%
837STL1978160.37524816010.064.5%
838TAM2012160.43838925115.764.5%
839CHI1993160.4382341519.464.5%
840MIA1977140.71431320214.464.5%
841SEA2003160.62540426116.364.6%
842PIT1993160.56330819912.464.6%
843SEA2007160.62539325415.964.6%
844.5DET2007160.43834622414.064.7%
844.5TAM2002160.75034622414.064.7%
846NOR1978160.43828118211.464.8%
847NYG2006160.50035523014.464.8%
848PHI1978160.56327017510.964.8%
849OAK2018160.25029018811.864.8%
850RAM1992160.37531320312.764.9%
851SFO1991160.62539325515.964.9%
852SFO1993160.62547330719.264.9%
853HOU2007160.50037924615.464.9%
854RAM1970140.67932521115.164.9%
855GNB1977140.286134876.264.9%
856MIN2007160.50036523714.864.9%
857STL2013160.43834822614.164.9%
858NYG1972140.57133121515.465%
859ATL2005160.50035122814.365%
860NYG2001160.43829419111.965%
861KAN1985160.37531720612.965%
862.5KAN2001160.37532020813.065%
862.5CLE1994160.68834022113.865%
864CIN1999160.25028318411.565%
865BAL1997160.40632621213.365%
866MIA1998160.62532120913.165.1%
867NYJ1972140.50036723917.165.1%
868KAN1998160.43832721313.365.1%
869NYJ1994160.37526417210.865.2%
870GNB2003160.62544228818.065.2%
871BUF1972140.321257167.512.065.2%
872.5DEN2006160.56331920813.065.2%
872.5NOR1995160.43831920813.065.2%
874STL1973140.321286186.513.365.2%
875CLE1981160.31327618011.365.2%
876NOR2008160.50046330218.965.2%
877ATL2007160.25025916910.665.3%
878BAL2016160.50034322414.065.3%
879NYG2018160.31336924115.165.3%
880CAR2004160.43835523214.565.4%
881PHI1980160.75038425115.765.4%
882CHI2004160.3132311519.465.4%
883CHI2003160.43828318511.665.4%
884CLE1970140.50028618713.465.4%
885ARI2010160.31328918911.865.4%
886MIN2013160.34439125616.065.5%
887DAL2010160.37539425816.165.5%
888PHI2005160.37531020312.765.5%
889TAM2015160.37534222414.065.5%
890MIN2001160.31329019011.965.5%
891JAX2013160.25024716210.165.6%
892DEN1978160.62528218511.665.6%
893NYJ1989160.25025316610.465.6%
894PHI1984160.406278182.511.465.6%
895NWE1989160.31329719512.265.7%
896CIN1970140.57131220514.665.7%
897.5GNB2010160.62538825515.965.7%
897.5DEN1995160.50038825515.965.7%
899ATL1973140.64331820914.965.7%
900KAN2002160.50046730719.265.7%
901DET198290.44418111913.265.7%
902BAL2014160.62540926916.865.8%
903PIT1988160.31333622113.865.8%
904NWE1977140.64327818313.165.8%
905NYG2003160.25024316010.065.8%
906PIT1971140.42924616211.665.9%
907.5NOR2003160.50034022414.065.9%
907.5GNB1993160.56334022414.065.9%
909HOU1990160.56340526716.765.9%
910ATL1999160.31328518811.866%
911DEN1976140.64331520814.966%
912WAS1993160.2502301529.566.1%
913GNB1973140.429202133.59.566.1%
914SEA1998160.50037224615.466.1%
915DAL1998160.62538125215.866.1%
916CLE1987150.66739025817.266.2%
917BUF1989160.56340927116.966.3%
918SEA1977140.35728218713.466.3%
919STL1996160.37530320112.666.3%
920RAM1975140.85731220714.866.3%
921SFO2015160.3132381589.966.4%
922NYG198290.44416410912.166.5%
923GNB1987150.367255169.511.366.5%
924DAL1999160.50035223414.666.5%
925BUF2015160.50037925215.866.5%
926CAR2014160.469339225.514.166.5%
927PHI1983160.3132331559.766.5%
928ARI1995160.25027518311.466.5%
929PHI1994160.43830820512.866.6%
930TAM1998160.50031420913.166.6%
931NYJ2011160.50037725115.766.6%
933SEA2011160.43832121413.466.7%
933ARI2000160.1882101408.866.7%
933DET1977140.4291831228.766.7%
935.5SDG2007160.68841227517.266.7%
935.5ATL1970140.357206137.59.866.7%
937SDG1984160.43839426316.466.8%
938SEA1981160.37532221513.466.8%
939IND1989160.50029819912.466.8%
940NYG1981160.56329519712.366.8%
941PIT1991160.43829219512.266.8%
942.5PHI1986160.34425617110.766.8%
942.5CHI1970140.42925617112.266.8%
944CLE2006160.2502381599.966.8%
945CLE2005160.3752321559.766.8%
946STL1972140.3211931299.266.8%
947DEN1999160.37531421013.166.9%
948JAX2008160.31330220212.666.9%
949WAS2018160.43828118811.866.9%
950CLE1977140.42926918012.966.9%
951HOU2010160.37539026116.366.9%
952MIA1978160.68837224915.666.9%
953STL2005160.37536324315.266.9%
954NYG2013160.43829419712.367%
955DET1997160.56337925415.967%
956LAC2017160.56335523814.967%
957BAL2015160.31332822013.867.1%
958WAS1973140.71432521815.667.1%
959CLE2010160.31327118211.467.2%
960DEN2018160.37532922113.867.2%
961ARI2006160.31331421113.267.2%
962DAL2017160.56335423814.967.2%
963NYJ2012160.37528118911.867.3%
964DET1990160.37537325115.767.3%
965IND2001160.37541327817.467.3%
966PHI1974140.50024216311.667.4%
967NWE1979160.56341127717.367.4%
968SEA2010160.43831020913.167.4%
969DEN1994160.43834723414.667.4%
970PIT1996160.62534423214.567.4%
971NYJ2017160.31329820112.667.4%
972HOU2011160.62538125716.167.5%
973CHI2015160.37533522614.167.5%
974MIA2014160.50038826216.467.5%
975.5GNB1994160.56338225816.167.5%
975.5NYJ1977140.2141911299.267.5%
977WAS2017160.43834223114.467.5%
978STL1997160.31329920212.667.6%
979SDG2010160.56344129818.667.6%
980WAS2003160.31328719412.167.6%
981WAS1992160.56330020312.767.7%
982WAS1998160.37531921613.567.7%
983MIN1988160.68840627517.267.7%
984OAK2010160.50041027817.467.8%
985NWE1987150.53332021714.567.8%
986SFO1985160.62541127917.467.9%
987DAL1970140.71429920314.567.9%
988BAL1979160.31327118411.567.9%
989PIT2000160.56332121813.667.9%
990WAS2004160.37524016310.267.9%
991NYG1979160.37523716110.167.9%
992PIT2006160.50035324015.068%
993DET1983160.56334723614.868%
994MIA1976140.42926317912.868.1%
995KAN1979160.43823816210.168.1%
996KAN1975140.35728219213.768.1%
997MIA1995160.56339827116.968.1%
999CLE2008160.2502321589.968.1%
999OAK1995160.50034823714.868.1%
999HOU1995160.43834823714.868.1%
1001NOR2012160.43846131419.668.1%
1002MIA1986160.50043029318.368.1%
1003DET2003160.31327018411.568.1%
1004NYJ1992160.2502201509.468.2%
1005CHI1996160.43828319312.168.2%
1006SFO2005160.25023916310.268.2%
1007GNB1996160.81345631119.468.2%
1008DAL2006160.56342529018.168.2%
1009DEN198290.22214810111.268.2%
1010TAM1980160.34427118511.668.3%
1011STL1986160.2812181499.368.3%
1012SDG1972140.321264180.512.968.4%
1013KAN1973140.57123115811.368.4%
1014BUF2018160.37526918411.568.4%
1015CIN2007160.43838026016.368.4%
1016NWE2000160.31327618911.868.5%
1017ATL2014160.37538126116.368.5%
1018OAK2003160.25027018511.668.5%
1019NOR1977140.21423215911.468.5%
1020BUF2011160.37537225515.968.5%
1021ATL2009160.56336324915.668.6%
1022NOR1981160.2502071428.968.6%
1023SFO1973140.35726218012.968.7%
1024DET1984160.281283194.512.268.7%
1025MIA2012160.43828819812.468.8%
1026TEN1997160.50033322914.368.8%
1027SDG1989160.37526618311.468.8%
1028IND2017160.25026318111.368.8%
1029NOR2007160.43837926116.368.9%
1030DET1970140.71434723917.168.9%
1031CIN1974140.50028319513.968.9%
1032NWE1983160.50027418911.869%
1033BUF2006160.43830020712.969%
1034MIA2002160.56337826116.369%
1035TEN2013160.43836225015.669.1%
1036CAR2016160.37536925515.969.1%
1037DAL1973140.71438226418.969.1%
1038DET1980160.56333423114.469.2%
1039NOR1979160.50037025616.069.2%
1040STL1999160.81352636422.869.2%
1041RAI1988160.43832522514.169.2%
1042HOU2006160.37526718511.669.3%
1043SEA198290.444127889.869.3%
1044ATL1993160.37531621913.769.3%
1045NYG1995160.31329020112.669.3%
1046BUF2013160.37533923514.769.3%
1047.5SDG2015160.25032022213.969.4%
1047.5SEA2000160.37532022213.969.4%
1049BUF2009160.37525817911.269.4%
1050CIN2016160.406325225.514.169.4%
1051ATL2013160.25035324515.369.4%
1052HOU2003160.31325517711.169.4%
1053CHI1992160.31329520512.869.5%
1054NWE2009160.62542729718.669.6%
1055ARI2012160.31325017410.969.6%
1056ARI1997160.25028319712.369.6%
1057PHI198290.33319113314.869.6%
1058MIA2015160.37531021613.569.7%
1059RAM1987150.40031722114.769.7%
1060GNB1984160.50039027217.069.7%
1061NWE1993160.31323816610.469.7%
1062CLE2009160.31324517110.769.8%
1063GNB1979160.31324617210.869.9%
1064ATL1981160.43842629818.670%
1065MIA1991160.50034324015.070%
1066SFO1972140.60735324717.670%
1067PIT2007160.62539327517.270%
1068NYG2015160.37542029418.470%
1069WAS2006160.31330721513.470%
1070SDG1991160.25027419212.070.1%
1071DEN1990160.31333123214.570.1%
1072PHI1981160.62536825816.170.1%
1073WAS1980160.37526118311.470.1%
1074NYG1985160.62539928017.570.2%
1075HOU1977140.57129921015.070.2%
1076.5CIN2000160.2501851308.170.3%
1076.5RAM1988160.62540728617.970.3%
1078ATL1994160.43831722313.970.3%
1079TAM2007160.56333423514.770.4%
1080CHI1974140.2861521077.670.4%
1081SDG1971140.42931121915.670.4%
1082ARI2004160.37528420012.570.4%
1083CIN1983160.43834624415.370.5%
1084DET1981160.50039728017.570.5%
1085CIN1972140.57129921115.170.6%
1086TAM2006160.2502111499.370.6%
1087CIN1994160.18827619512.270.7%
1088CLE198290.4441409911.070.7%
1089PHI2008160.594416294.518.470.8%
1090NWE1972140.2141921369.770.8%
1091TAM1993160.31323716810.570.9%
1092ATL1976140.2861721228.770.9%
1093GNB2009160.68846132720.470.9%
1094DET2004160.37529621013.170.9%
1095TAM2018160.31339628117.671%
1096OAK2007160.25028320112.671%
1097PHI1972140.1791451037.471%
1098ARI2016160.46941829718.671.1%
1099PHI2012160.25028019912.471.1%
1100OAK2008160.31326318711.771.1%
1101NOR1973140.3571631168.371.2%
1102PIT1990160.56329220813.071.2%
1103NYG1977140.3571811299.271.3%
1104CAR1995160.43828920612.971.3%
1105SFO198290.33320914916.671.3%
1106BUF1970140.250204145.510.471.3%
1107CHI1983160.50031122213.971.4%
1108NYJ198290.66724517519.471.4%
1109DEN2009160.50032623314.671.5%
1110ATL1984160.25028120112.671.5%
1111CHI1976140.50025318112.971.5%
1112NWE1974140.50034824917.871.6%
1113JAX2002160.37532823514.771.6%
1114TAM1988160.31326118711.771.6%
1115GNB1986160.25025418211.471.7%
1116ARI2005160.31331122313.971.7%
1117JAX2003160.31327619812.471.7%
1118NYJ2018160.25033323914.971.8%
1119HOU2004160.43830922213.971.8%
1120WAS2010160.37530221713.671.9%
1121BAL1971140.71431322516.171.9%
1122NYG1992160.37530622013.871.9%
1123CIN1992160.31327419712.371.9%
1124TEN2015160.18829921513.471.9%
1125HOU2015160.56333924415.372%
1126CIN1998160.18826819312.172%
1127IND1986160.18822916510.372.1%
1128JAX2015160.31337627116.972.1%
1129NOR1985160.31329421213.372.1%
1130BAL2009160.56339128217.672.1%
1131SFO2010160.37530522013.872.1%
1132RAM1990160.31334524915.672.2%
1133NYJ1990160.37529521313.372.2%
1134.5OAK1997160.25032423414.672.2%
1134.5SFO1976140.57127019513.972.2%
1136DAL1986160.43834625015.672.3%
1137NYG2004160.37530321913.772.3%
1138CHI1984160.62532523514.772.3%
1139PIT1986160.37530722213.972.3%
1140PIT2003160.37530021713.672.3%
1141MIN1986160.56339828818.072.4%
1142DET2010160.37536226216.472.4%
1143PHI1970140.250241174.512.572.4%
1144ATL1990160.31334825215.872.4%
1145NOR1991160.68834124715.472.4%
1146SEA1994160.37528720813.072.5%
1147DEN1988160.50032723714.872.5%
1148NYG1987150.40028020313.572.5%
1149HOU1970140.250217157.511.372.6%
1150NYJ1993160.50027019612.372.6%
1151TAM1978160.31324117510.972.6%
1152DEN1972140.35732523616.972.6%
1153NYG2014160.37538027617.372.6%
1154OAK1996160.43834024715.472.6%
1155CIN2006160.50037327116.972.7%
1156BUF2012160.37534425015.672.7%
1157PHO1990160.31326819512.272.8%
1158MIN1984160.18827620112.672.8%
1159ARI2003160.25022516410.372.9%
1160ATL2003160.31329921813.672.9%
1161.5TAM2013160.25028821013.172.9%
1161.5SFO2003160.43838428017.572.9%
1163TEN2004160.31334425115.773%
1164STL1998160.25028520813.073%
1165BUF2005160.31327119812.473.1%
1166SDG2016160.31341030018.873.2%
1167DET2005160.31325418611.673.2%
1168NWE1973140.35725818913.573.3%
1169WAS2011160.31328821113.273.3%
1170DET1976140.42926219213.773.3%
1171.5TEN2010160.37535626116.373.3%
1171.5PIT1981160.50035626116.373.3%
1173GNB1971140.35727420114.473.4%
1174ATL2000160.25025218511.673.4%
1175TAM2017160.31333524615.473.4%
1176BUF2016160.43839929318.373.4%
1177.5KAN2007160.25022616610.473.5%
1177.5DAL198290.66722616618.473.5%
1179MIA2006160.37526019111.973.5%
1180HOU1971140.321251184.513.273.5%
1181NYJ2007160.25026819712.373.5%
1182STL1970140.60732523917.173.5%
1183STL1971140.32123117012.173.6%
1184IND1984160.25023917611.073.6%
1185.5BAL2007160.31327520312.773.8%
1185.5JAX1995160.25027520312.773.8%
1187DEN2010160.25034425415.973.8%
1188NYJ2003160.37528320913.173.9%
1189RAM1991160.18823417310.873.9%
1190CAR1997160.43826519612.374%
1191CHI2014160.31331923614.874%
1192SEA2015160.62542331319.674%
1193ATL1992160.37532724215.174%
1194LAR2016160.25022416610.474.1%
1195DEN1970140.393253187.513.474.1%
1196ATL1987150.20020515210.174.1%
1197TAM2011160.25028721313.374.2%
1198.5GNB1974140.42921015611.174.3%
1198.5PIT1970140.35721015611.174.3%
1200CLE1975140.21421816211.674.3%
1201DAL1997160.37530422614.174.3%
1202CLE2013160.25030822914.374.4%
1203DAL2001160.31324618311.474.4%
1204HOU1986160.31327420412.874.5%
1205GNB1980160.34423117210.874.5%
1206OAK2012160.25029021613.574.5%
1207CLE2000160.1881611207.574.5%
1208.5DAL2015160.25027520512.874.5%
1208.5MIA2004160.25027520512.874.5%
1210ATL1988160.31324418211.474.6%
1211CAR2011160.37540630318.974.6%
1212DET2018160.37532424215.174.7%
1213NOR1976140.28625318913.574.7%
1214DET1973140.464271202.514.574.7%
1215DET1986160.31327720712.974.7%
1216CIN1987150.26728521314.274.7%
1217CIN1989160.50040430218.974.8%
1218BAL1973140.28622616912.174.8%
1219JAX2017160.62541731219.574.8%
1220GNB2008160.37541931419.674.9%
1221KAN198290.33317613214.775%
1222CHI2002160.25028121113.275.1%
1223BAL2005160.37526519912.475.1%
1224HOU2002160.25021316010.075.1%
1225OAK2005160.25029021813.675.2%
1226BAL2017160.56339529718.675.2%
1227CLE1984160.31325018811.875.2%
1228PHI2016160.43836727617.375.2%
1229SFO1974140.42922617012.175.2%
1230CHI1980160.43830422914.375.3%
1231CHI1973140.21419514710.575.4%
1232.5NYJ2005160.25024018111.375.4%
1232.5HOU1984160.18824018111.375.4%
1234WAS1970140.42929722416.075.4%
1235CLE1991160.37529322113.875.4%
1236RAM1972140.464291219.515.775.4%
1237CLE1995160.31328921813.675.4%
1238WAS2013160.18833425215.875.4%
1239KAN1987150.26727320613.775.5%
1240DET1998160.31330623114.475.5%
1241PHI2011160.50039629918.775.5%
1242PHO1991160.2501961489.375.5%
1243ARI2002160.31326219812.475.6%
1244GNB1975140.28622617112.275.7%
1245MIA2011160.37532924915.675.7%
1246BUF2003160.37524318411.575.7%
1247PHO1993160.43832624715.475.8%
1248CLE2012160.31330222914.375.8%
1249JAX2018160.31324518611.675.9%
1250IND1985160.31332024315.275.9%
1251NYJ1975140.21425819614.076%
1252ATL1989160.18827921213.376%
1253SFO1975140.35725519413.976.1%
1254WAS2014160.25030122914.376.1%
1255CHI1998160.25027621013.176.1%
1256CLE2011160.25021816610.476.1%
1257KAN1983160.37538629418.476.2%
1258STL1979160.31330723414.676.2%
1259TAM1987150.26728621814.576.2%
1260CIN2008160.281204155.59.776.2%
1261OAK2014160.18825319312.176.3%
1262BUF2010160.25028321613.576.3%
1263DET2012160.25037228417.876.3%
1264PHI1998160.1881611237.776.4%
1265ARI2018160.18822517210.876.4%
1266SEA1991160.43827621113.276.4%
1267RAM1977140.71430223116.576.5%
1268WAS1994160.18832024515.376.6%
1269CIN1978160.25025219312.176.6%
1270BUF198290.44415011512.876.7%
1271SDG2003160.25031324015.076.7%
1272NYJ2014160.25028321713.676.7%
1273PIT1985160.43837929118.276.8%
1274SDG2001160.31333225515.976.8%
1275NYJ1980160.25030223214.576.8%
1276KAN2009160.25029422614.176.9%
1277ATL1985160.25028221713.677%
1278.5JAX2011160.31324318711.777%
1278.5PHO1992160.25024318711.777%
1280HOU1976140.35722217112.277%
1281NOR1974140.3571661289.177.1%
1282SEA1993160.37528021613.577.1%
1283DEN2017160.31328922313.977.2%
1284NYJ1970140.28625519714.177.3%
1285DET1988160.25022017010.677.3%
1286NYJ2009160.56334826916.877.3%
1287NOR1970140.1791721339.577.3%
1288RAM1993160.31322117110.777.4%
1289TAM2009160.18824418911.877.5%
1290SDG1990160.37531524415.377.5%
1291MIN1990160.37535127217.077.5%
1292CLE2003160.31325419712.377.6%
1293SFO2004160.12525920112.677.6%
1294NYG1976140.2141701329.477.6%
1295.5CHI2017160.31326420512.877.7%
1295.5NYG1978160.37526420512.877.7%
1297TAM1977140.143103805.777.7%
1298DET1987150.26726920913.977.7%
1299KAN2012160.12521116410.377.7%
1300SFO1977140.35722017112.277.7%
1301NOR1986160.43828822414.077.8%
1302DET1996160.31330223514.777.8%
1303DAL2000160.31329422914.377.9%
1304.5TEN2005160.25029923314.677.9%
1304.5STL1980160.31329923314.677.9%
1306OAK2013160.25032225115.778%
1307BUF1978160.31330223614.878.1%
1308ATL1977140.50017914010.078.2%
1309CAR1998160.25033626316.478.3%
1310TAM1992160.31326720913.178.3%
1311SFO1999160.25029523114.478.3%
1312.5STL2007160.18826320612.978.3%
1312.5CHI1997160.25026320612.978.3%
1314DET1992160.31327321413.478.4%
1315CHI1989160.37535828117.678.5%
1316DET2006160.18830524015.078.7%
1317RAI1987150.33330123715.878.7%
1318JAX2000160.43836728918.178.7%
1319NYJ1973140.28624018913.578.8%
1320SEA2009160.31328022113.878.9%
1321SDG1997160.25026621013.178.9%
1322TAM2004160.31330123814.979.1%
1323TAM1986160.12523918911.879.1%
1324CIN1991160.18826320813.079.1%
1325NOR2005160.18823518611.679.1%
1326GNB2005160.25029823614.879.2%
1327SFO2018160.25034227116.979.2%
1328ATL1974140.214111886.379.3%
1329NYG1996160.37524219212.079.3%
1330IND1998160.18831024615.479.4%
1331SFO2000160.37538830819.379.4%
1332PHI1976140.2861651319.479.4%
1333CLE2015160.18827822113.879.5%
1334BAL1996160.25037129518.479.5%
1335BAL1972140.35723518713.479.6%
1336DAL1988160.18826521113.279.6%
1337STL2014160.37532425816.179.6%
1338WAS2009160.25026621213.379.7%
1339DET2009160.12526220913.179.8%
1340JAX2006160.50037129618.579.8%
1341PIT1999160.37531725315.879.8%
1342SDG1975140.14318915110.879.9%
1343TAM1991160.1881991599.979.9%
1344RAI1992160.43824919912.479.9%
1345CIN1979160.25033727016.980.1%
1346JAX2016160.18831825515.980.2%
1347CHI1978160.43825320312.780.2%
1348CLE1990160.18822818311.480.3%
1349BAL1981160.12525920813.080.3%
1350IND1991160.0631431157.280.4%
1351HOU2013160.12527622213.980.4%
1352PHI1975140.28622518112.980.4%
1353SFO2009160.50033026616.680.6%
1354NOR1998160.37530524615.480.7%
1355HOU2017160.25033827317.180.8%
1356NWE1992160.12520516610.481%
1357CHI1972140.321225182.513.081.1%
1358NOR1996160.18822918611.681.2%
1359DEN1971140.32120316511.881.3%
1360NWE1975140.21425821015.081.4%
1361CLE2004160.25027622514.181.5%
1362JAX2014160.18824920312.781.5%
1363BUF1986160.25028723414.681.5%
1364NYJ1976140.2141691389.981.7%
1365.5GNB1988160.25024019612.381.7%
1365.5ATL1975140.28624019614.081.7%
1367CLE1974140.28625120514.681.7%
1368STL2011160.1251931589.981.9%
1369SEA2008160.25029424115.182%
1370CIN2010160.25032226416.582%
1371RAM198290.22220016418.282%
1372NYG1974140.14319516011.482.1%
1373NYG1973140.179226185.513.382.1%
1374PHI1977140.35722018112.982.3%
1375.5MIN2011160.18834028017.582.4%
1375.5CIN1993160.1881871549.682.4%
1377TAM2003160.43830124815.582.4%
1378IND1997160.18831325816.182.4%
1379BOS1970140.1431491238.882.6%
1380BUF2001160.18826521913.782.6%
1381.5CAR2010160.12519616210.182.7%
1381.5JAX2001160.37529424315.282.7%
1383NOR1975140.1431651379.883%
1384IND1993160.2501891579.883.1%
1385BUF1977140.2141601339.583.1%
1386NYJ1995160.18823319412.183.3%
1387DET2002160.18830625515.983.3%
1388NOR1999160.18826021713.683.5%
1389SDG1973140.17918815711.283.5%
1390KAN1978160.25024320312.783.5%
1391RAM1994160.25028623914.983.6%
1392ATL1996160.18830925916.283.8%
1393HOU198290.11113611412.783.8%
1394HOU1983160.12528824215.184%
1395TAM1983160.12524120312.784.2%
1396BAL1974140.14319016111.584.7%
1397CLE1999160.12521718411.584.8%
1398PIT1976140.71434229020.784.8%
1399SEA1980160.25029124715.484.9%
1400SEA1992160.1251401197.485%
1401JAX2012160.12525521713.685.1%
1402CIN1971140.28628424317.485.6%
1403NOR1972140.17921518413.185.6%
1404OAK2006160.1251681449.085.7%
1405HOU2005160.12526022313.985.8%
1406STL2008160.12523219912.485.8%
1407HOU1973140.07119917112.285.9%
1408DET2001160.12527023414.686.7%
1409NYG2017160.18824621413.487%
1410HOU1972140.07116414310.287.2%
1411IND2011160.12524321213.387.2%
1412GNB1991160.25027323914.987.5%
1413KAN1977140.14322519714.187.6%
1414TAM2014160.12527724415.388.1%
1415CHI2016160.18827924615.488.2%
1416KAN2008160.12529125716.188.3%
1417BUF1976140.14324521715.588.6%
1418DET1979160.12521919412.188.6%
1419BUF1971140.07118416311.688.6%
1420SDG1986160.25033529718.688.7%
1421HOU1994160.12522620112.688.9%
1422SEA1976140.14322920414.689.1%
1423NYG1983160.21926723814.989.1%
1424TEN2014160.12525422814.389.8%
1425NWE1981160.12532229318.391%
1426BAL198290.05611310311.491.2%
1427NWE1990160.06318116610.491.7%
1428BUF1984160.12525023014.492%
1429NYJ1996160.06327925716.192.1%
1430SFO1979160.12530828417.892.2%
1431SFO1978160.12521920212.692.2%
1432SFO2016160.12530928617.992.6%
1433NOR1980160.06329127016.992.8%
1434CLE2016160.06326424615.493.2%
1435CIN2002160.12527926116.393.5%
1436MIA2007160.06326725015.693.6%
1437SDG2000160.06326925215.893.7%
1438STL2009160.06317516410.393.7%
1439TAM1985160.12529427617.393.9%
1440CAR2001160.06325323914.994.5%
1441BUF1985160.12520018911.894.5%
1442DAL1989160.06320420012.598%
1444CLE2017160.00023423414.6100%
1444DET2008160.00026826816.8100%
1444TAM1976140.0001251258.9100%

If the Seahawks can keep this up, they will wind up being the most efficient team at distributing their points across games for any team since 1970.

{ 0 comments }

Tom Brady has a whopping 34 throwaways this year, which is an outlier for him (for reference, last year he had 22 on 84 more pass attempts); it also leads the league by a large margin.

Games Passing
Rk Player Tm Age Pos G GS Cmp Att Yds Bats Throwawy
Spikes Drops Drop% BadTh Bad% OnTgt OnTgt%
1 Tom Brady NWE 42 QB 12 12 297 486 3268 5 34 0 26 5.8% 88 19.5% 334 73.9%
2 Aaron Rodgers GNB 36 QB 12 12 266 413 3065 2 24 1 13 3.4% 78 20.1% 298 76.8%
3 Josh Allen BUF 23 QB 12 12 225 366 2591 6 22 3 23 6.7% 65 19.1% 259 76.0%
4 Kyle Allen CAR 23 QB 10 10 225 366 2457 11 22 0 23 6.7% 58 16.9% 266 77.3%
5 Kirk Cousins MIN 31 QB 12 12 248 358 3032 7 21 0 16 4.7% 51 15.1% 272 80.7%
6 Matt Ryan ATL 34 QB 11 11 301 447 3246 13 19 1 12 2.8% 60 14.1% 328 76.8%
7 Jameis Winston TAM 25 QB 12 12 281 467 3659 9 17 2 19 4.2% 92 20.5% 318 71.0%
8 Kyler Murray ARI 22 QB 12 12 273 427 2866 15 17 3 16 3.9% 75 18.4% 298 73.2%
9 Derek Carr OAK 28 QB 12 12 259 367 2843 7 16 1 16 4.6% 41 11.7% 283 80.9%
10 Sam Darnold NYJ 22 QB 9 9 196 311 2154 8 16 1 16 5.4% 54 18.4% 222 75.5%

[continue reading…]

{ 1 comment }

This graph shows every game this season. The X-Axis shows the Game Script in each game, for both teams, and the Y-Axis shows the pass ratio by each team in that game. As always, these is a relatively strong relationship between these two variables.

We can also calculate this on the season level, for all 32 teams, on both offense and defense. That’s what I did in the graph below, and there are three notable outliers among the league’s best teams: the Ravens offense, which is extremely run-heavy even given its Game Script, the Patriots offense, which is remarkably pass-heavy given its Game Script, and the 49ers defense, against which teams seem to avoid passing even given the largely negative Game Script those opponents face. I have shaded them in those colors below. [continue reading…]

{ 1 comment }

Previously:

The Vikings have been one of the most run-heavy teams in the NFL under head coach Mike Zimmer.  That made some sense when Minnesota’s passing game wasn’t very good, but that’s no longer the case.  This year, quarterback Kirk Cousins has been one of the most valuable passers in the NFL,  leading the second most efficient passing attack through 13 weeks.  But even in 2019, Minnesota has been pretty run-heavy… until week 13 against Seattle.

The graph below shows Minnesota’s Game Script (X-Axis) and Pass Ratio (Y-Axis) for each game this season.  The Seahawks game is a pretty clear outlier: this was the most pass-happy game of the season, and it came during a neutral Game Script.

The table below shows the full week 13 Game Scripts data. [continue reading…]

{ 0 comments }

Previous Passing Stats:

It has been a rough year for California quarterbacks Jared Goff and Aaron Rodgers. Prior to week 13, Goff’s last 16 regular season games had produced just 17 passing touchdowns against 18 interceptions, along with 16 fumbles. Rodgers has had an up-and-down year, and the murmurs are continuing to grow about whether his best days are behind him.

In week 13, however, the two Golden Bears had outstanding games. Goff threw for 424 yards and 2 TDs on 43 passes, with only one sack and no interceptions or fumbles in a blowout win over the Cardinals. It’s probably worth noting that 66% of Goff’s yards came after the catch, as his receivers finished with a whopping 282 YAC on Sunday. As for Rodgers, he threw 4 TDs and didn’t take a sack or throw an interception in a blowout win in the snow against the Giants.

The table below shows the week 13 stats.
[continue reading…]

{ 0 comments }

#NFL100 – Top 12 Running Backs

As you probably know, the NFL is announcing its top 100 players in league history as part of its 100-year anniversary. The nominating committee selected 24 running backs as finalists, and with the exception of active RB Adrian Peterson, every player is in the Hall of Fame. For the final team, 12 running backs were chosen. The table below shows the finalists and those selected for the official team:

PlayerTeamsFirst YrLast YrSelected?
Dutch ClarkPortsmouth Spartans/Detroit Lions19311938Selected
Steve Van BurenPhiladelphia Eagles19441951Selected
Marion MotleyCleveland Browns; Pittsburgh Steelers19461955Selected
Jim BrownCleveland Browns19571965Selected
Lenny MooreBaltimore Colts19561967Selected
Gale SayersChicago Bears19651971Selected
O.J. SimpsonBuffalo Bills; San Francisco 49ers19691979Selected
Walter PaytonChicago Bears19751987Selected
Earl CampbellHouston Oilers; New Orleans Saints19781985Selected
Eric DickersonLos Angeles Rams; Indianapolis Colts; Los Angeles Raiders; Atlanta Falcons19831993Selected
Barry SandersDetroit Lions19891998Selected
Emmitt SmithDallas Cowboys; Arizona Cardinals19902004Selected
Marcus AllenLos Angeles Raiders; Kansas City Chiefs19821997Finalist
Jerome BettisLos Angeles/St. Louis Rams; Pittsburgh Steelers19932005Finalist
Tony DorsettDallas Cowboys; Denver Broncos19771988Finalist
Marshall FaulkIndianapolis Colts; St. Louis Rams19942005Finalist
Red GrangeChicago Bears; New York Yankees19251934Finalist
Franco HarrisPittsburgh Steelers; Seattle Seahawks19721984Finalist
Hugh McElhennySan Francisco 49ers; Minnesota Vikings; New York Giants; Detroit Lions19521964Finalist
Bronko NagurskiChicago Bears19301943Finalist
Adrian PetersonMinnesota Vikings; New Orleans Saints; Arizona Cardinals; Washington Redskins20072019Finalist
Jim TaylorGreen Bay Packers; New Orleans Saints19581967Finalist
Thurman ThomasBuffalo Bills; Miami Dolphins19882000Finalist
LaDainian TomlinsonSan Diego Chargers; New York Jets20012011Finalist

[continue reading…]

{ 0 comments }

Previously:

There have been just 5 games through the first 12 weeks of the season where one team led, on average, by at least 20 points throughout the game. Two of those games were Patriots blowouts of the Jets, where New England dominated from start to finish and the Jets offense never scored in 120 minutes. The other 3 games were all Baltimore Ravens wins: over Miami in week 1, over Cincinnati in week 10, and then most impressively, against the Rams in week 12. For the season, New England still has the best Game Script overall (+9.3), but the Ravens (+8.9) are closing in, and the 49ers (+7.1) are the only other team above +3.3.

In week 12, the Colts and Bills stood out as extremely run-heavy. For Indianapolis, what more is there to say than this: the Colts trailed by 3 points during every play run by the team in the 4th quarter. Indianapolis called 15 plays during this time period, and 10 of them were runs.

Jacoby Brissett finished 16 of 25 for just 129 passing yards, with one sack and three scrambles for 15 yards. He averaged just 2.6 air yards per completion. Meanwhile, Colts running backs Jonathan Williams and Nyheim Hines had 34 carries for 155 yards and a touchdown, and Indianapolis has seemed to become more run-heavy as the season progressed. Since Brissett’s injury against the Steelers, he has not looked very good. On the season, the Colts rank 3rd in rushing yards and 29th in passing yards, which makes the decision to extend Brissett in September look even more curious.

As for Buffalo, it’s not surprising to see the Bills take the air out of the ball when they control the game. Buffalo finished with three 50+ yard rushers in a 20-3 win against the Broncos, and set a season high with 244 rushing yards. The table below shows the full week 12 Game Scripts data: [continue reading…]

{ 0 comments }

Previously:

Way back in week 1, the Buffalo Bills beat the Jets with a Game Script of -6.9. That was the worst Game Script by any victorious team all season long, until the Vikings pulled off a remarkable comeback in week 11. The Broncos led 20-0 at halftime, and 23-7 entering the fourth quarter in a game that looked hopeless for Minnesota. And then Kirk Cousins went 9 of 10 (with 1 sack for -1 yard) for 149 passing yards, 5 first downs, and 2 touchdowns in the fourth quarter. In the final frame, he had touchdown throws of 32 and 54 yards, completed 9-yard and 7-yard passes on two 3rd-and-5s, and hit a 21-yard completion as well. It was an outstanding comeback in every sense of the word, but notable here for the win with an awful Game Script.

In week 11, there were three teams that had run/pass ratios far from what you would expect given the Game Script. In a matchup of highly drafted quarterbacks experiencing regression this year, the Rams defeated the Bears, 17-7, in a game that was closer than the score indicates. The game was 10-7 before a late Los Angeles touchdown, and the Rams finished the game on their last possession with five straight runs. Even including those, Los Angeles passed on only 35% of its plays in this tight game (and excluding that final drive, L.A. passed on only 38% of plays): and it’s not like the ground game was dominant. Todd Gurley had 25 carries for 97 yards and 6 first downs (and a lost fumble), while the other Rams rushers (excluding Jared Goff) had 6 carries for 10 yards and 1 first down. This may have been a reflection of the team’s lack of trust in Goff, or perhaps a lack of concern as to what Mitchell Trubisky would be able to do on the other side. Los Angeles opened the second half by gaining just 36 yards and 1 first down on the team’s first five drives.

Of course, there’s another reason why Los Angeles leaned so heavily on the ground game: Robert Woods missed the game due to personal reasons, and Brandin Cooks was out with a concussion.  That left TE Johnny Mundt playing the majority of the game, and the other Mike Thomas to be the team’s third receiver.

The full week 11 Game Scripts, below:
[continue reading…]

{ 0 comments }

The 2019 NFC East Looks Historically Bad

We knew the Washington Redskins would be awful this year, and the New York Giants are playing down to poor expectations, too. Both teams are 2-9 through 11 weeks, with one of those wins being a head-to-head Giants victory. The other three wins?

  • The Giants beat Tampa Bay, 32-31, when the Bucs missed a 34-yard field goal at the final gun.
  • The Redskins beat Miami, 17-16, when the Dolphins failed on a 2-point conversion attempt with 6 seconds remaining.
  • Washington beat Detroit (playing backup Jeff Driskel), 19-16, with a game-winning field goal in the final 20 seconds.

The strength of the division was supposed to be Dallas and Philadelphia, but that hasn’t quite worked out, either. The Eagles have been big disappointments, particularly on offense (the team ranks in the bottom 10 in yards, yards per pass attempt, and turnovers): Philadelphia is just 5-6, and 4-5 outside of NFC East play. The Cowboys have played really well against bad teams and rank in 8th in both points per game and points per game allowed; and yet Dallas is just 6-6, with all 6 wins coming against teams with losing records. The Cowboys are 2-6 outside of the division, and have lost as touchdown favorites to both the Jets and Bills.

Altogether, the NFC East is just 9-24 this season in non-division games, easily the worst mark in the NFL. And this is despite the division drawing the AFC East, projected to be the worst division in football (again) this year. In fact, the AFC East has the second-best record among the 8 divisions, but there’s a chicken-or-egg situation going on here: does the AFC East have a good record because it’s good, or because it’s playing the NFC East? The AFC East is 10-4 against the NFC East so far this season. [continue reading…]

{ 0 comments }

Ravens second-year quarterback Lamar Jackson has become the NFL’s most exciting player.  Jackson is combining rushing quantity at the quarterback position at a level that we’ve never quite seen before — at least, not in the NFL.  Jackson is tied for 5th in the NFL with 46 rushing first downs, but the Ravens a hardly a one-man show.  Starting running back Mark Ingram is also one of the 12 players in the NFL with 40+ rushing first downs, and backup Gus Edwards is one of the 16 players in the NFL with at least 30+ rushing first downs.

Baltimore has amassed 129 rushing first downs already this year; the 2018 Ravens set the modern record with 153 first downs last season, and this year’s team will smash that mark.  The most dominant rushing team in history was the 1978 Patriots, who rushed for a record 3,165 yards and also picked up a record 181 first downs.  Both of those marks are in jeopardy, as the 2019 Ravens are on pace to finish with 3,369 rushing yards and 188 first downs.

How insanely good are the Ravens at picking up first downs? The graph below shows each team this season, and the number of passing first downs (X-Axis) and rushing first downs (Y-Axis) from each offense. [continue reading…]

{ 1 comment }

There have been 13 games this season where a team has allowed 100 or fewer passing yards. The San Francisco 49ers have caused 5 of those games.

Through 11 games, San Francisco has allowed just 1,506 passing yards. That’s the fewest by any team through 11 games since the 1989 Minnesota Vikings, and it’s the second lowest amount for any team after 11 games since 1980.

This year, the average team is gaining 235 passing yards per game, which is of course net of sack yards lost. The 49ers are allowing just 137 passing yards per game to opponents, for well, a variety of reasons:

  • The 49ers have caused opponents to lose 348 yards due to sacks this year, the most in the NFL.
  • The 49ers are allowing just 9.4 yards per completion, the lowest rate in the NFL.
  • The 49ers have sacked opponents on 11.8% of dropbacks, the best rate in the NFL.
  • The 49ers are allowing a 60.0% completion percentage, tied for the 2nd-best rate in the NFL. That’s why San Francisco is allowing just 4.0 net yards per pass attempt, the lowest in the NFL.
  • Despite the 49ers usually playing with a lead, opponents appear afraid of throwing on San Francisco, probably because it is so hopeless.
  • And yes, they’ve had some help: a driving rainstorm in a game against Washington, and a run defense that is actually quite porous. Teams have actually been more efficient running against San Francisco than throwing against that defense.

So how good is this pass defense through 11 games once you account for era — at least, in terms of preventing passing yards? Well, maybe the best ever? San Francisco is allowing 98.5 fewer passing yards per game than league average through 11 games, which is the best performance by any pass defense since 1950. The table below shows the top 100 pass defenses by this metric:
[continue reading…]

{ 1 comment }

Previous Passing Stats:

The story of week 12 was the dominance of the 2018 quarterback class, which is now headlined by Lamar Jackson. The Ravens sensation had his second game with 4 or more passing TDs and at least 75 rushing yards in 8 days; there had only been six of those games in the NFL from 1950 until two weeks ago.

Sam Darnold had the best game of his career in a blowout over the Raiders. The Jets young quarterback averaged a career high 10.86 yards per attempt, threw two touchdowns and ran for a third, and took just one sack.

Baker Mayfield also had a dominant performance, putting together a 327-yard, 3-TD game while completing 71% of his passes. Yes, his opponent was the Dolphins, but it continued the second half trend that Darnold and Mayfield seem to be exhibiting.

Josh Allen had the weakest game of the bunch, but was still efficient in a Bills victory. He averaged 6.73 ANY/A as a passer, but also rushed 8 times for 57 yards (excluding kneels), picking up 4 first downs, including 3 on third down.

The table below shows the week 12 passing stats. In general, this was a pretty rough week for passing, other than the 2018 class and the annual “Ryan Tannehill did what?” week of the year. In particular, Jeff Driskel, Brandon Allen, and yes, Aaron Rodgers, had miserable games. [continue reading…]

{ 0 comments }

Frank Gore Is Remarkable, Part 2

Frank Gore keeps inspiring these posts. Yesterday, Frank Gore rushed for 65 yards, which gives him 19,155 yards from scrimmage for his career, moving him into 4th-place on the all-time list.

 
Rank Player Scrimmage Yards Years Tm
1 Jerry Rice+ 23,540 1985-2004 3TM
2 Emmitt Smith+ 21,579 1990-2004 2TM
3 Walter Payton+ 21,264 1975-1987 chi
4 Frank Gore 19,155 2005-2019 4TM
5 Marshall Faulk+ 19,154 1994-2005 2TM
6 LaDainian Tomlinson+ 18,456 2001-2011 2TM
7 Barry Sanders+ 18,190 1989-1998 det
8 Marcus Allen+ 17,654 1982-1997 2TM
9 Curtis Martin+ 17,430 1995-2005 2TM
10 Larry Fitzgerald 16,940 2004-2019 crd

This was also his 149th game with at least 50 rushing yards, which moved him alone into 2nd place in that category, too.

 
Rk Player From To Tm W L T W-L% 50+ Rush Yd G
1 Emmitt Smith* 1990 2004 DAL/ARI 112 61 0 .647 173
2 Frank Gore 2005 2019 SFO/MIA/IND/BUF 89 59 1 .601 149
3 Walter Payton* 1975 1987 CHI 94 54 0 .635 148
4 Curtis Martin* 1995 2005 NYJ/NWE 82 53 0 .607 135
5 Barry Sanders* 1989 1998 DET 67 61 0 .523 128
6 Jerome Bettis* 1993 2005 PIT/RAM/STL 83 44 0 .654 127
7 LaDainian Tomlinson* 2001 2011 SDG/NYJ 80 45 0 .640 125
8 Tony Dorsett* 1977 1988 DAL/DEN 86 33 0 .723 119
9 Franco Harris* 1972 1984 PIT/SEA 92 26 1 .777 119
10 Adrian Peterson 2007 2019 MIN/ARI/WAS 69 48 1 .589 118

Gore is 17 touches away from 4,000 touches, and 20 touches away from moving ahead of Curtis Martin into third place on that all-time list, too. But the stat that everyone is talking about now is that Gore moved ahead of Barry Sanders into third-place on the all-time rushing list.

 
Rank Player Rushing Yards Years Tm
1 Emmitt Smith+ 18,355 1990-2004 2TM
2 Walter Payton+ 16,726 1975-1987 chi
3 Frank Gore 15,289 2005-2019 4TM
4 Barry Sanders+ 15,269 1989-1998 det
5 Curtis Martin+ 14,101 1995-2005 2TM
6 Adrian Peterson 13,861 2007-2019 4TM
7 LaDainian Tomlinson+ 13,684 2001-2011 2TM
8 Jerome Bettis+ 13,662 1993-2005 2TM
9 Eric Dickerson+ 13,259 1983-1993 4TM
10 Tony Dorsett+ 12,739 1977-1988 2TM
11 Jim Brown+ 12,312 1957-1965 cle

And while Gore was not as dominant as Sanders or Smith or Payton, in some ways that makes what he’s done more remarkable. The graph below shows the career rushing yards, after game X, for each of the players who rank in the top 5 in career rushing yards. Nobody but Hall of Fame running backs can keep producing after 150 games, but that’s what Gore has done. He was never as talented as Sanders or Payton, but his durability, toughness, and consistency is just as remarkable as the talent that those two backs had.

Prior to Gore, only three running backs — Emmitt Smith, John Riggins, and Walter Payton — rushed for over 5,000 yards in their 30s. All are Hall of Famers, as are two (Marcus Allen, John Henry Johnson) who came up just short of the post-30, 5K mark. Gore had an excellent career in his 20s, and then became the best running back in his 30s in NFL history. The graph below shows the 100 leaders in rushing yards in history. The X-Axis shows career rushing yards in a player’s 20s; the Y-Axis shows career rushing yards in a player’s 30s. [continue reading…]

{ 0 comments }

Receivers That Have Won An MVP Award

The most famous wide receiver MVP season belongs to Jerry Rice in 1987. That year was one of the most controversial AP MVP awards ever: Joe Montana was the AP’s first-team All-Pro choice, and Jerry Rice was widely considered the best player in the NFL. However, Montana (18 votes) and Rice (30) split the 49ers vote, allowing John Elway to win the AP award with 36 votes despite most people thinking Rice was better than Elway and most voters thinking Montana was better than Elway. That season, the Pro Football Writers of America, the Newspaper Enterprise Association & Jim Thorpe Athletic Club (voting as a collective entity), The Sporting News, Sports Illustrated, the Football Digest, the Maxwell Club of Philadelphia Bert Bell Award, the New York Daily News, and the Minneapolis Star Tribune (Robert Sansevere) all named Rice as their MVP that season, while only Peter King and the Associated Press chose Elway.

Rice was the last wide receiver to win a major MVP award, but he was not the first.

In 1941 and 1942, Don Hutson was the best player in football. In 1941, Hutson received 6 of 9 first place votes, beating out his passer Cecil Isbell, Sid Luckman, and Chicago’s Danny Fortmann (who you really should learn about) to win the award. In ’42, he once again received 6 of 9 first-place votes, this time beating out Bill Dudley and Sammy Baugh.

In 1955, Harlon Hill was named the NEA MVP. That season, Otto Graham won the United Press poll for MVP, picking up 13 of 30 votes, while Hill and Alan Ameche each grabbed 4 votes.

The AFL had a habit of giving its most valuable player award to wide receivers. In 1963, Lance Alworth had a breakout season, and won a close vote over his Chargers teammates to win the United Press International AFL player of the year award. Alworth earned 7 votes, Chargers running back Keith Lincoln and Chargers quarterback Tobin Rote had five each, and Raiders running back Clem Daniels earned the final three votes. Alworth was even better in 1965, but lost the AP MVP vote to Buffalo quarterback Jeff Kemp, 10-8.

In 1964, Patriots wide receiver — and placekicker — picked up 12 of 24 votes to win the UPI Player of the Year award. Cappelletti won the AP MVP that year, too, but neither the AP nor the UPI was considered the official AFL MVP award. That honor belonged to the Sporting News, and Cappy picked up 99 votes to win the official award, too (Alworth was the runner up with 44 votes).

Finally, in 1965 in the NFL, End Pete Retzlaff won the Bert Bell player of the year award, while Jim Brown swept the other major MVP awards.

As Saints wide receiver Michael Thomas continues his dominant season, I thought it would be worthwhile to look back at the past receivers to win a most valuable player trophy.

{ 0 comments }

Pythagenpat Ratings Through 10 Games

The Seattle Seahawks have been one of the biggest outliers in recent history when it comes to winning percentage and points differential. Seattle is 8-2, despite scoring 275 points and allowing 254 points. We can calculate a team’s expected winning percentage — it’s Pythagenpat winning percentage — by using a two-step formula.

First, we calculate the total points scored and points allowed in all Seahawks games (529) and divide it by the number of games played (10, leaving 52.9 total points scored per game). We then take that number and raise it to the 0.251 power, and get a result of 2.71. This is the exponent we use when calculating a team’s expected winning percentage using the traditional Pythagorean formula. The advantage here using this two-step process over a static exponent (like 2.37) is that it recognizes that higher-scoring games provide different environments than lower-scoring games. To calculate Seattle’s expected winning percentage, we would use this formula:

(Points Scored ^ Exponent) / [(Points Scored ^ Exponent) + (Points Allowed ^ Exponent)]

In Seattle’s case, that’s:

(275 ^ 2.71) / (275 ^ 2.71 + 254 ^ 2.71)

[continue reading…]

{ 0 comments }

Players who are in their first three years in the league are responsible for a whopping 45% of all receiving yards this season. That is a new high in the modern era, and since the new CBA was signed in 2011, we have seen a trend of younger players being responsible for more receiving yards.

[continue reading…]

{ 0 comments }

Season Passing Stats, Through 11 Weeks

Which quarterbacks have provided the most passing value above average so far this season? The league is averaging 6.23 ANY/A so far this season, and passing value is calculated as simply ANY/A minus league average, with that difference multiplied by the number of dropbacks for each passer.

RkQuarterbackTmAgeAttYdsTDIntSkYdsANY/AValue
1Patrick MahomesKAN24323280819211839.03935
2Dak PrescottDAL26365322121912948.33794
3Kirk CousinsMIN313202756213221588.43753
4Russell WilsonSEA313272737232271788.27725
5Matthew StaffordDET312912499195181378.15593
6Aaron RodgersGNB363472718172221797.56491
7Lamar JacksonBAL22279225819518917.82473
8Derek CarrOAK28310249415515957.61450
9Deshaun WatsonHOU243312601186311966.89241
10Gardner MinshewJAX233072285134211136.87209
11Jimmy GaroppoloSFO2831724781810191186.76178
12Drew BreesNOR401711296837547.12159
13Matt RyanATL343512663189231696.55120
14Jacoby BrissettIND27260179715415956.63110
15Teddy BridgewaterNOR2719513709211866.6791
16Tom BradyNWE424022752145161176.4487
17Jared GoffLAR2537327831110161176.2614
18Case KeenumWAS31188134394121116.16-13
19Carson WentzPHI273432274164251476.16-25
20Philip RiversLAC3841631691514231306.17-25
21Marcus MariotaTEN26159117972251625.8-79
22Josh AllenBUF233172175137221245.89-115
23Kyler MurrayARI223932703145352375.89-144
24Joe FlaccoDEN34262182265261945.29-270
25Mason RudolphPIT242471551128131025.11-290
26Jameis WinstonTAM2540630781918362225.49-326
27Ryan FitzpatrickMIA37253168788241234.92-361
28Sam DarnoldNYJ2223416001110221384.81-362
29Daniel JonesNYG222971984158322475.1-372
30Andy DaltonCIN32338225298291905.13-403
31Baker MayfieldCLE2434123941112262045.1-415
32Mitchell TrubiskyCHI25282158094231394.72-458
33Kyle AllenCAR232841923109282464.72-471

I am short on time today, so I’ll leave the commentary to you guys.

{ 0 comments }

Stefon Diggs currently ranks 6th in the NFL in receiving yards, which is pretty remarkable given that he’s played on the least pass-happy team in the NFL. Minnesota has played 11 games, and ranks 32nd in pass attempts per game and 26th in total pass attempts. Diggs is averaging 2.75 yards for every Vikings pass attempt, the second-best average in the NFL behind Michael Thomas, who is the best receiver in the NFL.

Courtland Sutton is in a similar situation, except unlike Diggs, he is fighting both low volume and poor quarterback play.  A second round pick out of SMU last year, Sutton is having his breakout season with a combination of Joe Flacco and Brandon Allen at quarterback.  Denver has thrown just 322 passes this season, but Sutton is one of 10 players who have already hit the 800-yard receiving mark.  Sutton is averaging 2.50 yards for every Denver pass attempt; perhaps even more impressive is that he’s responsible for 35% of all Broncos receiving yards, 34% of all Denver first downs, and 44% of Broncos receiving touchdowns.

And then there’s John Brown, the breakout star of the Bills.  He has 35% of all Bills receiving yards this season and a whopping 40% of all Bills receiving first downs.  He is averaging 2.45 receiving yards per Buffalo pass attempt (817 receiving yards, 333 pass attempts).

The graph below shows every player in the NFL this season.  The X-Axis shows the number of pass attempts for that team; the Y-Axis shows the number of receiving yards for that play.  As you can see, Diggs, Sutton, and Brown really stand out (and next to them are Tyler Lockett at 793 yards on 327 Seahawks pass attempts and DeAndre Hopkins at 745, 333). [continue reading…]

{ 0 comments }
Next Posts Previous Posts