
The Seattle Seahawks have been one of the biggest outliers in recent history when it comes to winning percentage and points differential. Seattle is 8-2, despite scoring 275 points and allowing 254 points. We can calculate a team’s expected winning percentage — it’s Pythagenpat winning percentage — by using a two-step formula.
First, we calculate the total points scored and points allowed in all Seahawks games (529) and divide it by the number of games played (10, leaving 52.9 total points scored per game). We then take that number and raise it to the 0.251 power, and get a result of 2.71. This is the exponent we use when calculating a team’s expected winning percentage using the traditional Pythagorean formula. The advantage here using this two-step process over a static exponent (like 2.37) is that it recognizes that higher-scoring games provide different environments than lower-scoring games. To calculate Seattle’s expected winning percentage, we would use this formula:
(Points Scored ^ Exponent) / [(Points Scored ^ Exponent) + (Points Allowed ^ Exponent)]
In Seattle’s case, that’s:
(275 ^ 2.71) / (275 ^ 2.71 + 254 ^ 2.71)
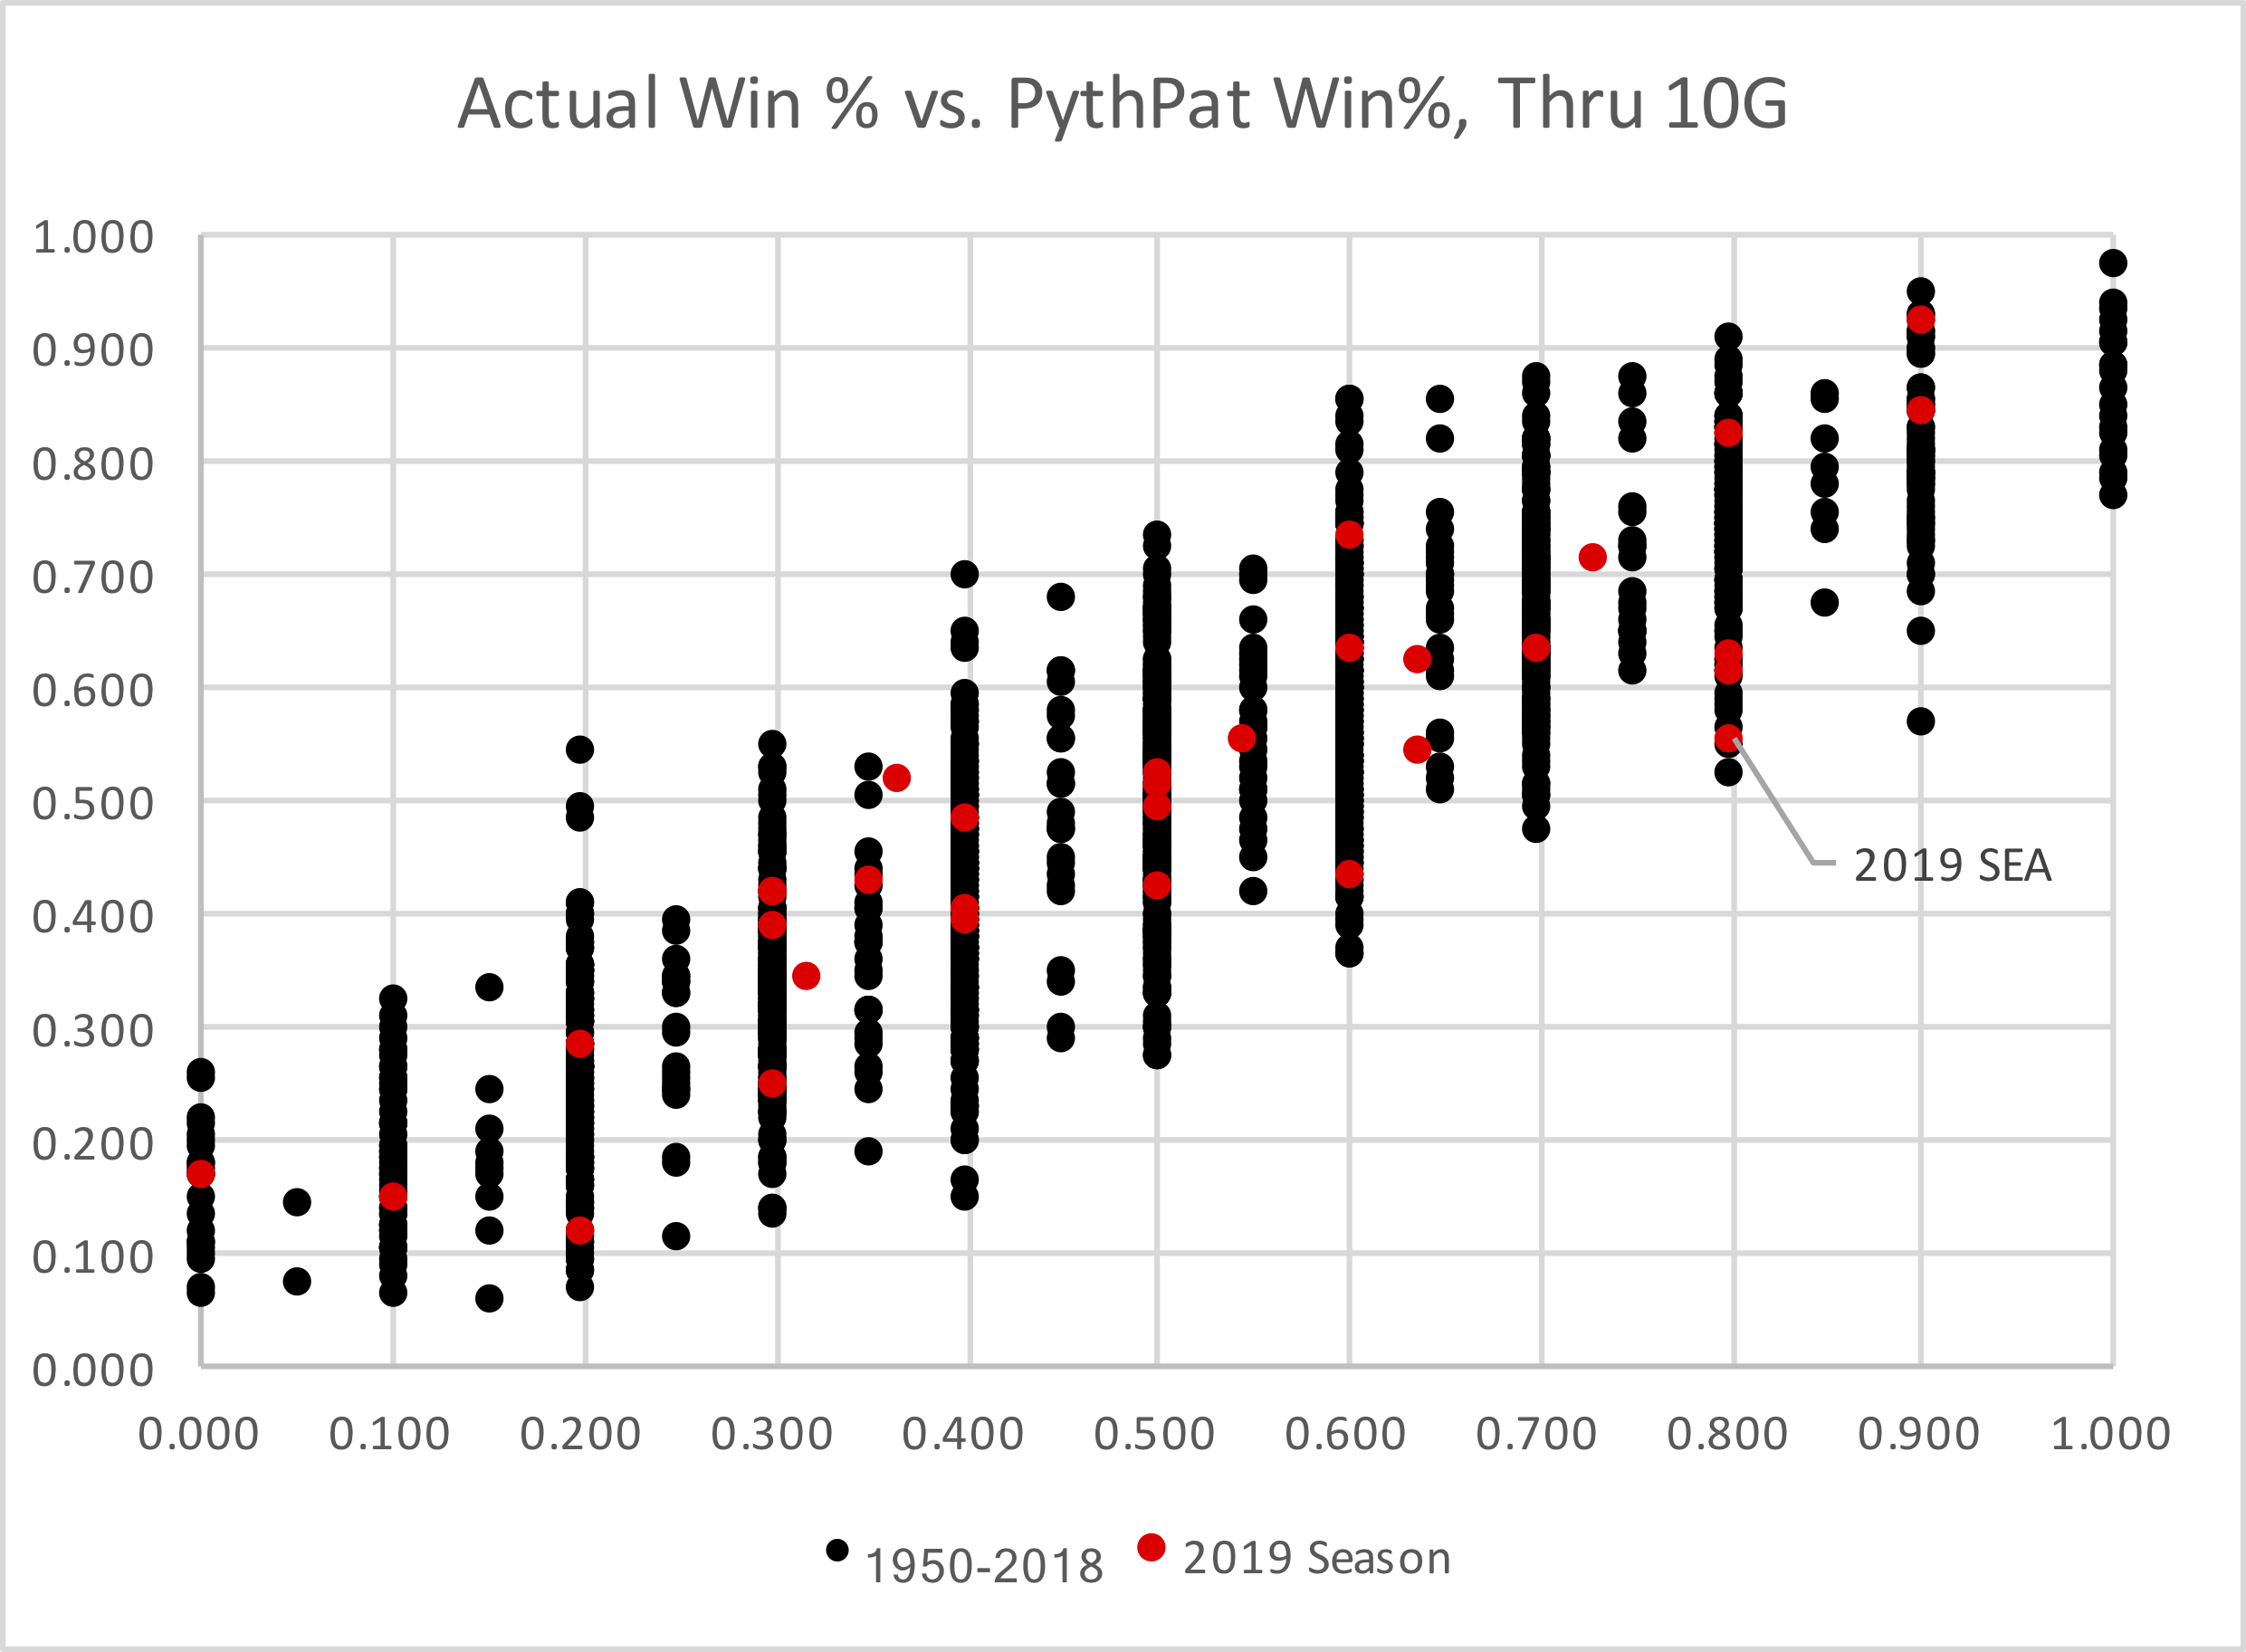
That gives a result of 0.554, which is Seattle’s expected winning percentage based on its points scored and points allowed. The graph below shows every team this season and their actual winning percentage on the X-Axis, and Pythagenpat winning percentage on the Y-Axis.

Seattle is the biggest outlier here, and by a good margin. The Seahawks have a winning percentage that is 0.246 higher than their Pythagenpat winning percentage; only the Saints (+0.187), Packers (+0.173), and Raiders (+0.169) are at over 10%, and none of those teams are all that close to Seattle. On the other side, the Bucs (-0.116), Broncos (-0.117), Chargers (-0.154), Cowboys (-0.128), and Bengals (-0.166) have underperformed by a large margin.
I performed the same analysis for every team from 1950 to 2018 through 10 games, and included the 2019 teams in red as well.
So how much of an outlier is Seattle? The Seahawks are the 6th-biggest outlier through 10 games since 1950.
| Team | Year | PF | PA | Win % | EXP | Pyth Pag | Diff |
|---|---|---|---|---|---|---|---|
| OAK | 1976 | 216 | 194 | 0.900 | 2.54 | 0.568 | 0.332 |
| SDG | 1987 | 195 | 189 | 0.800 | 2.50 | 0.520 | 0.280 |
| ATL | 2004 | 208 | 194 | 0.800 | 2.53 | 0.544 | 0.256 |
| IND | 2006 | 263 | 210 | 0.900 | 2.63 | 0.644 | 0.256 |
| NOR | 1973 | 114 | 234 | 0.400 | 2.44 | 0.148 | 0.252 |
| SEA | 2019 | 275 | 254 | 0.800 | 2.71 | 0.554 | 0.246 |
| CAR | 2003 | 198 | 180 | 0.800 | 2.49 | 0.559 | 0.241 |
| PIT | 1962 | 226 | 280 | 0.600 | 2.68 | 0.360 | 0.240 |
| PIT | 1989 | 123 | 240 | 0.400 | 2.46 | 0.162 | 0.238 |
| IND | 2012 | 210 | 260 | 0.600 | 2.63 | 0.363 | 0.237 |
| CAR | 2015 | 299 | 191 | 1.000 | 2.66 | 0.767 | 0.233 |
| JAX | 2010 | 220 | 270 | 0.600 | 2.66 | 0.367 | 0.233 |
| NYJ | 2013 | 183 | 268 | 0.500 | 2.60 | 0.270 | 0.230 |
| DEN | 1992 | 175 | 183 | 0.700 | 2.45 | 0.473 | 0.227 |
| SFO | 2006 | 182 | 265 | 0.500 | 2.60 | 0.274 | 0.226 |
| OAK | 2016 | 272 | 243 | 0.800 | 2.69 | 0.575 | 0.225 |
| TEN | 1999 | 206 | 181 | 0.800 | 2.50 | 0.580 | 0.220 |
| ARI | 2014 | 237 | 176 | 0.900 | 2.54 | 0.681 | 0.219 |
| RAM | 1969 | 276 | 169 | 1.000 | 2.59 | 0.781 | 0.219 |
| MIN | 2000 | 248 | 218 | 0.800 | 2.62 | 0.584 | 0.216 |
| BUF | 2007 | 153 | 222 | 0.500 | 2.48 | 0.284 | 0.216 |
| WAS | 2001 | 141 | 206 | 0.500 | 2.44 | 0.284 | 0.216 |
| SFO | 1990 | 253 | 151 | 1.000 | 2.53 | 0.787 | 0.213 |
| CHI | 1962 | 207 | 247 | 0.600 | 2.61 | 0.387 | 0.213 |
| DEN | 1979 | 147 | 149 | 0.700 | 2.34 | 0.492 | 0.208 |
| CHI | 1991 | 181 | 155 | 0.800 | 2.42 | 0.593 | 0.207 |
| HOU | 2016 | 181 | 215 | 0.600 | 2.52 | 0.393 | 0.207 |
| NYG | 1965 | 174 | 245 | 0.500 | 2.55 | 0.294 | 0.206 |
| MIN | 2005 | 174 | 245 | 0.500 | 2.55 | 0.294 | 0.206 |
| JAX | 2009 | 199 | 235 | 0.600 | 2.58 | 0.395 | 0.205 |
| PHI | 1960 | 262 | 191 | 0.900 | 2.60 | 0.695 | 0.205 |
| KAN | 2011 | 144 | 252 | 0.400 | 2.52 | 0.196 | 0.204 |
| RAI | 1982 | 287 | 210 | 0.900 | 2.67 | 0.697 | 0.203 |
| BAL | 1978 | 141 | 247 | 0.400 | 2.50 | 0.197 | 0.203 |
| NYT | 1961 | 207 | 286 | 0.500 | 2.66 | 0.297 | 0.203 |
| IND | 2009 | 269 | 157 | 1.000 | 2.56 | 0.799 | 0.201 |
| HOU | 1979 | 212 | 212 | 0.700 | 2.56 | 0.500 | 0.200 |
| DEN | 2007 | 187 | 258 | 0.500 | 2.59 | 0.303 | 0.197 |
| OAK | 1998 | 176 | 175 | 0.700 | 2.44 | 0.503 | 0.197 |
| STL | 1982 | 151 | 211 | 0.500 | 2.46 | 0.305 | 0.195 |
| GNB | 2011 | 355 | 212 | 1.000 | 2.76 | 0.805 | 0.195 |
| MIA | 2001 | 214 | 212 | 0.700 | 2.56 | 0.506 | 0.194 |
| ATL | 2012 | 270 | 193 | 0.900 | 2.62 | 0.707 | 0.193 |
| MIN | 1997 | 238 | 201 | 0.800 | 2.58 | 0.607 | 0.193 |
| WAS | 1951 | 153 | 259 | 0.400 | 2.54 | 0.208 | 0.192 |
| PHI | 1952 | 193 | 223 | 0.600 | 2.55 | 0.409 | 0.191 |
| TAM | 2010 | 209 | 206 | 0.700 | 2.55 | 0.509 | 0.191 |
| CLE | 1965 | 263 | 222 | 0.800 | 2.65 | 0.610 | 0.190 |
| CIN | 1986 | 237 | 271 | 0.600 | 2.68 | 0.411 | 0.189 |
| BAL | 1983 | 183 | 211 | 0.600 | 2.51 | 0.411 | 0.189 |
As always, please leave your thoughts in the comments.