by Chase Stuart
on March 23, 2017
Last year, I looked at each team’s “average” draft value, with average being defined as the AV-weighted average of the team’s roster. And yesterday, I did the same thing for every Super Bowl champion. Today, we look at the draft value for each team in 2016.
One thing that’s interesting, if not surprising: there’s not a ton of turnover from year to year in this stat. The top five teams in this metric last year were also the top five teams this year, although the order switched around notably. The Falcons were fifth last season, but were first this year, and would have been in the top 10 among all Super Bowl champions had they won. That’s what happens when Matt Ryan (3rd overall), Julio Jones (6th), Alex Mack (21st), Jake Mathews (6th), and Vic Beasley (8th) were the team leaders in AV.
The table below shows all teams in 2016: [continue reading…]
{ }
by Chase Stuart
on March 22, 2017
The New England Patriots won Super Bowl LI, but it wasn’t because the team was packed full of high draft picks. Of the five Patriots who had more than 10 points of AV, only one was drafted in the first four rounds. Regular readers know that I created an AV-based draft value chart, which assigns points to each draft pick based on the expected marginal production produced by that pick.
Well, you can calculate a team’s weighted average draft value by doing the following:
- Calculate the draft value spent on each player on the roster who produced at least 1 point of AV that season.
- Calculate the percentage of team AV produced by each player. This is key, otherwise Chris Long would skew the results in the wrong direction.
- Multiply the results in steps 1 and 2, and then sum those values.
Here’s how it would work with the 2016 Patriots, who had an average draft value (as a roster, and weighted by AV) of 6.72.
[continue reading…]
{ }
by Chase Stuart
on March 21, 2017
Ben Roethlisberger takes a lot of sacks. Since entering the league in 2004, he has nearly 100 more sacks than any other quarterback. I thought it would be interesting to look at the leaders in sacks taken over rolling 5-year periods.
Over the last 5 years, the most sacked quarterback is Ryan Tannehill, who may be going down a Roethlisberger-like path. Tannehill has surprisingly only missed 3 games in his 5-year career, but I’d say the odds of him continuing to take sacks at a high rate and playing 16 game seasons is pretty low.
As for Roethlisberger, he had the most sacks taken from ’04 to ’08, ’05 to ’09, ’06 to ’10, ’07 to ’11, and ’09 to ’13; he was 2nd from ’08 to ’12, just four sacks behind Aaron Rodgers. That was the only thing stopping Ben from leading for a whopping 6 straight 5-year periods.
Here’s a list of the leader for every 5-year period beginning in 1969, which is as far back as PFR’s sack data goes: [continue reading…]
{ }
by Chase Stuart
on March 20, 2017
Today’s guest post comes from Damon Gulczynski, a longtime reader, Seattle sports fan, and part-time writer. He also wrote this book on baseball names. As always, we thank our guest posters for contributing.

White runs for a score against the Falcons
was fantastic in Super Bowl LI, setting records in receptions (14) and total points (20), but he did not win the MVP Award. Instead the voters bestowed that honor on a player who reduced his team’s chances of winning by nearly 15% on a single play (
Robert Alford’s pick-six). That, of course, is a misleading statement —
Tom Brady went on to finish the game with over 450 passing yards in leading his team to the greatest comeback in Super Bowl history — but it is completely accurate to say James White was fantastic. It would not have been unreasonable in the least to pick him over Brady for game MVP. Super Bowl LI was a case where it would have been more representative of the story of the game to give out two MVP awards — or better yet to have a “three stars” of the game system, like hockey, so that
Trey Flowers (2.5 sacks) could have been recognized along with Brady and White.
With this in mind, for fun, I decided to go through each of the 51 Super Bowls and retroactively select the three stars of the game. In making these selections I relied on box scores, play-by-play logs, news articles, and video clips from past Super Bowls. My full list is given below. The actual Super Bowl MVPs are denoted with a + sign after their name; players on the losing team are denoted with a ~ after their name. In 30 of the 51 cases the MVP was my first star of the game, which means I think the voters “got it wrong” 21 times. And in six cases I think they really got it wrong, as the player they chose for MVP did not even qualify as my third star of the game. [continue reading…]
Tagged as:
Guest Posts,
Super Bowl
{ }
by Chase Stuart
on March 19, 2017
The Jets threw 25 interceptions last year, which was bad because no other team threw more than 21. Also not good: the Jets defense forced just 8 interceptions last year, tied for second-fewest in the league behind the Jaguars (7).
That means New York was at -17 net interceptions last year, which is bad. But the Jets have generally been pretty bad in this category over the last decade, with -59 net interceptions from ’07 to ’16. Take a look at the yearly totals, with interceptions throwing by Jets passers in white, and interceptions forced by the Jets defense in green. [continue reading…]
Tagged as:
Jets
{ }
by Chase Stuart
on March 18, 2017
Two days ago, I looked at the median age of defensive players based on interceptions. And yesterday, I looked at the median age of players based on sack totals.
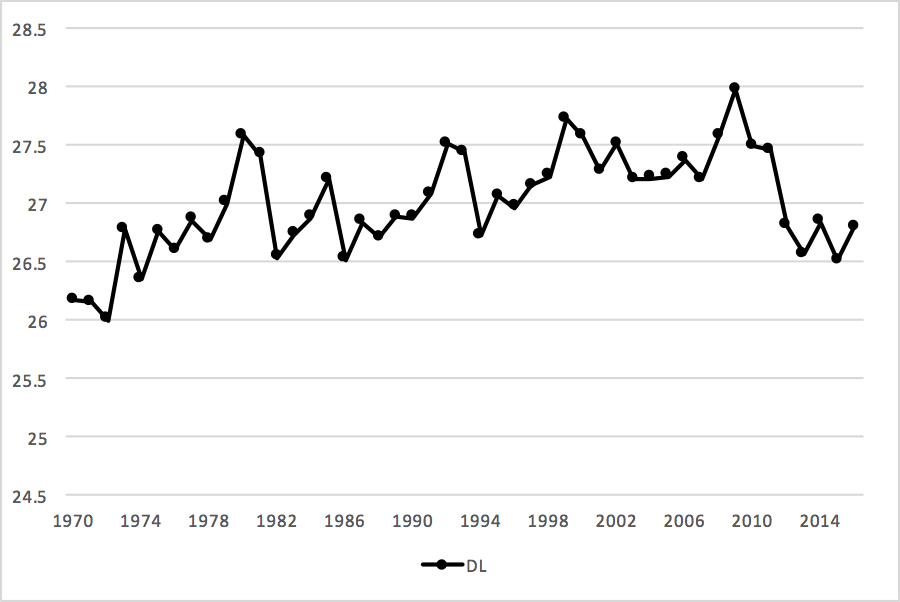
Today, we will do the same thing but by position, using AV as our tool of measurement.
First, let’s start with defensive linemen. On average, from 1970 to 2016, 50% of all AV came from players 27.0 years of age or younger as of September 1st of the season in question. That number rose to as high as 27.6 in 1999, dropped to just 26.1 in 2013, and has been around 26.5 over the last three seasons.
 [continue reading…]
{ }
by Chase Stuart
on March 17, 2017
Yesterday, I looked at the median age of interceptions by defensive players. Today, using the same methodology, I will be looking at sacks by defensive players.
Since 1982, the median sack age has been rising, although it did drop from the high levels we saw 5-10 years ago. Take a look:

[continue reading…]
{ }
by Chase Stuart
on March 16, 2017
Good instagram post by Tony Khan yesterday: Since 2001, there have been more interceptions made by defensive players aged 26 than by players of any other age.
That was true for this past season, too, where 70 of the interceptions came from players that were 26 years old in 2016. Perhaps more interesting: the median age for interceptions, by defenders, was 26 years. What do I mean by that?
Well, 2% of all interceptions in 2016 came from players 21 years of younger; 7% came from players 22 or younger, 14% from 23 years or younger, 28% from 24 or younger, 39% from age 25 or younger, and 56% from age 26 or younger. So if you sort all interceptions by the (ascending) age of the defender, you need to go up to age 26 to cross the 50% mark.
I looked at the September 1st age of every player who recorded an interception in each year from 1940 to 2015 (I haven’t updated by database for 2016 just yet). The graph below charts the median 9/1 age in each season (i.e., what is the youngest 9/1 age you need to use to make sure you capture at least 50% of all interceptions from player that age and younger): [continue reading…]
Tagged as:
Interceptions
{ }
by Chase Stuart
on March 15, 2017
Brad Oremland is a longtime commenter and a fellow football historian. Brad is also a senior NFL writer at Sports Central. There are few who have given as much thought to the history of quarterbacks and quarterback ranking systems as Brad has over the years. What follows is Brad’s latest work on quarterback statistical production.
Author’s Note: This is a very long post, but I discourage you from skimming it. Wait to read it until you can go over it without feeling distracted.
Two years ago, I wrote an exhaustive series on the greatest quarterbacks of all time. That was a subjective ranking, but I also discussed the formula for Quarterback Total Statistical Production, QB-TSP. This post concerns that stat, QB-TSP, so you may want to read that link if you haven’t already.
I’ve made three minor adjustments to the formula since that writing: [continue reading…]
Tagged as:
Brad Oremland,
Guest Posts
{ }
by Chase Stuart
on March 14, 2017
Dez Bryant had a “down” year by most standards last season. He ranked 51st with just 796 receiving yards, and only moves up to 33rd in receiving yards per game (the Cowboys star missed three full games). But Dallas ranked 31st in team pass attempts last season, which significantly impacted Bryant’s ability to produce strong receiving numbers.
In terms of pro-rated Adjusted Catch Yards per Team Pass Attempt, Bryant ranked 9th (he ranked 11th in pro-rated receiving yards per Team Pass Attempt). What do I mean by that? Well, Adjusted Catch Yards are simply receiving yards with a 5-yard bonus for receptions and a 20-yard bonus for receiving touchdowns. Team pass attempts are just passes plus sacks for each team (the Cowboys had 511; the Dolphins were last with 507). And pro-rated? That multiplies the number of team pass attempts by a player’s number of games played, divided by 16.
Here were the leaders in this metric last season. You won’t be too surprised to learn that the leaders were Julio Jones, A.J. Green, and Antonio Brown, arguably the three best receivers in the NFL in 2016. [continue reading…]
Tagged as:
ACY/TmAtt
{ }
by Chase Stuart
on March 13, 2017
On the surface, Kenny Britt didn’t have a remarkable season. He had just 1,002 yards, to go along with 68 receptions and 5 touchdowns. But then again, every receiver is playing in a different environment, and Britt’s environment was very, very bad.
The three teams with the worst passing stats in 2016 — from a cumulative perspective — were Buffalo, San Francisco, and Los Angeles. The Bills had a below-average passing offense but rank at the bottom because the team threw the fewest passes in the league, which makes is tough for a receiver to produce good stats. The 49ers were in the bottom 10 in ANY/A and were one of just four teams that didn’t hit the 500-attempt mark. And the Rams were — by a large margin — the worst passing team in the NFL from an efficiency standpoint, thanks in part to Jared Goff having one of the worst rookie seasons ever.

Green grabbing a bunch of ACY
Britt had 1,422 Adjusted Catch Yards — calculated by giving 5 yards for every reception and 20 yards for every touchdown — which ranked just 26th last season. But the Rams offense as a whole had just 5,153 total ACY, so Britt had 28.0% of all Los Angeles Adjusted Catch Yards. And Britt missed one game: on a pro-rated basis, he had 29.8% of all Rams ACY, calculated as 1422 * (Games Played * 5153/16).
That’s good enough for 5th best in the NFL last year. The leader by this metric was A.J. Green of the Bengals, who took over as options 1, 2, 3, and 4 in the Cincinnati passing attack with Mohamed Sanu gone, and Tyler Eifert limited to just eight games. Green had 1,374 ACY in 10 games, but more impressively, he had 34.4% of the Bengals team ACY on a pro-rated basis. [continue reading…]
Tagged as:
WR Ranking Systems
{ }
by Chase Stuart
on March 12, 2017
Regular readers know all about the Football Perspective Draft Value Chart, which is derived from the approximate value actually produced by draft picks at each draft slot. Over the next week, I will be showing how much draft capital has been used to select players at certain positions in every draft since 1990. This will allow us to see how much the league’s view on the value of a position has changed, while also giving us a visual insight into the volatility among the talent in draft classes is from year-to-year.
I will be staying out of the commentary for now, so I encourage you to post your thoughts. To make comparison across positions easier, I will be using the same scale for each position. Let’s look at the graph for defensive backs: [continue reading…]
Tagged as:
Draft Value Chart
{ }
by Chase Stuart
on March 11, 2017
Regular readers know all about the Football Perspective Draft Value Chart, which is derived from the approximate value actually produced by draft picks at each draft slot. Over the next week, I will be showing how much draft capital has been used to select players at certain positions in every draft since 1990. This will allow us to see how much the league’s view on the value of a position has changed, while also giving us a visual insight into the volatility among the talent in draft classes is from year-to-year.
I will be staying out of the commentary for now, so I encourage you to post your thoughts. To make comparison across positions easier, I will be using the same scale for each position. Let’s look at the graph for linebackers: [continue reading…]
Tagged as:
Draft Value Chart
{ }
by Chase Stuart
on March 10, 2017
Regular readers know all about the Football Perspective Draft Value Chart, which is derived from the approximate value actually produced by draft picks at each draft slot. Over the next week, I will be showing how much draft capital has been used to select players at certain positions in every draft since 1990. This will allow us to see how much the league’s view on the value of a position has changed, while also giving us a visual insight into the volatility among the talent in draft classes is from year-to-year.
I will be staying out of the commentary for now, so I encourage you to post your thoughts. To make comparison across positions easier, I will be using the same scale for each position. Let’s look at the graph for defensive linemen: [continue reading…]
Tagged as:
Draft Value Chart
{ }
by Chase Stuart
on March 9, 2017
Regular readers know all about the Football Perspective Draft Value Chart, which is derived from the approximate value actually produced by draft picks at each draft slot. Over the next week, I will be showing how much draft capital has been used to select players at certain positions in every draft since 1990. This will allow us to see how much the league’s view on the value of a position has changed, while also giving us a visual insight into the volatility among the talent in draft classes is from year-to-year.
I will be staying out of the commentary for now, so I encourage you to post your thoughts. To make comparison across positions easier, I will be using the same scale for each position. Let’s look at the graph for offensive linemen: [continue reading…]
Tagged as:
Draft Value Chart
{ }
by Chase Stuart
on March 8, 2017
Regular readers know all about the Football Perspective Draft Value Chart, which is derived from the approximate value actually produced by draft picks at each draft slot. Over the next week, I will be showing how much draft capital has been used to select players at certain positions in every draft since 1990. This will allow us to see how much the league’s view on the value of a position has changed, while also giving us a visual insight into the volatility among the talent in draft classes is from year-to-year.
I will be staying out of the commentary for now, so I encourage you to post your thoughts. To make comparison across positions easier, I will be using the same scale for each position. Let’s look at the graph for tight ends: [continue reading…]
Tagged as:
Draft Value Chart
{ }
by Chase Stuart
on March 7, 2017
Regular readers know all about the Football Perspective Draft Value Chart, which is derived from the approximate value actually produced by draft picks at each draft slot. Over the next week, I will be showing how much draft capital has been used to select players at certain positions in every draft since 1990. This will allow us to see how much the league’s view on the value of a position has changed, while also giving us a visual insight into the volatility among the talent in draft classes is from year-to-year.
I will be staying out of the commentary for now, so I encourage you to post your thoughts. To make comparison across positions easier, I will be using the same scale for each position. Let’s look at the graph for wide receivers: [continue reading…]
Tagged as:
Draft Value Chart
{ }
by Chase Stuart
on March 6, 2017
Regular readers know all about the Football Perspective Draft Value Chart, which is derived from the approximate value actually produced by draft picks at each draft slot. Over the next week, I will be showing how much draft capital has been used to select players at certain positions in every draft since 1990. This will allow us to see how much the league’s view on the value of a position has changed, while also giving us a visual insight into the volatility among the talent in draft classes is from year-to-year.
I will be staying out of the commentary for now, so I encourage you to post your thoughts. To make comparison across positions easier, I will be using the same scale for each position. Let’s look at the graph for running backs: [continue reading…]
Tagged as:
Draft Value Chart
{ }
by Chase Stuart
on March 5, 2017
Regular readers know all about the Football Perspective Draft Value Chart, which is derived from the approximate value actually produced by draft picks at each draft slot. Over the next week, I will be showing how much draft capital has been used to select players at certain positions in every draft since 1990. This will allow us to see how much the league’s view on the value of a position has changed, while also giving us a visual insight into the volatility among the talent in draft classes is from year-to-year.
I will be staying out of the commentary for now, so I encourage you to post your thoughts. To make comparison across positions easier, I will be using the same scale for each position. Let’s start with the graph for quarterbacks: [continue reading…]
Tagged as:
Draft Value Chart
{ }
by Chase Stuart
on March 4, 2017
Just like yesterday, I’m very short on time, so Bryan Frye agreed to help keep the streak alive here by asking me to reproduce his work on the career rushing touchdown kings. What follows is a reproduction of his work here. As always, thanks so much to Bryan for contributing.
***************************
As a lover of football history, I enjoy writing about the evolution of the game and examining statistical achievements from a historical perspective. I’m also fond of looking at the progression of career records, as doing so can often give us a glimpse into the progression of the game itself. I’ve previously written about the history of the passing touchdowns, passing yards, and receptions records. Today, I’ll focus on the storied history of the carer rushing touchdowns record.
The first ever Football Sunday in league history occurred on September 26, 1920. Rock Island Independents back Eddie Novak scored the first touchdown on a ten yard rush, but that was in the day before official stats. We have to move twelve years from that point till we find a full season with officially recorded stats. Note that, while the NFL does not recognize as official most records prior to 1932, it does recognize touchdowns; whether or not the league is correct in doing so is beyond the scope of this article. My aim is to begin in 1932, but to use the numbers the league recognizes for its first rushing touchdown king, Ernie Nevers. Without further ado…
Running Backs to Hold the Career Rushing Touchdowns Record
Ernie Nevers (16 years, 1 month as official record-holder) [continue reading…]
Tagged as:
Bryan Frye
{ }
by Chase Stuart
on March 3, 2017
I’m very short on time, so Bryan Frye agreed to help keep the streak alive here by asking me to reproduce his All-Time 53 Man NFL Roster. What follows is a reproduction of his work here on his all-time 53 man roster. Given that I am short on time, maybe you are long on time (is that how time works?), in which case — get ready for a great read.
******************
Sometimes when I am bored, I make football lists or rosters in my head (what is the all-time Steelers team, what is the current all-NFC South team, what is the all-time Hispanic team, etc.). Of all the whimsical thought experiments in which I have engaged, the one with the most decisions and revisions has been my all time 53 man NFL roster (with coaching staff).
The purpose of building an all time 53 man NFL roster is not to simply pluck the best 53 players out of history. If I did that, I’d end up with an unbalanced roster, with as many as seven quarterbacks. Having seven Hall of Fame passers would be nice, but it’s completely unnecessary. The important thing to me is depth, which means I value versatility from the players on the roster. Yes, Jan Stenerud was a great kicker, but why put him on the team when I can have Gino Cappelletti kick, return kickoffs and punts, take handoffs, and catch passes? You get the idea. I will make exceptions for most starters, but I want most of my backups to contribute in more than one area.
Having read the comments sections in some popular sports sites, I feel that it is necessary to make the following disclaimer: Players will be picked, in large part, based on how they performed in their respective eras. Danny Fortmann was one of the great interior offensive linemen of his generation, but it would be insane to posit that he could be plucked out of 1941 and be a star guard today at 6’0” and 210 pounds. That’s smaller than RG3. [continue reading…]
Tagged as:
Bryan Frye,
Guest Posts
{ }
by Chase Stuart
on March 2, 2017
With the Vikings and Chiefs moving on from Adrian Peterson and Jamaal Charles, respectively, it’s a reminder that even the best running backs rarely finish their careers with one team.
Currently, there are 31 running backs in NFL history who have at least 7,000 rushing yards and have rushed for at least 70 yards per game. Among that group, Peterson and Charles are two of just six players to spend their entire careers with one team — and that is likely going to change. Can you guess the first 4? Take a second.
Those thresholds aren’t insanely high. To put some scope on those thresholds, drop them to 6500/65 and you bring in Robert Smith of the Vikings, and a pair of Giants in Tiki Barber and Rodney Hampton.
Who are those four? They are all Hall of Famers: Barry Sanders, Jim Brown, Walter Payton, and… Terrell Davis.
For comparison’s sake, there are 30 wide receivers who have at least 6,000 receiving yards and a career average of at least 60 receiving yards per game. Even excluding the six receivers who are still active, Don Hutson, Charley Hennigan, Steve Largent, Sterling Sharpe, Michael Irvin, Marvin Harrison, Reggie Wayne, Marques Colston, and Calvin Johnson all retired and played for just one team; they represent nearly half — 9 of 19 — of the retired players in the 6000/60 club.
I don’t have much to add to that, other than I find it kind of interesting.
{ }
by Chase Stuart
on March 1, 2017
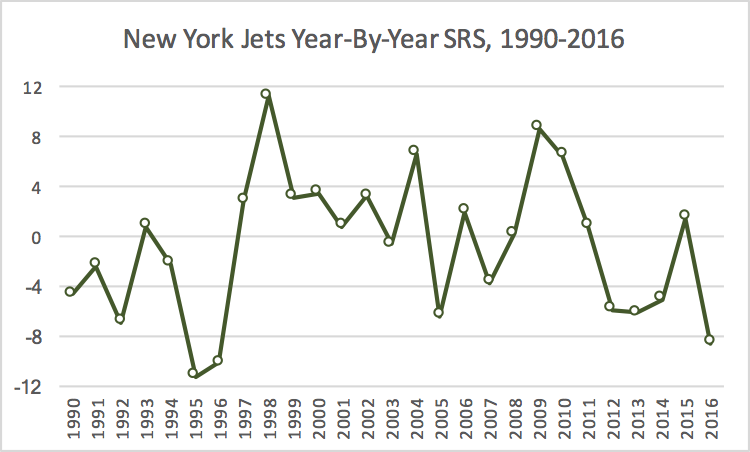
The Jets have not exactly been a powerhouse franchise in NFL history, and that’s true in recent years, too. But the Jets were legitimate Super Bowl contenders in 2009 and 2010, making the AFC Championship Game both years. Take a look at the Jets yearly SRS grades from 1990 to 2016, and ’09 and ’10 stand out as the last great Jets teams:
 [continue reading…]
Tagged as:
Jets
{ }
by Chase Stuart
on February 28, 2017
I’ll be speaking at one of the panels at this year’s Sloan Sports Analytics Conference. The panel is titled “Football Analytics: Please Stop Punting” and I’ll be joining Mike Lombardi, John Urschel, and Sandy Weil in a general discussion about football analytics and ways to improve the game. I suspect that I am up to the task, but to the extent I am not, moderator Bill Barnwell should keep me in line.
If you’re attending, give me a shout.
{ }
by Chase Stuart
on February 27, 2017
It’s not easy to gain recognition as an offensive lineman. It’s even harder to do so as a center. And it’s almost impossible to do it as a center on a bad offense.
Travis Frederick of the Cowboys was the first-team All-Pro center in 2016, based on voting from the AP, PFW, and PFF. Alex Mack of the Falcons was the 2nd-team choice from the APP and PFF. Dallas and Atlanta, of course, had two of the best three offenses in the NFL this year.
Since the merger, 31 of the 47 first-team All-Pro centers (based on the AP team) played for teams that ranked in the top 10 in passing efficiency, as measured by Adjusted Net Yards per Attempt. Just five of the 47 selections played for offenses that ranked 20th or worse in ANY/A, and all five played for the Jets or Steelers: Mike Webster (1983, Pittsburgh, 26th), Dermontti Dawson (1998, Pittsburgh, 28th), Kevin Mawae (1999, Jets, 20th), Mangold (2009, Jets, 27th), and Mangold again (2010, Jets, 20th). Here’s where the AP 1AP center’s team ranked in ANY/A each year: [continue reading…]
{ }
by Chase Stuart
on February 26, 2017
For his career, Jay Cutler is 68-71, which would put him just a hair below .500. He’s also 1-1 in the playoffs.
For his career, Jay Cutler has averaged 5.88 Adjusted Net Yards per Attempt, while the league average over that span has been 5.85 ANY/A, putting him just a hair above average.
Cutler wasn’t drafted to be league average, and he’s been a polarizing player for much of his career. He hasn’t quite fulfilled the high potential he had as a prospect, but he’s also been a bit better than the critics suggest, too. He’s not great, he’s not bad, he’s… average.
One thing that’s kind of interesting: his record hasn’t really correlated with his passing efficiency numbers. The correlation coefficient between his Relative ANY/A — that is, his ANY/A minus league average — and his winning percentage is just 0.21. [continue reading…]
Tagged as:
Jay Cutler
{ }
by Chase Stuart
on February 25, 2017
In 2014, Dallas, behind Tony Romo, went 12-4 (and 12-3 in Romo starts).
In 2015, with Matt Cassel, Brandon Weeden, and Kellen Moore, the Cowboys went 4-12 (and 3-1 in Romo games).
In 2016, Dallas, with Dak Prescott at quarterback, went 13-3.
So Dallas saw the team’s win total drop by 8 games from ’14 to ’15, and then bounce back up by 9 more games. That’s an average change of 8.5 wins, even more extreme than the Panthers change (in the other direction) we discussed yesterday.
Of course, given the quarterback changes in Dallas, it’s not super surprising to see that big swings in wins totals. The Cowboys are the 3rd team to have an average win swing of 8.5 wins over a 3-year period, with the middle year being really bad. The first two also happened pretty recently:
- In 2012, the Texans (with Matt Schaub) went 12-4; in ’13, Schaub’s performance fell through the floor, and Houston went 2-14 (-10). The next year, with Ryan Fitzpatrick, Houston went 9-7 (+7).
[continue reading…]
{ }
by Chase Stuart
on February 24, 2017
The 1999 Rams weren’t a fluke. They were a shocking team that went from terrible to excellent overnight, but their success in 2000 and 2001 proved that the team wasn’t a fluke.
The 2015 Panthers? That may be a different story. In 2014, Carolina went 7-8-1, before winning 7.5 more games (counting a tie as half a win) in 2015 as part of a magical 15-1 season. Last year, Carolina’s win total dropped by 9 games to 6-10. That means the Panthers 2015 season was, on average, 8.25 wins better than how the team performed in the two surrounding years.
How does that stack up among all teams since the merger? Well, it’s the second biggest outlier since 1970. Can you guess the first? [continue reading…]
{ }
by Chase Stuart
on February 23, 2017
Welcome to the offseason. It was another long year, but a good one, here at Football Perspective.
There should be some exciting news to announce in the coming weeks, and that may keep the posts here short. This would be a great time for guest submissions, so if you would like something posted here, don’t hesitate to send. Otherwise, what sort of content are you hoping to see this offseason? Now is the time for all the crazy ideas and topics on your mind, so let ’em rip.
Chase
{ }
by Chase Stuart
on February 22, 2017
The Patriots leader in passer rating in 2016, and Tom Brady
If you were an NFL team in need of a quarterback, you would certainly be interested in trading for Patriots backup
Jimmy Garoppolo. The big question, of course, is what is he worth?
Garoppolo was the 62nd overall pick in the 2014 Draft. If he never took a snap between now and then, his market value would presumably have dropped. He, like all second round picks, signed a four-year deal, with cap hits of $633,436 in 2014, $791,795 in 2015, $950,154 in 2016, and $1,108,513 in 2017. If Garoppolo turns into even a serviceable NFL quarterback, his salary cap hit will go up astronomically, and his next contract could be somewhere in the range of $15M to $20M per year against the cap. An enormous part of the value of a draft pick is the four cost-controlled seasons; with Garoppolo, three of those are already toast. So while you could argue that a quarterback who sat for three years would likely be a better player in year 4 than a rookie quarterback, Garoppolo’s market value would still drop — significantly, I think — by virtue of having him on a cheap one-year deal versus having a rookie on a cheap four-year deal.
But, as we know, Garoppolo has played since being drafted. And while he didn’t do much his first two seasons, throwing for 188 yards on 31 passes, Garoppolo averaged 8.59 ANY/A on 66 dropbacks last season. Anecdotally, too, it seems as though the league views him as a strong prospect, giving him a higher grade than they did three years ago when he slipped to the end of round two. [continue reading…]
{ }
