≡ Menu

The Time Value of Draft Picks

How do you compare the value of a draft pick this year compared to a draft pick next year? NFL teams have often used a “one round a year” formula, meaning a team would trade a 2nd, 3rd, or 4th round pick this year for a 1st, 2nd, or 3rd rounder next year. But to my knowledge, such analysis hasn’t evolved into anything more sophisticated than that.

So I decided to come up with a way to measure the time value of draft picks. First, I calculated how much Approximate Value each draft pick provided from 1970 to 2007 during their rookie season. Then, to calculate each player’s marginal AV, I only awarded each player credit for his AV over two points in each year. As it turns out, the player selected first will provide, on average, about 4 points of marginal AV during his rookie year. During his second season, his marginal value shoots up to about 5.5 points of AV, and he provides close to 6 points of marginal AV during his third and fourth seasons. In year five, the decline phase begins, and the first pick provides about 4.7 points of AV. You can read some more fine print here. [1]The charts in this post are “smoothed” charts using polynomial trend lines of the actual data. I have only given draft picks credit for the AV they produced for the teams that drafted … Continue reading

Here’s another way to think of it. The 1st pick provides 4.0 points of marginal AV as a rookie, the same amount the 15th pick provides during his second year, the 17th pick produces during his third year, the 16th pick during his fourth year, and the 8th pick during his fifth year. So the 15th pick this year should provide, on average, about the same value next year as the 1st pick in the 2014 draft (of course, that player might have something to say about that, too).

The graph below shows the marginal AV (on the Y-axis) provided by each draft selection (on the X-axis) in each of their first five years. The graphs get increasingly lighter in color, from black (as rookies) to purple, red, pink, and gray (in year five):
[continue reading…]

References

References
1 The charts in this post are “smoothed” charts using polynomial trend lines of the actual data. I have only given draft picks credit for the AV they produced for the teams that drafted them – that’s why the values are flatter (i.e., top picks are less valuable) than they were in this post. Finally, astute readers will note that the draft looks linear in the second half; that’s because if I kept a polynomial trend line all the way through pick 224, some later picks would have more value than some early picks
{ 5 comments }

[Special thanks goes out to my Footballguys.com co-writer Maurile Tremblay for his help in co-authoring this piece with me. Any points with which you may disagree are almost certainly due to my error, and not Maurile’s.]

The new NFL collective bargaining agreement that ended the 2011 lockout instituted some pretty big changes to the salary cap. When it comes to roster management, here are three ways the post-2011 NFL differs from how things were under the old CBA:

  • Rookies are now super cheap relative to their production, especially high first-round players (relative to their old cost)
  • Rookie contracts can not be renegotiated until three years after the player is drafted.
  • Over a four-year period, each team must spend 89% of the cap dollars available to them, and the league must spend 99% of the cap dollars available to the 32 teams.

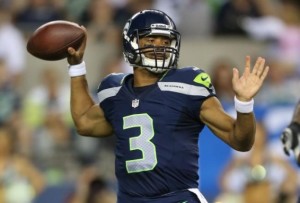
Under the old system, contrary to popular belief, most (if not all) rookies were underpaid relative to their free market value. Then in 2011, the owners and NFLPA decided to rob the rookies to pay veterans even more money under the new CBA. Russell Wilson has three years remaining on his contract and will have an average cap figure of just $817,000 over those three years. Andrew Luck and Robert Griffin III will only cost their teams about 6 million cap dollars each per year from 2013 to 2015. The salary cap in the NFL in 2013 is $123M, making Luck and Griffin fantastic values, and Wilson perhaps the most valuable player in the league.

Wilson's paid in direct proportion to his height

Wilson's paid in direct proportion to his height.

What makes this especially juicy from the perspective of their general managers is that all three players are locked into their deals until 2015. Luck and Griffin actually are struck through 2016, as teams get club-options for a fifth year for the top picks. In Wilson’s case, after the 2014 season, he’ll be facing a contract that would pay him less than a million dollars in 2015 and then a possible franchise tag in 2016, meaning a maximum payout of probably 20 million dollars over two years (the tag in 2012 for quarterbacks was just under $15 million). That puts Wilson in a pretty poor position to bargain for a market deal: he’s going to sacrifice money in exchange for security. This means Seattle will get him for absurdly below-market rates in 2012, 2013, and 2014, and then will still have him on a very generous contract for the next few years after that.

In the case of Luck or Griffin, the Colts and Redskins essentially get a chance to use the tag twice; teams can turn the four-year rookie deals into a five-year deal by paying top-ten picks the average salary of the ten highest-paid players at their position; then the next year the franchise tag would be the average of the top five quarterbacks or a 20% increase on the salary from the previous year. So when they are up for renegotiation after year three, they’re looking at the team “forcing” them to stay for three years at roughly $42 million, with year one bringing just over three million. Luck and Griffin will have a little more bargaining power than Wilson, but not much. There’s no chance either player is going to play for $3 million in 2015 (remember, their cap hit will be a bit higher, but their base salaries will be around $3M in that season), so both will likely give up their freedom (which would be three years away, potentially) for security.
[continue reading…]

{ 26 comments }

Flaccoing?

Flaccoing?

In September, I started a post by asking you to make this assumption:

Assume that it is within a quarterback’s control as to whether or not he throws a completed pass on any given pass attempt. However, if he throws an incomplete pass, then he has no control over whether or not that pass is intercepted.

If that assumption is true, that would mean all incomplete pass attempts could be labeled as “passes in play” for the defense to intercept. Therefore, a quarterback’s average number of “Picks On Passes In Play” (or POPIP) — that is, the number of interceptions per incomplete pass he throws — is out of his control.

After doing the legwork to test that assumption, I reached two conclusions. One, interception rate is just really random, and predicting it is a fool’s errand. Two, using a normalized INT rate — essentially replacing a quarterback’s number of interceptions per incomplete pass with the league average number of interceptions per incomplete pass — was a slightly better predictor of future INT rate than actual INT rate. It’s not a slam dunk, but there is some merit to using POPIP, because completion percentage, on average, is a better predictor of future INT rate than current INT rate.

So, why am I bringing this up today, at the start of Super Bowl week? Take a look at where Sunday’s starting quarterbacks ranked this year in POPIP (playoff statistics included, minimum 250 pass attempts):
[continue reading…]

{ 14 comments }

When you think about the Ravens under John Harbaugh — or just about any time in their existence — you think of a defensive team. Under Ray Lewis, Ed Reed, Terrell Suggs, and Haloti Ngata, Baltimore has fielded dominant defenses for much of the last decade. Marvin Lewis, Baltimore’s defensive coordinator from 1996 to 2001, was rewarded with the head coaching job in Cincinnati after his years of excellent service. He was replaced by Mike Nolan, who after coordinating the defense for three years in Baltimore, was tapped to revive the 49ers. His replacement, Rex Ryan, excelled for four years in Baltimore, and was then chosen by the Jets to be their next head coach. The Ravens replaced Ryan with Greg Mattison, who was lured by his friend Brady Hoke to take the DC job at Michigan in 2011. He was replaced by Chuck Pagano, who coordinated the Baltimore defense for only a year (after spending three as the defensive backs coach) before the Colts selected him to be their next head coach. Dean Pees is the current DC in Baltimore.

Suffice it to say, with so many prominent names roaming the sidelines and coordinating the defenses in Baltimore, there are few fingerprints from either John Harbaugh or his predecessor Brian Billick on the great Ravens defenses. When you look at Baltimore’s offense under Harbaugh, you immediately think of Cam Cameron, who excelled so much in his role as OC in San Diego that he was hired by the Miami Dolphins in 2007. Cameron’s Dolphins went 1-15 and he was fired after only one year, but Harbaugh chose Cameron to be his first offensive coordinator. Then, with three weeks remaining in the regular season, Harbaugh fired Cameron and promoted Jim Caldwell to OC.

That’s a long bit of background to say this: John Harbaugh isn’t in charge of the Baltimore offense or the Baltimore defense. At least when Brian Billick was around, you knew the offense would be crafted in his image, even if it wasn’t successful. But there’s a reason you don’t think of Harbaugh when you think of the specific offensive/defensive units in Baltimore: that’s because he made his name as a Special Teams coach [continue reading…]

{ 9 comments }

Regular readers surely recall my “What are the Odds of That” post from this summer. In that article, I referenced an obscured Jacoby Jones stat: in 2011, he gained three times as many receiving yards against teams at the back end of the alphabet as he did against the teams he faced in the front of the alphabet. Then I asked, “what are the odds of that?”

This is a very good reason why it’s often inappropriate to apply standard significance tests to football statistics. Surely Jones’ splits would pass any standard significance test, signaling that his wild split was in fact “real” even though we know it wasn’t. With a large enough sample, you would expect to have false positives, which isn’t a knock on standard significant testing. If something is statistically significant at the 1% level, that doesn’t mean you shouldn’t expect to see a false positive if you have 100 different samples…

Some in the statistical community refer to this as the Wyatt Earp Effect. You’ve undoubtedly heard of Wyatt Earp, who is famous precisely because he survived a large number of duels. What are the odds of that? Well, it depends on your perspective. The odds that one person would survive a large number of duels? Given enough time, it becomes a statistical certainty that someone would do just that. Think back to the famous Warren Buffett debate on the efficient market hypothesis. Suppose that 225 million Americans partake in a single elimination national coin-flipping contest, with one coin flip per day. After 20 days, we would expect 215 people to successfully call their coin flips 20 times out of 20. But that doesn’t mean those 215 people are any better at calling coins than you or I am. The Wyatt Earp Effect, the National Coin Flipping Example, and my Splits Happen post all illustrate the same principle. Asking “what are the odds of that?” is often meaningless in retrospect. If you look at enough things, enough players’ splits, enough 4th quarter comeback opportunities, enough coin flips, or enough roulette wheel spins, you will see some things that seem absurdly unlikely.

In December, I highlighted Matt Schaub’s struggles in night games compared to day games as yet another example. Well now, Ray Rice is the latest protagonist in What are the Odds of That? In case you missed it, Rice fumbled twice in Baltimore’s playoff win over Indianapolis, with the Colts recovering both times. Rice has struggled with fumbles in the playoffs in the past, but he’s always been outstanding during the regular season at holding on to the ball. In 2012, he lost just one fumble — which went harmlessly out of bounds — giving him a clean record for the season. So what’s going on? Here’s what Bill Barnwell wrote earlier this week:
[continue reading…]

{ 5 comments }

Seattle’s HFA

As usual, Aaron Schatz provided some interesting information in his weekly DVOA recap. He was looking into Seattle’s home/road splits, and found that the data support what you already know:

[W]hen you look closer at home-field advantage over a period of several years, almost every team generally has the same home-field advantage, which in DVOA works out to about 8.5% on offense and 8.5% on defense. Teams will see their home-field advantage bounce up and down if you only look at things in eight-game periods that coincide with specific seasons, but if you put together six or seven years of data you are going to end up close to 8.5% difference most of the time. The biggest exception seems to be the four NFC West teams, which over the last decade have enjoyed the four largest home-field advantages in the league. And of those four teams, the biggest exception by far is Seattle.

I don’t doubt that Seattle is a much better team at home than on the road. But here’s the question on my mind today: is Seattle much better at home because, well, they’re much better at home…. or because they simply get more favorable home games than the average team? That might sound like the same thing, but Jason Lisk has done a bunch of research on home field advantage as it relates to climate and distance between the teams.

The table below shows the distance each team has traveled this season. The “road” column represents how many miles the team has traveled when they were the road team while the “home” column shows how many miles their opponents had to travel. Note that I excluded the Patriots/Rams game in London, but instead pro-rated their half-seasons to eight games.

Teamroadhome
San Francisco 49ers2202423317
Oakland Raiders2317722505
Seattle Seahawks2305921130
San Diego Chargers2075520135
Arizona Cardinals1905819569
Miami Dolphins1798118038
New England Patriots1231117764
New York Jets1084617280
Carolina Panthers906714109
Denver Broncos1493313480
St. Louis Rams1298013248
Dallas Cowboys1482613057
Houston Texans1316812705
New Orleans Saints1153912592
average1255812562
Atlanta Falcons876312016
Minnesota Vikings886511633
Tampa Bay Buccaneers1376611493
Buffalo Bills1284511336
Kansas City Chiefs1198710982
Green Bay Packers801310776
Baltimore Ravens891610642
Cincinnati Bengals780110270
Jacksonville Jaguars126079948
Detroit Lions106158659
New York Giants98988416
Chicago Bears99067167
Tennessee Titans94817141
Indianapolis Colts66087090
Pittsburgh Steelers96426792
Cleveland Browns91986784
Washington Redskins72306022
Philadelphia Eagles99925878

Seattle is the most isolated team in the NFL. Now if an expansion team was place in Vancouver or Portland, my guess is that such a team would fare no worse against Seattle than the Giants do against the Eagles or the Jets against the Patriots. But right now, no one is all that close to the Seahawks:

NFL Map

There are also climate issues at play here. Think of the coldest NFL cities — Green Bay, Chicago, Pittsburgh, Cleveland, Buffalo, New England, Denver, Kansas City. They all play in divisions with other cold-weather teams. Meanwhile, the Seahawks are playing teams from California, Arizona, or Missouri in their division. The climates are significantly different. Climate effects are very real but also very complicated, so that’s best left for another day.
[continue reading…]

{ 13 comments }

(I originally posted this at the S-R Blog, but I thought it would be very appropriate here as well.)

WARNING: Math post.

PFR user Brad emailed over the weekend with an interesting question:

“Wondering if you’ve ever tracked or how it would be possible to find records vs. records statistics….for instance a 3-4 team vs. a 5-2 team…which record wins how often? but for every record matchup in every week.”

That’s a cool concept, and one that I could answer historically with a query when I get the time. But in the meantime, here’s what I believe is a valid way to estimate that probability…

  1. Add eleven games of .500 ball to the team’s current record (at any point in the season). So if a team is 3-4, their “true” wpct talent is (3 + 5.5) / (7 + 11) = .472. If their opponent is 5-2, it would be (5 + 5.5) / (7 + 11) = .583.
  2. Use the following equation to estimate the probability of Team A beating Team B at a neutral site:

    p(Team A Win) = Team A true_win% *(1 – Team B true_win%)/(Team A true_win% * (1 – Team B true_win%) + (1 – Team A true_win%) * Team B true_win%)

  3. You can even factor in home-field advantage like so:

    p (Team A Win) = [(Team A true_win%) * (1 – Team B true_win%) * HFA]/[(Team A true_win%) * (1 – Team B true_win%) * HFA +(1 – Team A true_win%) * (Team B true_win%) * (1 – HFA)]

    In the NFL, home teams win roughly 57% of the time, so HFA = 0.57.

This means in Brad’s hypothetical matchup of a 5-2 team vs. a 3-4 team, we would expect the 5-2 team to win .583 *(1 – .472)/(.583 * (1 – .472) + (1 – .583) * .472) = 61% of the time at a neutral site.

Really Technical Stuff:

Now, you may be wondering where I came up with the “add 11 games of .500 ball” part. That comes from this Tangotiger post about true talent levels for sports leagues.

Since the NFL expanded to 32 teams in 2002, the yearly standard deviation of team winning percentage is, on average, 0.195. This means var(observed) = 0.195^2 = 0.038. The random standard deviation of NFL records in a 16-game season would be sqrt(0.5*0.5/16) = 0.125, meaning var(random) = 0.125^2 = 0.016.

var(true) = var(observed) – var(random), so in this case var(true) = 0.038 – 0.016 = 0.022. The square root of 0.022 is 0.15, so 0.15 is stdev(true), the standard deviation of true winning percentage talent in the current NFL.

Armed with that number, we can calculate the number of games a season would need to contain in order for var(true) to equal var(random) using:

0.25/stdev(true)^2

In the NFL, that number is 11 (more accurately, it’s 11.1583, but it’s easier to just use 11). So when you want to regress an NFL team’s W-L record to the mean, at any point during the season, take eleven games of .500 ball (5.5-5.5), and add them to the actual record. This will give you the best estimate of the team’s “true” winning percentage talent going forward.

That’s why you use the “true” wpct number to plug into Bill James’ log5 formula (see step 2 above), instead of the teams’ actual winning percentages. Even a 16-0 team doesn’t have a 100% probability of winning going forward — instead, their expected true wpct talent is something like (16 + 5.5) / (16 + 11) = .796.

(For more info, see this post, and for a proof of this method, read what Phil Birnbaum wrote in 2011.)

{ 8 comments }

Interceptions per Incompletion (or POPIP)

The closest I'm willing to get with a baseball photo.

I leave the baseball analysis to my brothers at baseball-reference.com, but I know enough to be dangerous. There’s a stat called BABIP, which stands for Batting Average on Balls In Play. A “ball in play” is simply any at bat that doesn’t end in a home run or a strikeout. The thinking goes that luck and randomness is mostly responsible for the variance in BABIP allowed by pitchers to opposing batters. Pitchers can control the number of strikeouts they throw and control whether they allow home runs or not, but they can’t really control their BABIP.

Therefore, if a pitcher has a high BABIP, sort of like an NFL team with a lot of turnovers, he’s probably been unlucky. And good things may be coming around the corner. A high BABIP means a pitcher probably has an ERA higher than he “should” and that his ERA will go down in the future. In fact, you can easily recalculate a pitcher’s ERA by replacing the actual BABIP he has allowed with the league average BABIP. And that ERA will be a better predictor of future ERA than the actual ERA. At least, I think. Forgive me if my baseball analysis is not perfect.

Are you still awake? It’s Monday, and I’ve brought not only baseball into the equation, but obscure baseball statistics. Let’s get to the point of the post by starting with a hypothesis:

Assume that it is within a quarterback’s control as to whether he throws a completed pass on any given pass attempt. However, if he throws an incomplete pass, then he has no control over whether or not that pass is intercepted.
[continue reading…]

{ 14 comments }

A thought experiment

Yeah, yeah, Football Perspective turned 100 today, blah blah blah. I have something on my mind and I need the wisdom of this crowd. Below is a thought experiment.

You are highly incentivized to correctly guess how many interceptions a quarterback threw in a specific game. If you can answer it correctly within the one-tenth of an interception, you win. (You can assume this is the average of 100 games, if you like, but the point being your answers should not be limited to whole numbers.)

I will inform you that the quarterback in question threw exactly 13 incomplete passes (or each of the 100 quarterbacks threw exactly 13 incomplete passes).

Now, before you guess as to the number of interceptions thrown by this quarterback, I could also let you know how many pass attempts the quarterback had. But I don’t have to. Do you want to know how many attempts he threw, or is that information irrelevant?

If it *is* relevant information that you want to know, how does that knowledge affect your answer? If you knew he threw 45 passes, will you now project him to have more interceptions or fewer interceptions? Please vote in the poll below, but I’m just as interested in your comments. So get to commenting!

[poll id=”6″]

{ 12 comments }

Are NFL Playoff Outcomes Getting More Random?

[Today’s post is brought to you by Neil Paine, my comrade at Pro-Football-Reference.com and expert on all things Sports-Reference related. You can follow Neil on twitter, @Neil_Paine.]

Most fans like to think of the NFL’s playoff system as being the final word on each team’s season — run the table and you’re the champs, the “best team in football”; lose, and your season means nothing. But what if I told you that the NFL playoffs are getting a lot more random in recent seasons? Would it change your attitude if you knew we were getting closer to the point where every playoff outcome might as well be determined by a coin flip?

David Tyree and Rodney Harrison use their bodies to attempt to depict the normal distribution.

To research this phenomenon, I want to explore two models of predicting playoff games: one powered by as much information as possible, the other completely ruled by randomness. I then want to simulate the last 34 postseasons, and see how much of a predictive edge that information actually gives you. If it’s giving you less of an edge, it means the playoffs are being ruled more by randomness.

First, I grabbed every playoff game since 1978 and looked at the Vegas lines. To convert from a pointspread to a win probability, you have to use Wayne Winston’s assumption that “the probability […] of victory for an NFL team can be well approximated by a normal random variable margin with a mean of the Vegas line and a standard deviation of 13.86.” If the Patriots are favored by 7 over the Ravens, this means you can calculate their odds of winning in Excel via:

p(W) = (1-NORMDIST(0.5,7,13.86,TRUE))+0.5*(NORMDIST(0.5,7,13.86,TRUE)-NORMDIST(-0.5,7,13.86,TRUE)) = 69.3%

This gives us a good prediction — in fact, perhaps the best possible prediction — of the outcome going into the game. So for each playoff, I’m going to say a “Smart” fan picks winners based on these numbers; 69.3% of the time he’ll pick the Patriots, and 30.7% of the time he’ll pick the Ravens. Of course, we also need a control, a fan who picks completely at random, so I’m also going to track a “Dumb” fan who thinks every single game is a coin flip.

I’m going to simulate these decision-making processes for the Smart and Dumb fans in every playoff since 1978, running through each year 1,000 times. How much better at picking do you think the Smart fan will be than the Dumb one?

To be clear, it was Neil who called you the dumb fan. It was Neil!

Well, over the course of the whole sample, the Smart fan averaged a little more than 204 correct picks in 356 games, which is good for a 56.6% rate. The Dumb fan had 178 correct picks, a 50% success rate. In other words, being “Smart” gave you an edge of 6.6% over the fan who picked Aaron Eckhart-style.

But what I really want to know is whether this number has changed over time. The logical comparison I wanted to make was pre- and post-free agency, but it turns out there is practically no difference. From 1978 through 1993, the Smart fan would pick winners at a 56.6% rate (6.8% better than his Dumb counterpart), and from 1995-2011, he picks at a 56.3% clip (6.2% better than the Dumb fan). That observed difference, less than a half a percentage point, can be chalked up completely to random variation, so there’s no evidence that the playoffs have been more or less random in the salary cap era.

However, if you compare pre-2005 to post-2005, you see a major difference that cannot be explained away by chance alone. From 2005-2011, the Smart fan would have picked only 53.2% of playoff games correctly; that’s a difference of 3.2 percent from 2005-11, vs. 6.6 percent over the course of the full sample!

Let me restate this finding: the difference between an intelligent prediction of NFL playoff games and a pure coinflip has been sliced in half in the last seven postseasons. In other words, the playoffs are more random now than they’ve ever been in the last 35 years, something we’ve all seen anecdotally with the 2005 Steelers, both Giants championships (especially last year, when they were actually outscored during the regular season), and the 2008 Cardinals’ unexpected SB run, among others.

So does this change how you feel about the playoffs? Do you still think the “best team” is synonymous with the Super Bowl Champion, or do you think it’s more of a crapshoot than ever before?

{ 24 comments }

The fountain of youth consists of two parts levitation and one part Matt Schaub

In a year where offensive fireworks dominated the headlines, here’s a piece of trivia on the other side of the ball: 36-year-old London Fletcher led the league in tackles. Fletcher, like Ray Lewis, is past the point where he can be referred to by his name alone. Instead, both get the honorific “ageless” before their names. The ageless Ray Lewis made his thirteenth Pro Bowl last season, putting him one behind Merlin Olsen and Bruce Matthews for the record. While it’s tempting to say Lewis is making Pro Bowl berths based on reputation now, I don’t think it’s his play is undeserving of such recognitiion. According to Pro Football Focus, Lewis was the 5th best inside linebacker last season. As for London Fletcher, he also registered in the top ten according to PFF. And while Fletcher was never as dominant as Lewis, ‘ageless’ simply has replaced ‘criminally underrated’ for Fletcher, a moniker that preceded his name most of the time for the last decade.

I think most of us know that it’s pretty incredible that these two are 37-years-old and still playing at high levels (well, at least we expect them to in 2012). But do we really recognize how truly rare this is? There are eleven modern era inside linebackers currently enshrined in the Pro Football Hall of Fame. The table below lists them chronologically based on the year they entered the league. The columns show the “Approximate Value” or “AV” score (as defined by Pro-Football-Reference) assigned to each linebacker for each season during his thirties.

Linebacker3031323334353637
Mike Singletary181213159000
Harry Carson71013149600
Jack Lambert1717200000
Willie Lanier95500000
Dick Butkus156000000
Nick Buoniconti91116149010
Ray Nitschke16151097220
Sam Huff118860600
Les Richter119200000
Joe Schmidt172190000
Bill George171415919609
Average13
10875201

[continue reading…]

{ 3 comments }

Not opposed to occasional acts of piracy.

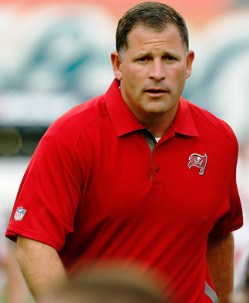
Greg Schiano made an interesting comment the other day which went against conventional wisdom.

“It’s a fine line between being a physical, aggressive football team and getting a flag. You gotta be careful. I don’t ever want to be the least penalized team in the league, because I don’t think you’re trying hard enough then…. But I certainly do want to be in the top 10. That’s where you should be. You should be — five through 10 is a great place to be as a penalized team.”

Schiano’s statement makes some sense. Not all penalties are the same, even though they’re usually grouped that way. False starts, late hit penalties, excessive celebrations, delays of game and “12 men on the field” are examples of penalties that drive every coach crazy. When we think of undisciplined teams or stupid penalties, these are the ones we envision. Other penalties, like offensive holding or defensive pass interference might not be bad at all, and might be symptomatic of rational thinking. If a lineman believes the likelihood of his man getting to the quarterback is higher than the likelihood of him getting called for a penalty if he holds the defender, then holding may be the wise course of action. Similarly, a defensive back that tries to prevent a touchdown on pass interference isn’t necessarily committing a bad penalty. Intentional grounding is rarely a penalty that really hurts the team, as it’s usually called when for the quarterback, the alternative is usually a sack (or worse).

Off-sides, roughing the passer or certain penalties associated with hits (defensive receivers, leading with the helmet, etc.) are correlated with aggressive behavior. They should be minimized, of course, but I would not shocked to discover that they were generally correlated with positive play. The point being there are many types of penalties, an issue I’ve touched on before.

Still, I performed a regression analysis on penalties and team success. The results show that fewer penalties appears to be very slightly correlated with winning. A team with 80 penalties on the season would be expected to win 52.4% of its games, while a team with 100 penalties on the year would be projected to win 50.1% of its games. To jump just one win in a 16-game season, the results here indicate that a team would need to commit 54 fewer penalties. That’s absurd on its face,, which means that there is not necessarily a causal relationship between penalties and winning. Which is exactly what Schiano implied.

But we could break it down even further. I grouped all teams since 1990 into penalty ranges. As you can see, there does seem to be a small relationship between fewer penalties and winning:

Pen#TmsWin%
57 to 74330.535
75 to 901550.516
91 to 1092780.501
110 to 1291740.487
130-163330.451

Of course, this doesn’t go against what Schiano said. He didn’t want to be below average in penalties, just not number one. And I’m sure he’d want to be number one at avoiding stupid penalties. But I agree with him that the goal of a team shouldn’t be to avoid penalties at all costs, just like a team shouldn’t try to avoid interceptions at all costs. The goal is simply to win, and there being too aggressive isn’t the only option that carries with it a tradeoff — a team that isn’t aggressive enough is also unlikely to win championships.

[Updated: I realized that I might as well post the results of the teams to lead the league in fewest penalties and the eventual Super Bowl champs. The first table shows the team with the fewest penalties each season and how they performed in the post-season. On average, these teams won 9 games. The second table shows all Super Bowl champions since 1990 and where they ranked in penalties; on average, they ranked 12th in penalties.]

YrTeamWin%RecPenPost
2011GNB0.93815-176L-DIV
2011IND0.1252-1476--
2010ATL0.81313-358L-DIV
2009JAX0.4387-970--
2008NWE0.68811-557--
2007SEA0.62510-659L-DIV
2006DEN0.5639-767--
2005CAR0.68811-591L-CCG
2004SEA0.5639-779L-WILD
2003NYJ0.3756-1069--
2002KAN0.58-875--
2001NYJ0.62510-662L-WILD
2000NYJ0.5639-776--
1999ARI0.3756-1070--
1998CIN0.1883-1369--
1997TAM0.62510-677L-DIV
1996IND0.5639-776L-WILD
1995CHI0.5639-771--
1994CHI0.5639-765L-DIV
1993NWE0.3135-1164--
1992NOR0.7512-460L-WILD
1991MIA0.58-862--
1990MIA0.7512-464L-DIV

YrTeamWin%RecPenRk
2011NYG0.5639-79411
2010GNB0.62510-6783
2009NOR0.81313-38913
2008PIT0.7512-49519
2007NYG0.62510-6776
2006IND0.7512-4867
2005PIT0.68811-5996
2004NWE0.87514-21016
2003NWE0.87514-211122
2002TAM0.7512-410314
2001NWE0.68811-59215
2000BAL0.7512-49511
1999STL0.81313-311321
1998DEN0.87514-211516
1997DEN0.7512-411624
1996GNB0.81313-3926
1995DAL0.7512-4908
1994SFO0.81313-310916
1993DAL0.7512-49414
1992DAL0.81313-39111
1991WAS0.87514-2909
1990NYG0.81313-3835
{ 8 comments }
Next Posts