≡ Menu

Bob Ford, a longtime fan of Pro-Football-Reference and Football Perspective, has contributed a 2-part guest post on Yards Per Carry Leaders. Bob is the owner and founder of GOATbacks.com, which looks at the greatest running backs of all time. Thanks to Bob for yesterday’s and today’s articles!


Yesterday, I looked at the YPC leaders for the 46 seasons since the merger was completed, 1970-2015 at the 100/120/180-carry cutoffs. Today, a look at the YPC leaders since 1970 at three higher thresholds. [continue reading…]

{ 16 comments }

Bob Ford, a longtime fan of Pro-Football-Reference and Football Perspective, has contributed a 2-part guest post on Yards Per Carry Leaders. Bob is the owner and founder of GOATbacks.com, which looks at the greatest running backs of all time. Thanks to Bob for today’s (and tomorrow’s) article!


I’ve been curious about YPC leaders over the years, particularly as they’re sorted through increasing numbers of carries. Over the next two days, I will look at the YPC leaders using six different carry minimum thresholds: 100, 120, and 150 today, and 180, 220, and 280 carries tomorrow. These cutoffs weren’t arrived at in an analytically rigorous way, just through instinct and personal judgment. I ran a number of different carry thresholds and simply tried to keep my statistical eyes peeled; in my view, these are at least 6 of the minimums where interesting changes seemed to emerge.

As a general rule, though not an absolute one, I’m in the camp that regards YPC as, at best, a questionable stat when it comes to assessing skill and performance, and at worst a misleading and even bunkum stat, to borrow a term from Chase and the crew over at Intentional Rounding. Don’t get me wrong, I’m not suggesting YPC is useless. In fact in some narrow contexts I think it’s even key. But I think it’s woefully overused and over relied on, and I do regard it with suspicion when it comes to assessing rushing and running back value and effectiveness, particularly in “real-game” situations. I think the same holds for mobile quarterbacks, too.

I decided to look at YPC leaders for the 46 seasons since the merger was completed, 1970-2015. Again, no special reason, just to make things more manageable. This would probably get really interesting if we included all pre-merger seasons, but I didn’t do that here. If anyone does, kudos. At any rate, here are the YPC leaders since 1970, sorted at 6 different carry thresholds. [continue reading…]

{ 1 comment }

Guest Post: Putting Lipstick on the YPC pig

Brian Malone, a writer for dynastyleaguefootball.com, has put together a great guest post today. You can follow him on Twitter at @julesdynasty. Thanks to Brian for today’s article!


Putting lipstick on the YPC pig

We all know that that yards per carry is, as Danny Tuccitto puts it, nearly a “bunkum stat” in terms of predictive power.   Even as a descriptive tool, YPC is tolerable but unsatisfying.  Matt Forte (4.12) and Chris Johnson (4.15) had nearly identical YPC in 2015, but their paths to these numbers were notably different.  Forte rarely got stuffed behind the line of scrimmage, and he was well above average at posting four-yard gains.  Johnson, in contrast, was a home run hitter, padding his YPC with runs longer than 20 yards.

Painting a better picture

We could supplement YPC with the standard deviation of a player’s runs.  Or, as Jeff Levy suggests, we could include confidence intervals to define a player’s “true” YPC.  Both supplements add useful information, but neither smacks the reader in the face with the contrast between Forte and Johnson.  For that, we may need a visual. [continue reading…]

{ 16 comments }

Yesterday, Bob Ford wrote DeMarco Murray and, how his 2014 season stands out as a career outlier. Today, I want to look at where it stands among the biggest year-to-year declines.

I looked at all players who rushed for at least 5 games in consecutive years, and rushed for at least 60 yards per game in the first season. For example, Murray rushed for 1,845 yards in 2014, an average of 115.3 yards per game. Last year, in 15 games, Murray averaged only 46.8 rushing yards per game. That’s a dropoff of 68.5 rushing yards per game, which is the second most in NFL history. The first? That honor goes to Lee Suggs.

Suggs was a star at Virginia Tech, rushing for 27 touchdowns in 11 games as a sophomore at Virginia Tech before tearing his ACL as a junior. In his senior year, he had another great season, rushing for 1,325 yards and 22 touchdowns. He was a 4th round pick of the Browns in 2003, where he served as the team’s backup. In ’04, he stole the job from William Green, and rushed for over 100 yards in each of Cleveland’s final three games. He averaged 74.4 rushing yards per game in ’04, but lost his job to Reuben Droughns in ’05. As a result, Suggs saw his average decline by 72.5 yards per game, an even more dramatic dropoff than Murray. [continue reading…]

{ 3 comments }

Bob Ford, a longtime fan of Pro-Football-Reference and Football Perspective, has contributed today’s guest post. Bob is the owner and founder of GOATbacks.com, which looks at the greatest running backs of all time. Thanks to Bob for today’s article!


Is DeMarco Murray in Danger of Joining A Very Exclusive Club?

In 2014 DeMarco Murray rushed for 1,845 yards on 392 carries at 4.7 yards per carry and just over 115 yards a game. That’s a great rushing season by any standard, and it puts Murray in some pretty exclusive company. Since Jim Brown first broke 1,800 rushing yards in 1963, just 16 other running backs have done it a total of 20 times, and only 3 (Dickerson, Sanders and Simpson) did it more than once.

Among the 17 RBs who’ve rushed for 1,800 yards, 10 have posted at least 10,000 career rushing yards, and 4 have at least 9,000. Those 4 are Ahman Green with 9,205, Earl Campbell with 9,407, Chris Johnson with 9,442 and Shaun Alexander with 9,553. And only 2 who’ve retired, Terrell Davis with 7,607 career rushing yards, and Jamal Anderson with 5,336, have failed to break 9,000 career rushing yards. After 5 seasons and 5,228 career rushing yards, DeMarco Murray is still active, so we don’t know how many career rushing yards he’ll eventually have, but all running backs who’ve rushed for more than 1,800 yards in a season have always, with the exception of Anderson and the singularly unique exception of Davis, put up a minimum of 9,000 career rushing yards.

Why do I call Davis a “singularly unique” exception? I’ll get to that in a minute, but consider how far behind the rest of the group Jamal Anderson, who rushed for 1,846 yards in 1998, actually is. He’s nearly 2,300 yards behind Davis and nearly 4,000 behind Green. What’s more, and not enviable for Murray, is that it’s Anderson’s career, not Davis’ or any of the others’, that bears a striking resemblance to Murray’s, and that doesn’t bode well for Murray. [continue reading…]

{ 11 comments }

In 2015, there were just 15 games where a player rushed for at least 150 yards in a single game. That’s the smallest number since 1996, when just 14 players hit that mark. Thomas Rawls (!) was the only player with multiple games of 160+ rushing yards, and Adrian Peterson was the only other player with two 150+ yard rushing games.

Games with at least 150 rushing yards were much more common in the early ’00s, but they have not exactly been frequent throughout history. The graph below shows the number of times players rushed for 150+ yards in a game in each season since 1960. Note that in seasons with fewer than 32 teams/16 games, the number of instances were prorated as if it was a 512-game league season.

150+ rush2

The same trend holds up if we look at 125+ rushing yard games, with 2015 representing a modern low. Again, throughout this post, I have pro-rated non-512 game seasons. [continue reading…]

{ 10 comments }

Today’s guest post comes from Adam Harstad, a co-writer of mine at Footballguys.com. You can follow Adam on twitter at @AdamHarstad.


On Saturday, the Hall of Fame selection committee will meet, lock themselves in a room, and debate the relative merits of the 15 modern-era finalists for induction. After an intense discussion, the results will be announced nationally as the final event in the festivities leading up to Sunday’s Super Bowl.

While the list of 15 finalists includes several names who have been waiting longer than they should for their call, the one that stands out the most to me is Terrell Davis, who has been a semi-finalist more than anyone else in this year’s class, reaching the top 25 ten times in his ten years of eligibility.

Hopefully the Hall of Fame committee can manage to make room for him in what could easily be a stacked class. Whatever they do this Saturday, however, will not change one simple fact: Terrell Davis should have long ago been elected to the Hall of Fame. [continue reading…]

{ 69 comments }

Antonio Brown has 1,586 receiving yards, most in the NFL, which puts him on pace for 1,813 receiving yards this season.

Adrian Peterson has 1,314 rushing yards, most in the NFL, which puts him on pace for 1,502 rushing yards in 2015.

That’s pretty weird.  In general, the rushing leader usually gains more rushing yards than the receiving yardage leader picks up through the air.  From 1970 to 2014, the receiving yards leader  “outgained” the rushing yards leader in only 10 of 45 seasons.  And in only three of those years did the receiving leader “win” by more than 100 yards: in 1999 (Marvin Harrison had 1663 receiving yards; his teammate Edgerrin James had 1553 rushing yards), 1990 (Jerry Rice over Barry Sanders, 1502 to 1304), and 1982 (Wes Chandler over Freeman McNeil in the strike-shortened season, 1032to 786). On a per-game basis, it’s tough to beat what Chandler did, but Brown is on pace to become the first receiving leader since the merger (in fact, the first in the NFL since 1952) to “outgain” the rushing leader by over 300 yards. [continue reading…]

{ 7 comments }

New York Times Checkdowns: Martin vs. Gurley Battle

A little late, but here is a link to my Thursday Night Football preview: 

http://www.nytimes.com/2015/12/18/sports/football/thursday-nfl-game-has-running-backs-to-savor.html

{ 0 comments }

Running Back Class of 2008 Still Going Strong

Jamaal Charles, Matt Forte, Chris Johnson, Justin Forsett, Jonathan Stewart, Danny Woodhead, Mike Tolbert, Darren McFadden, Marcel Reece, and Jerome Felton all entered the NFL in 2008. So did Steve Slaton, the rookie rushing leader that year, and Ray Rice, Rashard Mendenhall, Michael Bush, Peyton Hillis, and Felix Jones. Analyzing where the ’08 class ranks in NFL history is a project for the offseason, but today, I thought it would be fun to look at rushing yards by running backs by class year.

The graph below shows that data through six weeks of the 2015 season. As you can see, players in their 8th NFL season — those who entered the league in 2008 — are doing quite well.

wk6 2015 rushing yards class year

The class with the most rushing yards so far in 2015 are the rookies. That class is currently led by Thomas Rawls, but has also received strong production from higher picks like Todd Gurley, Melvin Gordon, and T.J. Yeldon. After the class of ’15, there’s a gradual decline with respect to production by older classes. And then, there’s the class of 2008. [continue reading…]

{ 2 comments }

As I did last year, I want to analyze the rushing stats for each team in 2014 using a metric known as Adjusted Rushing Yards per Carry. Thanks to the help of Brian Burke of Advanced Football Analytics (formerly Advanced NFL Stats), we were able to conclude that the value of a first down was about 9 yards. And since we’ve previously determined that the marginal value of a touchdown is 20 yards, this means Adjusted Rushing Yards per Carry is pretty easy to calculate. Also, since Bryan Frye crunched the numbers, we might as well exclude all kneels from the process, too.

One thing to keep in mind (which I have forgotten in the past): since the NFL records-keeping process labels touchdowns as first downs, you should only assign 11 yards per touchdown if you are already giving 9 yards to all 1st downs. And since kneels are marked down as runs, you must back those out, too. As a result, here’s the formula to use:

Adjusted Rushing Yards per Carry = (Rush Yards + 11 * Rush TDs + 9 * Rush First Downs – Kneel Yards Lost [1]Since this is a negative number — i.e., 10 kneels for -11 yards — we need to subtract kneel yards to turn those yards into an add back in the numerator. ) / (Rushes – Kneels)

If we use this metric to analyze the 2014 season, how would it look? Seattle was by far the top rushing team in the NFL last year, rushing for 2,762 yards and 20 touchdowns on 525 carries, good for a 5.26 yards per carry average. But 19 of those 525 carries were kneels, and they went for -20 yards. In addition, Seattle not only led the league with 144 rushing first downs, the Seahawks gained a first down on 28.5% of non-kneel carries, also the highest mark in the NFL. Seattle averaged 8.49 Adjusted Rushing Yards per Carry, while the NFL average was 6.63. Since the Seahawks averaged 1.86 ARY/C over average for 506 non-kneel carries, that means Seattle rushed for 941 rushing yards (1.86 * 506) above average.

The full list for all 2014 teams, below: [continue reading…]

References

References
1 Since this is a negative number — i.e., 10 kneels for -11 yards — we need to subtract kneel yards to turn those yards into an add back in the numerator.
{ 10 comments }

Franchise Nemeses: Rushing Metrics

Yesterday, we looked at the top statistical passers against each franchise. Today, we revise a post from a couple of years ago and look at the top rushing producers against each franchise.

Only two players have emerged as a franchise’s top rushing nemesis over the last two years. One of those situations involves the Rams. Only five players have ever rushed for 1,000 yards in their careers against the Rams franchise: Shaun Alexander, Jim Taylor, and Tony Dorsett each finished with between 1,008 and 1,032 rushing yards against the Rams. As of two years ago, Roger Craig’s 1,120 was the most, but since then, Frank Gore has upped his career total to 1,191 rushing yards against St. Louis (and he’s done it in three fewer games than Craig).

With the Saints, it’s even trickier. For a long time, Lawrence McCutcheon was the career rushing leader against New Orleans with 966, but Eric Dickerson (984) passed him before Dickerson retired. Then, Warrick Dunn took over the top spot with 1,135 yards. But in 2013, DeAngelo Williams passed Dunn for most career rushing yards against the Saints. Otherwise, the list below remains pretty similar to how things were last time, although note that this time around, I’m including the playoffs. That’s enough to cause Eddie George to leapfrog Jerome Bettis for the top spot against the Ravens.

Oh, and for the second day in a row, you have to go back to the ’60s to find the man who has been the number one nemesis for the 49ers: [continue reading…]

{ 3 comments }

In 2008, Jamaal Charles had 67 carries and averaged 5.33 yards per carry. Those 67 carries represent 5% of Charles’ career attempts to date (excluding playoffs). That season, the NFL league average was 4.20 yards per carry, which means Charles was 1.12 (after rounding) YPC above average in 2008, or 1.12 YPC above average on 5% of his career carries.

In ’09, Charles had 190 carries, representing 15% of his career YPC. He averaged 5.89 YPC, and the league average was 4.24, which means Charles was 1.65 YPC above average for 15% of his career carries.

In 2010, those numbers were 230, 18%, 6.38, and 4.21, so Charles was 2.17 YPC above league average on 18% of his career carries.

I performed that analysis for every season of Charles’ career — and every other player in NFL history — to determine each player’s career YPC average relative to league average. The table below shows the 200 running backs (by default, only the top 10 are shown) in pro football history with the most carries. The table is sorted by YPC over league average. Here’s how to read it. Jamaal Charles ranks 1st in YPC over league average. His first year was 2008 and his last year (so far) was 2014. For his career, Charles has 1,249 career rush attempts, which ranks 118th in pro football history. He has 6,856 yards, giving him a 5.49 career YPC average. His “expected” career yards per carry average — based on the league average YPC in each season of his career, weighted by his number of carries — is 4.21. Therefore, Charles has averaged 1.28 YPC above league average for his career, the highest rate in football history. [continue reading…]

{ 30 comments }

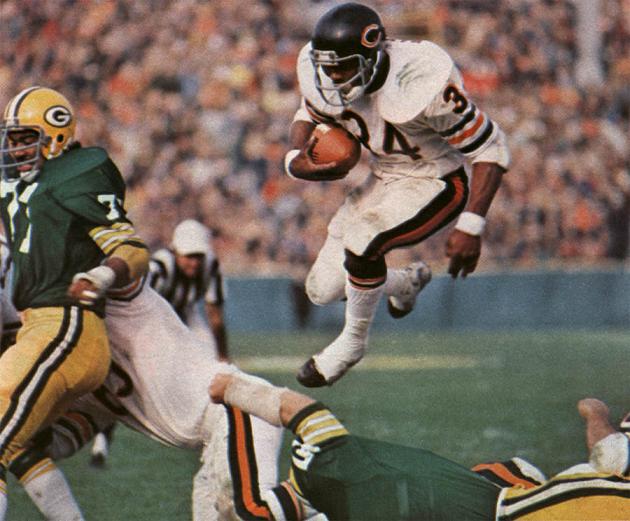
Was Walter Payton the biggest workhorse in NFL history? In 1977, he gained 43.5% of Chicago’s total offensive yards. The next year, it was 39.5%, and the year after that, it was 39.1%. Payton also was responsible for 37.8% of the Bears output in ’76, 36.2% of the team’s yards in ’84, and 35.8% of Chicago’s offense in 1980.

But wait, there’s more! In ’82 and ’85, Payton was responsible for 33.1% and 33.5% of his team’s offense, and in ’81 and ’83, it was 32.7% and 32.8%. For ten seasons, Payton was responsible for at least thirty-three percent of his team’s offense! And in 1986, he gained 30.6% of all Chicago yards.

Yesterday, we looked at the single-season leaders in percentage of team yards. Today, the career list, using a 100-95-90 weighting method. What’s that? To avoid giving too much credit to compilers, I did not assign full credit to each season, and instead used the following methodology:

1) Calculate the total yards from scrimmage by each player in each season since 1932.

2) Calculate the total team yards (excluding sacks) by that player’s team. Players who played for multiple teams in a season were therefore prejudiced by this methodology.

3) Calculated the percentage of team yards gained by each player in each season since 1932. This was the basis of yesterday’s post.

4) Order each player’s career from best season (per step 3) to worst.

5) Give each player 100% credit during his best season, 95% credit during his second best season, 90% during his third best, and so on. So for Payton, we give him 100% of 43.5%, 95% of 39.5%, 90% of 39.1%, 85% of 37.8%, and so on.

6) Sum the values in step 5 for each player for each season to get a career grade.

That career grade doesn’t mean much in the abstract — Payton’s grade is 318% — but when we order the list, it does provide some limited insight as to which players have been the biggest workhorses in NFL history. This is far from a perfect formula, but I do think it’s interesting. Note that I also performed the same analysis using a 100-90-80 method — to give even less value to compilers — and not a single player moved up or down in the top 15. The table below shows the top 150 players by this metric: [continue reading…]

{ 25 comments }

Last year, DeMarco Murray led the NFL with 1,845 rushing yards. The 32nd-ranked rusher last season rushed for 570 yards, which means Murray rushed for 1,275 yards more than the Nth-ranked rusher, with N representing the number of teams in the NFL. That’s obviously excellent, although not quite the best of all time.

That honor, as regular readers could have guessed, belongs to O.J. Simpson. In 1973, Simpson rushed for an incredible 2,003 yards, while the 26th-ranked rusher in the 26-team NFL rushed for 655 yards. As a result, Simpson is credited with 1,348 yards over the Nth-ranked rusher. Then again, remember that this was a 14-game NFL season; we need to pro-rate that number to 16 games to make for a fairer comparison. That brings Simpson’s season up to +1,540, slightly edging out Adrian Peterson‘s 2012 season (2,097, 564, +1533).

What if we use that methodology for every player during every season of his career? That, to me, is an improvement on just a list of the career rushing leaders, since we don’t give players any benefit for junk seasons. That may be the only thing this list is an improvement on — after all, it is still based on only one statistic — but hey, it’s Friday. Below are the career grades for the top 150 running backs (note that by default, the table only displays the top 25). I have also listed for each back his career rushing yards and his rank in that category. [continue reading…]

{ 15 comments }

A quick data dump today. Since 1960, players who record 20+ carries in a game were on the winning side of things 72.7% of the time. Steven Jackson, however, is just 30-31-1 in his 62 games where he has had at least 20 carries. Given that we would “expect” a player to win 45.1 games given 62 games with 20 carries, Jackson’s 30.5 wins falls 14.6 wins shy of expectation. That, perhaps not surprisingly to regular readers, is the worst record relative to expectation among all running backs since 1960.

The table below shows all running backs who had at least 20 games with 20+ carries over the last 55 years, including the postseason. Thurman Thomas is on top of the table because he had 71 games with 20+ carries, and his teams went 63-8 in those games for an incredible 0.887 winning percentage. That gave Thomas 11.4 wins over expectation, the most ever. If you want to sort by a different category (say, win%), you can: the table is fully sortable and searchable. [continue reading…]

{ 6 comments }

Which Running Backs Played With Best Passing Games?

Payton played with some terrible passing attacks

Payton played with some terrible passing attacks

Adjusted Net Yards per Attempt is the best simple measure of quarterback play. ANY/A is defined as (Gross Passing Yards + 20 * PassTDs – 45 * INTs – Sack Yards Lost) divided by (Pass Attempts + Sacks).  Relative ANY/A, or RANY/A, is simply ANY/A minus league average.

I looked at the 100 players with the most rushing yards in football history.  Then, for each player, I calculated the average weighted RANY/A of the offenses he played on.  As usual, to come up with a career grade, I gave more weight to a player’s best seasons.  If a running back had 18% of his rushing yards come in one season, well his team’s RANY/A for that year was responsible for 18% of his career RANY/A grade.

For example, in 2001, the good Jake Plummer showed up for the Cardinals, and Arizona had a RANY/A of +0.53.  But since Thomas Jones rushed for only 380 yards that year — just 3.6% of his career total — only 3.6% of his career RANY/A is based on the +0.53.  Conversely, Jones set a career high with 1,402 rushing yards in ’09 for the Jets, representing 13.2% of his career total.  New York, behind a rookie Mark Sanchez, had a RANY/A of -1.69 that year, which matters a lot more when calculating Jones’ career grade.  In fact, Jones played with bad passing offenses for most of his career: as it turns out, among all players in the top 100, it’s Jones who played with the worst passing offenses in his career. [continue reading…]

{ 6 comments }

Running Back Heat Maps

Commenter Dan had a good suggestion: what if we create heat maps for each running back, with color-coding to depict how often a player gained at least X amount of yards?

Well, ask, and ye shall receive. I looked at all running backs with at least 100 carries in 2014, and then measured on what percent of their runs did each running back gain at least 0 yards, at least 1 yard, at least 2 yards, etc., up to 10 yards. I also calculated the percentage of runs that went for at least 15+ and at least 20+ yards. [continue reading…]

{ 18 comments }

On Friday, I asked the question: how many carries would we need to take away from DeMarco Murray in order to drop his YPC average to at or below league average?

Today, I want to look at it from the other side. How many of Trent Richardson’s worst carries would we need to erase to bring his YPC above league average? For this experiment, assume that we are sorting each running back’s carries in ascending order by yards gained. I’ll give you a moment to think about the answer.

[Final Jeopardy Music]

[Keep thinking…]

[Are you ready?]

[Your time is now up. Post your answer in the comments!] [continue reading…]

{ 12 comments }

DeMarco, how many Cowboys fans still think you're great?

DeMarco, how many Cowboys fans still think you’re great?

DeMarco Murray was really, really good last year. He rushed 393 times for 1,845 yards, producing a strong 4.69 YPC average. Jamaal Charles was also really, really good — he averaged 5.07 yards per rush last year, albeit on “only” 205 carries. The NFL average yards gained per rush was 4.16 last season, down a tick from in previous years. But that brings us to the question of the day:

Suppose we sort each running back’s carries in descending order by yards gained. How many carries would we need to take away from Murray in order to drop his YPC average to at or below league average? Same question for Charles. I’ll give you a moment to think about this one.

[Final Jeopardy Music]

[Keep thinking…]

[Are you ready?]

[Your time is now up. Post your answer in the comments!]
[continue reading…]

{ 50 comments }

Last year, I built a trivia question around the leaders in receiving yards per games over a 3-year period. Today, the same thing but for rushing.

Trivia hint 1 Show


Trivia hint 2 Show


Trivia hint 3 Show

The table below shows every player to average at least 75 rushing yards per game over a 3-year period, with a minimum of at least 100 carries in each season. [continue reading…]

{ 2 comments }

The Emmitt Smith Rant

Emmitt Smith was a product of the system, the one where they gave him the ball.

Emmitt Smith was a product of the system, the one where they gave him the ball.

One of Doug Drinen’s first posts at the old PFR Blog was titled, “The Emmitt Smith Rant.” That was now nine years ago, and while not much has changed regarding Smith’s career since 2006, how many people other than me still remember that old post? So I’ve decided to revive Doug’s old post, with his permission, of course.

With greatness comes backlash, and every great player has collected his share of detractors. And while Football Perspective readers don’t underrate him, it feels as though Emmitt Smith has been remembered by a significant number of football fans as a less-than-special running back.  He played with Hall of Famers at quarterback and wide receiver, with Pro Bowlers at fullback, tight end, and several spots on the offensive line. As a result, it’s understandable that some diminish the peak numbers he produced during his prime.

And yes, he did put up some monster numbers during his prime.  From 1991 to 1995, Smith was historically dominant. Consider that among all running backs during their ages 22 through 26 seasons (i.e., Smith from ’91 to ’95), he rushed for 8,019 yards; the next closest player during those ages was LaDainian Tomlinson with 7,361.  Smith also rushed for 85 touchdowns: Tomlinson (72) is the only other player within 20 rushing touchdowns of Smith during those ages.

But let’s say you don’t want to give Smith “full credit” for those years.  What about what he did from 1998 to 2001? During those years, Chan Gailey and Dave Campo coached the team for two seasons each. Dallas went 28-36 during those years, and the passing attack ranked 17th in Net Yards per Attempt. In other words, these weren’t the Troy Aikman/Michael Irvin Cowboys. And while Larry Allen was still around, the offensive line was more name than substance at this point.

At the start of this four-year period, Smith was 29 years old. Through age 28, Smith had recorded 2,595 carries in the regular season, [1]In addition to 318 more in the playoffs. the most of any player through age 28 in NFL history. So you’ve got a situation where a running back had been worn down to an absurd degree, stuck on a mediocre team and on a mediocre offense. If Smith was not a special back, how would he do? [continue reading…]

References

References
1 In addition to 318 more in the playoffs.
{ 21 comments }

The GOAT.

The GOAT.

On February 20th, Football Perspective hosted a “Wisdom of Crowds” election with respect to the question: Who is the Greatest Running Back of All Time?™ Well, Football Perspective guest commenter Adam Steele offered to count the ballots, and I’ll chime in with some commentary.

There were 41 ballots entered, with each person ranking his or her top 20 running backs. The scoring system was simple: 20 points for a 1st place vote, 19 for a 2nd place vote, and so on. As it turns out, the race for the top spot was heated, with three players running away from the pack.

This chart is sortable by total points, points per ballot (using 41 as the denominator), GOAT votes, top 5 votes, and top 10 votes. In the interest of statistical significance, a player needed to appear on at least five ballots in order to be ranked in the table below. [continue reading…]

{ 113 comments }

Forsett, praising his Excess Yards

Forsett, praising his Excess Yards

In the comments to the Greatest Running Back of All-Time Post — and reminder, entries are due by midnight Thursday — a debate broke out between sn0mm1s and Jay Beck, among others, about how to value running backs generally, and specifically, the value of long runs.

One idea I’ve had before is that the yards a player gains after picking up a first down are similar to the yards picked up by a returner. For example, when a punt returner gains 10 yards instead of 5, that’s obviously worth 5 additional yards of field position to his team. But it’s not as valuable as 5 yards on 3rd-and-5; the return yards were gained outside of the context of the down-and-distance/series-of-downs nature of the game.

Does this mean that all yards gained after a first down are exactly as valuable as return yards? I’ll leave up that to the reader to decide. But I do think one thing is noncontroversial: Lamar Miller ran for a 97-yard touchdown on 1st-and-10 against the Jets in week 17, the most valuable 10 yards during that run were the first ten. The last 87 yards were slightly less valuable (on a per-yard basis), or akin to the yards a player would gain on a return.

At this point, you might be thinking, “Who cares?” And that’s a very good question: after all, return yards are valuable. And the last 87 yards of Miller’s run were certainly more valuable to Miami than the first 10 yards, even if that may not be true on a per-yard basis.

But I thought it would be interesting to look at all running plays this season, and break them into two categories: yards that came after a first down had already been achieved, and all other rushing yards. So a 10-yard run on 3rd-and-5 has five yards in each bucket; if it was 3rd-and-1, 9 yards get assigned to the “excess yards” bucket, and 1 yard to the “going towards picking up a first down” bucket. [continue reading…]

{ 19 comments }

Since 1950, there have been only 24 seasons where a team’s rushing leader rushed for more yards than its passing leader gained through the air. The last team to accomplish this feat was the 2009 Titans, when Chris Johnson rushed for 2,006 yards. That year, the Titans split the duties at quarterback, with Vince Young throwing for 1,879 yards and Kerry Collins finishing with 1,225.

Can you guess which team had the largest differential?

Trivia hint 1 Show


Trivia hint 2 Show


Trivia hint 3 Show


Click 'Show' for the Answer Show
[continue reading…]

{ 4 comments }

Greatest RB of All Time: Wisdom of Crowds Edition

Two weeks ago, Adam Steele administer a Wisdom of Crowds edition of the GQBOAT debate. Today, Adam has offered to run the same experiment but for running backs.  And we again thank him for that.


Who is the Greatest Running Back of All Time? In recent years, the practice of crowd sourcing has gained momentum in the analytics community, in some cases yielding more accurate results than mathematical models or expert opinions. For the initiated, here’s the gist: Every human being represents a data point of unique information, as all of us have a different array of knowledge and perspective about the world. Therefore, when you aggregate the observations of a group of people, they will collectively possess a greater and more diverse reservoir of knowledge than any single member of the group.

The readers of Football Perspective are an insightful bunch with areas of expertise spanning the entire football spectrum; we are the perfect group for crowd-sourcing these sorts of age-old football questions. And given how successful the last experiment was, there’s no reason not to look at other positions. If you’d like to participate in this experiment, there are just a few guidelines to follow:

1. Create a list of the top 20 running backs of all time, in order, using any criteria you believe to be important. I encourage readers to be bold in your selections – don’t worry about what others may think.

2. Commentary is not necessary, but most definitely welcome. In particular, I’d enjoy seeing a short blurb explaining the criteria you based your selections on.

3. Please compile your rankings BEFORE reading anyone else’s. Crowdsourcing works best when each source is as independent as possible.

4. Please DO NOT use multiple screen names to vote more than once.

The deadline to cast your ballot is midnight on Thursday the 26th, then analyze the results in a follow-up article. A first place vote is worth 20 points, second place 19 points, and so on. Let the process begin!

{ 154 comments }
Bettis ran for only five yards on this play

Bettis ran for only five yards on this play

Congrats to the newest members of the Pro Football Hall of Fame. You can read my thoughts on the candidates here; while this class is not exactly the one I would have picked, Jerome Bettis, Tim Brown, Charles Haley, Junior Seau, Will Shields, and Mick Tingelhoff were all outstanding players. In addition, Bill Polian and Ron Wolf were the inaugural selections for the Contributors spots, so congratulations to them as well.

The Bettis candidacy is an interesting one. Many want to focus on his underwhelming 3.9 career yards per carry average. But as I have written many times, I am not keen on putting much weight on YPC as a statistic. Brian Burke has also written about how coaches don’t view running backs in terms of yards per carry, but rather by success rate (which correlates poorly with yards per carry). Danny Tuccitto calls yards per carry essentially “a bunkum stat.” [continue reading…]

{ 17 comments }

Alfred Morris and Production Through Three Years

The 2012 OROY and Washington's most productive player from the 2012 draft

The 2012 OROY and Washington’s most productive player from the 2012 draft

Alfred Morris was just a sixth round pick. During his rookie season, he happened to play alongside the eventual offensive rookie of the year. Since then, RG3 has continued to dominate headlines, while Morris continues to plug away without garnering a fraction of the attention. For example, did you know that Morris has now hit the 1,000-yard mark for the third straight season? He’s also rushed for 7 touchdowns each year in his career.

Do you know how many other players have rushed for 1,000 yards and seven scores in each of their first three seasons? Seven: Earl Campbell, Ottis Anderson, Eric Dickerson, Barry Sanders, LaDainian Tomlinson, Adrian Peterson, and Chris Johnson. That’s five Hall of Fame caliber running backs and Anderson/Johnson, a duo that has combined for nearly 19,000 rushing yards and still counting.

Morris has rushed for 3,919 yards and 27 touchdowns in his career, with one game left in his third season. In addition to the six of the seven players above (Anderson had 26 rushing touchdowns through three years), only five other players have hit those marks through three years: Clinton Portis, Terrell Davis, Emmitt Smith, Edgerrin James, and Walter Payton.

In other words, Morris’ production through three years puts him in in the inner circle of elite running back performance. Of the thirteen running backs mentioned in this post, ten were first round picks. The eleventh was Portis, a player who fell to the second round solely due to concerns about his size and durability. None of the other players were drafted in the second, third, fourth, or fifth rounds; the other two were Morris and Davis, both six round picks under Mike Shanahan. [continue reading…]

{ 3 comments }

Checkdowns: YPC Differential Leaders

Wilson's rushing prowess has powered Seattle this year

Wilson's rushing prowess has powered Seattle this year

[End of Year update: Seattle finished the season with 2,762 rushing yards on 525 carries, good enough for a 5.26 YPC average. The Seahawks allowed just 1,304 yards on 380 carries, which translates to a 3.43 YPC average. Therefore, the 2014 Seahawks averaged 1.83 more yards per carry than they allowed; that’s the second best differential since the merger, and just a behind the ’63 Browns for the third best since 1950.]

Last season, the Seahawks posted the best ANY/A differential in the NFL. In fact, it was the 9th best ANY/A differential of any team since the merger, and Seattle wound up becoming the 5th team in the top ten in that statistic to win the Super Bowl.

You heard all about Richard Sherman and Earl Thomas and the great Seahawks pass defense, and it’s not as though Russell Wilson was flying under the radar, either. But this year, the Seahawks are recording even more extreme statistics in a different differential stat.

Yards per carry is super overrated: Danny Tuccitto did a nice job revealing that just a couple of days ago. But hey, I love trivia, so let’s move on.

Seattle ranks 1st in the NFL in yards per carry (5.08). Marshawn Lynch is at 4.2 YPC on 132 carries, but it’s Wilson’s 7.6 yards per carry average on 52 carries that sets the Seahawks apart. But the defense — so unstoppable against the pass in 2013 — ranks 1st in this metric, too. Seattle is allowing just 3.19 yards per carry this year; if it holds, that would be the best mark since the 2010 Steelers.

Combine, though, is where the Seahawks really stand out. Seattle has a 1.89 YPC differential, defined as YPC for the offense minus YPC allowed for the defense. How good is that? If it holds, it would be the 2nd best mark since 1950: [continue reading…]

{ 3 comments }

Antone Smith and Long Touchdowns

Allow me to present to you Atlanta running back Antone Smith’s 2014 play-by-play log in its entirety:

Week 1 vs. NO
QtrTimeScoreDown/DistYardlineDescription
211:400 - 132nd-and-10own 20rushed for 2 yards
209:160 - 131st-and-10opp 31rushed for 5 yards
300:3317 - 202nd-and-9own 46caught pass for 54 yards TOUCHDOWN
Week 2 vs. CIN
QtrTimeScoreDown/DistYardlineDescription
214:49417011st-and-10own 28caught pass for 4 yards
201:14417083rd-and-4own 38target of incomplete pass
410:23417221st-and-10opp 35caught pass for 15 yards (first down)
400:54419361st-and-10own 41target of incomplete pass
Week 3 vs. TB
QtrTimeScoreDown/DistYardlineDescription
104:21367081st-and-9opp 9rushed for 4 yards
209:0028 - 01st-and-10opp 11rushed for 10 yards (first down)
302:3649 - 01st-and-10opp 36rushed for -2 yards
301:5949 - 02nd-and-12opp 38rushed for 38 yards TOUCHDOWN
Week 4 vs. MIN
QtrTimeScoreDown/DistYardlineDescription
105:230 - 73rd-and-2opp 29rushed for 2 yards (first down)
104:470 - 71st-and-10opp 27rushed for 3 yards
214:55418342nd-and-10own 31rushed for 9 yards
301:4021 - 271st-and-10opp 48rushed for 48 yards TOUCHDOWN
Week 5 vs. NYG
QtrTimeScoreDown/DistYardlineDescription
103:420 - 71st-and-10opp 23rushed for 2 yards
214:59418273rd-and-4opp 4caught pass for 1 yards
212:33419191st-and-10own 25caught pass for 8 yards
305:5113 - 103rd-and-4own 26caught pass for 74 yards TOUCHDOWN

That’s four long touchdowns on 17 offensive touches.  On his four scoring plays, Smith has gained an incredible 214 yards.  That’s the most in the NFL so far, with Steve Smith (162 yards) and Jordy Nelson (160) rounding out the top three.  Perhaps even more incredible is that Smith has gained 214 yards on scoring plays despite gaining only 63 yards on non-scoring plays.  Here’s a chart I tweeted a couple of days ago, showing yards gained on TDs on the X-axis and yards gained on all other plays on the Y-axis: [continue reading…]

{ 5 comments }
Next Posts Previous Posts