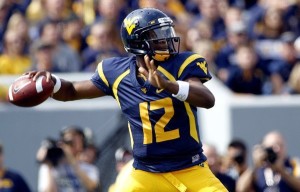
In this year’s draft, Tyler Bray is the neophyte, as he’ll be 21 years and 8 months old at the start of the season. He’s just weeks older than Matt Stafford and Josh Freeman were this time four years ago. It also means he’s 10 months younger than Geno Smith, the second youngest of the top prospects. On the other hand, Tyler Wilson will be 24 when the season starters, Landry Jones just turned 24, and Jordan “did you know Aaron is my brother” Rodgers will be 25 on August 30th. Do NFL teams generally ignore age — i.e., fail to measure younger quarterbacks against a lower bar? Or perhaps do they overemphasize age, thinking a young player has such high upside and can be taught anything that they ignore red flags? That’s what this post seeks to answer.
[continue reading…]
There are many differences between college and professional football, but many of the same stats still matter. For quarterbacks, Adjusted Net Yards per Attempt is still the king of the basic stats [1]For the uninitiated, ANY/A is calculated by starting with passing yards per attempt, adding 20 yards for each touchdown and subtracting 45 yards for each interception, and subtracting sack yards lost … Continue reading, and it is arguably even more important in college where teams play at varying different paces.
There’s a small problem, however, if you want to calculate ANY/A at the college level: the NCAA counts sacks as rush attempts and sack yards lost as negative rushing yards. I manually overrode [2]Unfortunately, some estimation was involved. The player game logs at cfbstats do not identify quarterback sacks, but the team game logs do. So for each quarterback, we know how many passes he threw … Continue reading that decision in my data set, so going forward, all rushing and passing data will include sack data in the preferred manner (keep this in mind when you compare the statistics I present to the “official” ones).
[continue reading…]
References
| ↑1 | For the uninitiated, ANY/A is calculated by starting with passing yards per attempt, adding 20 yards for each touchdown and subtracting 45 yards for each interception, and subtracting sack yards lost from the numerator and adding sacks to the denominator. |
|---|---|
| ↑2 | Unfortunately, some estimation was involved. The player game logs at cfbstats do not identify quarterback sacks, but the team game logs do. So for each quarterback, we know how many passes he threw in the game and how many times his team was sacked. For quarterbacks who threw 100% of their team’s passes in a game, this is easy. However, for quarterbacks who threw fewer than 100% of their team’s passes, they were assigned a pro-rata number of their team’s sacks. |


