by Chase Stuart
on November 4, 2014
This week at the New York Times, I look at the surprisingly successful AFC North.
At the midway mark of the season, the A.F.C. North is the best division in football. By the end of the year, it may be viewed as one of the strongest divisions in N.F.L. history.
The Cleveland Browns, the Cincinnati Bengals, the Pittsburgh Steelers and the Baltimore Ravens are a combined 14-5-1 when not facing one another, which includes a five-game winning streak (no A.F.C. North team has lost an interdivision game since Oct. 19). That equates to a 72.5 winning percentage; the next-best record in interdivision games belongs to the N.F.C. West, but at 15-9 (62.5) that division is a full 10 percentage points behind the A.F.C. North. Since 1970, only five divisions have won more than 70 percent of interdivision games over the course of a full season.
The numbers may overstate the case because the division has benefited from some fortuitous scheduling. Teams in every division play all four teams from two other divisions each year. This year, the A.F.C. North was lucky to land the A.F.C. South and the N.F.C. South, the two worst divisions in football in 2014. Still, all four teams have winning records. In fact, the 2014 A.F.C. North is only the third division in N.F.L. history in which all of its teams posted a winning record after nine weeks, joining the 2008 N.F.C. East and the 1935 N.F.L. West. This sort of success is close to unprecedented, especially for a division that was an afterthought to many only two months ago. So what has been the secret behind the success of each team in the division?
You can read the full article here.
Tagged as:
AFC North,
NYT
{ }
by Chase Stuart
on November 4, 2014

The braintrust.
The Jets passing offense being bad does not qualify for news. However, the Jets passing offense and passing defense combining for historically inept numbers? Sure, that qualifies.
New York has thrown 8 touchdown passes this year against 11 interceptions. That’s a -3 differential which is pretty bad. Only two other teams have negative ratios this year: the Jaguars, also at -3 (11 TDs, 14 INTs), and the Vikings at -5 (6/11). But the Jets pass defense has allowed 24 touchdowns while forcing just 1… ahem, ONE… interception. That +23 ratio for opposing quarterbacks is better than any offense this year (the Broncos are at +19 (24/5), and the Patriots and Steelers are both at +20 with matching 23/3 TD/INT ratios).
From the perspective of the Jets defense, though, that +23 reverses to a -23. Add to that the -3 from the offensive side of the ball, and New York’s combined TD/INT ratio from both units is an incredibly bad -26.
How bad? It’s tied for the 2nd worst number through 9 games since 1970, just narrowly behind the 1975 Cleveland Browns. Those Browns began the year with 3 passing touchdowns and 17 interceptions through nine games. Okay, that was even bad for the dead ball era, but what about the defense? Cleveland allowed 19 passing touchdowns while forcing just six interceptions during that stretch! Those numbers led to an 0-9 start under first-year head coach Forrest Gregg.
The table below shows all teams to start the season with at least a -20 ratio in this statistic I just made up. Here’s how to read the line from the famous 1944 Card/Pitt combination, forced together due to World War II. Through nine games, that team threw 8 touchdowns and 40 interceptions (-32), while allowing 19 passing touchdowns and intercepting just 15 passes (-4), for a total score of -36. [continue reading…]
Tagged as:
Jets,
Rex Ryan
{ }
by Chase Stuart
on November 3, 2014
Adam Steele is back for his third guest post in his Marginal YAC series.
In my two previous two posts, I introduced Marginal YAC and Marginal Air Yards. Today, I’m posting the career mYAC and mAir for the 96 quarterbacks with at least 1,000 pass attempts from 1992-2013. There’s a lot of data here, so I’ll let the readers do most of the commentary.
Here is a table of career Marginal YAC. The “Per 300” column is the rate of mYAC per 300 completions, or roughly equivalent to one full season. And on a “per season” basis, no quarterback benefited more from YAC than Steve Young, who also had four top-40 seasons. [continue reading…]
Tagged as:
Adam Steele,
Air Yards,
Guest Posts,
YAC
{ }
by Chase Stuart
on November 2, 2014

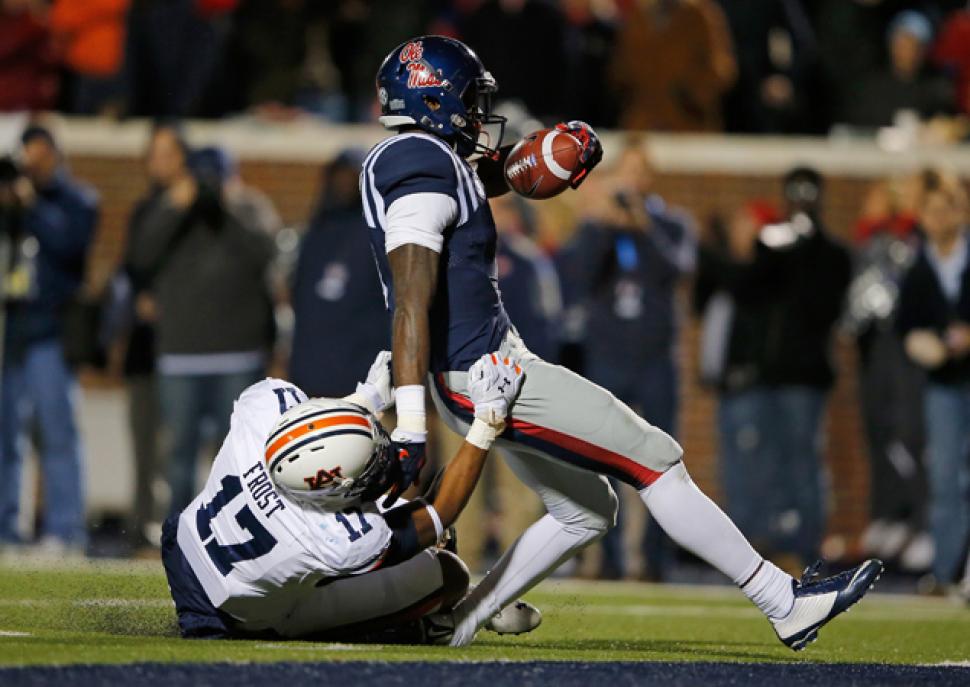
Heartbreaking.
From one perspective, Saturday brought one of the cruelest moments in years. In a must-win game for Ole Miss, the Rebels played a back-and-forth contest with perhaps the best team in college football. Trailing 35-31,
Bo Wallace and the offense took over on the Mississippi 48-yard line with just over three minutes remaining. The Rebels moved quickly down the field, and on short pass to
Laquon Treadwell appeared to turn into the go-ahead score. Just as Treadwell crossed the goal line, he was tackled from behind, suffering an injury that you knew was bad as soon as it happened. As it turned out, Treadwell broke his leg, and then the insult came. Upon review of the score, while Treadwell crossed the goal line, the ball did not, and he fumbled as he was taken down. Auburn recovered in the end zone, and the Tigers would prevail.
[continue reading…]
Tagged as:
NCAA SRS
{ }
by Chase Stuart
on November 1, 2014
In 2013, Kenny Stills saw his average reception come 13.9 yards past the line of scrimmage, the farthest amount of yards in the air per catch of any receiver in the NFL. He’s the deep threat in the Saints offense, and he’s being utilized in a similar way this year, with his average catch from Drew Brees coming 12.8 yards downfield. When it comes to the top deep threats in the NFL, Stills and Arizona’s Michael Floyd stand out. Cardinals head coach Bruce Arians loves the vertical passing game, and Floyd has been the perfect weapon: he averaged a healthy 11.7 air yards per catch in 2013, but that number has spiked to 16.5 in 2014!
But not every player’s role is so static. In 2013, the Bengals used A.J. Green (average reception 10.5 yards in the air) and Marvin Jones (9.6) as deep threats, while Tyler Eifert (5.6), Mohamed Sanu (4.3), and Jermaine Gresham (4.2) were used on short/intermediate routes. But Jones will miss all of 2014 due to a foot injury, while Green has been limited to just 43% of the Bengals offensive snaps to date (and he was playing injured for a percentage of those plays, too). As a result, Sanu’s air yards per catch has jumped from 4.3 to 8.4, and his yards per reception has increased from 9.7 to 15.2.
Similarly, Emmanuel Sanders has seen his role change in 2014, as a result of switching teams. Last year, in Pittsburgh, Todd Haley’s offense called for lots of short routes for his wide receivers, but even among the wide receiver group, Sanders (6.3) had the shortest air yards per catch. Eric Decker, meanwhile, had his average reception come 10.8 yards downfield while playing with Peyton Manning. This year, Sanders — taking over Decker’s role — has averaged 10.3 yards in the air per catch.
The graph below shows wide receiver air yards in 2014 (on the X-axis) and 2013 (on the Y-axis): [continue reading…]
Tagged as:
Air Yards
{ }