≡ Menu

In this series, I will be looking at the history of coaches, quarterbacks, rushers, and receivers for all 32 franchises. For coaches and quarterbacks, I will be looking at how much their franchise’s career records (regular season only) would change if we removed the games with that person. For rushers and receivers, I will note how many times that player was the team’s leading rusher/receiver over the course of their time with that franchise (regular plus postseason).

Previous Teams:

Dolphins
Cowboys
Bills
Eagles

The Jets have not had a storied history when it comes to head coaches. If Adam Gase wins his first game, he will be just the third head coach in Jets history with more wins than losses. Bill Parcells has the best winning percentage in franchise history, and Weeb Ewbank — who led the team to its only Super Bowl — is probably the best head coach in its history. But other than those two Hall of Famers, the pickings are slim in Jets history… and even Ewbank had a losing record! Meanwhile, Rich Kotite appropriately stands out as the worst coach in franchise history. But #2 is Todd Bowles, who went 24-40 with New York over the last four years. [continue reading…]

{ 0 comments }

In this series, I will be looking at the history of coaches, quarterbacks, rushers, and receivers for all 32 franchises. For coaches and quarterbacks, I will be looking at how much their franchise’s career records (regular season only) would change if we removed the games with that person. For rushers and receivers, I will note how many times that player was the team’s leading rusher/receiver over the course of their time with that franchise (regular plus postseason).

Previous Teams:

Dolphins
Cowboys
Bills

Over the course of their franchise, Philadelphia has won 49% of its games. But if you removed the games coached by former NFL commissioner Bert Bell, the Eagles actually are above .500 for the rest of their history! The best coach in Philadelphia history is Andy Reid, even if he never won a Super Bowl. He won 58.3% of his games with the team, while all other Eagles head coaches have won just 46.9% of games. Doug Pederson is off to a good start, and so far has a slightly better winning percentage with the Eagles, but he’s got a long way to go before he passes Reid on this list.

Ovr RkCoachGWLTHC Win %FrGFrWFLFrTFr W%Win% w/o HCDiff
35Andy Reid2241309310.5831204577601260.490.4692.1%
58Greasy Neale111634350.591204577601260.490.481%
98Doug Pederson48291900.6041204577601260.490.4850.5%
104Buddy Ryan79433510.5511204577601260.490.4860.4%
105Dick Vermeil101544700.5351204577601260.490.4860.4%
106Rich Kotite64362800.5631204577601260.490.4860.4%
127Jim Trimble48252030.5521204577601260.490.4870.3%
128Chip Kelly47262100.5531204577601260.490.4870.3%
143Buck Shaw36191610.5421204577601260.490.4880.2%
156Bo McMillin220011204577601260.490.4890.1%
174Pat Shurmur110011204577601260.490.490%
175Fred Bruney110011204577601260.490.490%
267Ray Rhodes64293410.4611204577601260.490.492-0.2%
297Wayne Millner102800.21204577601260.490.492-0.2%
314Ed Khayat2581520.361204577601260.490.493-0.3%
342Nick Skorich42152430.3931204577601260.490.494-0.4%
343Mike McCormack42162510.3931204577601260.490.494-0.4%
348Hugh Devore2471610.3131204577601260.490.494-0.4%
375Marion Campbell47172910.3721204577601260.490.495-0.5%
377Lud Wray3192110.3061204577601260.490.495-0.5%
385Joe Kuharich70284110.4071204577601260.490.495-0.5%
403Jerry Williams3172220.2581204577601260.490.496-0.6%
497Bert Bell56104420.1961204577601260.490.504-1.4%

Likewise, when it comes to winning regular season games, no quarterback to wear the Eagles uniform could match Donovan McNabb’s success. For quarterbacks in this series, I am only going to go back to 1950. That’s because we don’t have quarterback starts data prior to 1950. That didn’t matter for the first three teams, but it does matter here for the Eagles. Since 1950, Philadelphia has a nearly perfectly average record of 501-499-18. With McNabb as the starter, Philadelphia won 65.1% of their games; overall, the team has won 50.1% of games since ’50, and without McNabb, that number drops to 47.7%.

Ovr RkQBGWLTQB Win %FrGFrWFLFrTFr W%Win% w/o QBDiff
20Donovan McNabb142924910.6511018501499180.5010.4772.4%
57Randall Cunningham107634310.5931018501499180.5010.4901.1%
105Nick Foles32211100.6561018501499180.5010.4960.5%
147Carson Wentz40231700.5751018501499180.5010.4980.3%
148Rodney Peete2415900.6251018501499180.5010.4980.3%
149Jim McMahon129300.7501018501499180.5010.4980.3%
194Jeff Garcia65100.8331018501499180.5010.4990.2%
225Norm Van Brocklin36191610.5421018501499180.5010.4990.1%
227Jack Concannon33001.0001018501499180.5010.5000.1%
260Ron Jaworski137696710.5071018501499180.5010.5000.1%
338A.J. Feeley74300.5711018501499180.5010.5000%
426Matt Cavanaugh21100.5001018501499180.5010.5010%
427Jeff Kemp21100.5001018501499180.5010.5010%
428Tommy Thompson126600.5001018501499180.5010.5010%
430Sam Bradford147700.5001018501499180.5010.5010%
432Ty Detmer189900.5001018501499180.5010.5010%
440Michael Vick40202000.5001018501499180.5010.5010%
537John Huarte10100.0001018501499180.5010.5010%
538George Mira10100.0001018501499180.5010.5010%
539Joe Pisarcik31200.3331018501499180.5010.5010%
540Vince Young31200.3331018501499180.5010.5010%
564Kevin Kolb73400.4291018501499180.5010.501-0.1%
719Brad Goebel20200.0001018501499180.5010.502-0.1%
724Rick Arrington51310.3001018501499180.5010.502-0.1%
728Koy Detmer83500.3751018501499180.5010.502-0.1%
729Bubby Brister104600.4001018501499180.5010.502-0.1%
730Mark Sanchez104600.4001018501499180.5010.502-0.1%
740Pete Liske177910.4411018501499180.5010.502-0.1%
741Mike Boryla1881000.4441018501499180.5010.502-0.1%
832Scott Tinsley30300.0001018501499180.5010.502-0.1%
836Mike McMahon72500.2861018501499180.5010.502-0.1%
870Sonny Jurgensen39172020.4621018501499180.5010.503-0.2%
929Ken O'Brien40400.0001018501499180.5010.503-0.2%
987Doug Pederson92700.2221018501499180.5010.503-0.2%
1001Adrian Burk37152020.4321018501499180.5010.504-0.3%
1004Bobby Thomason43182320.4421018501499180.5010.504-0.3%
1035Bobby Hoying133910.2691018501499180.5010.504-0.3%
1064John Reaves70700.0001018501499180.5010.504-0.3%
1065King Hill1851210.3061018501499180.5010.505-0.4%
1159Roman Gabriel38122510.3291018501499180.5010.508-0.7%
1209Norm Snead81285030.3641018501499180.5010.513-1.2%

The Eagles have had a lot of very good running backs in their history, including some borderline Hall of Famers. Ricky Watters led the team in rushing in 88% of his games, Brian Westbrook was an all-purpose threat who led the team in rushing 81 times, and LeSean McCoy is a YPC star who led the Eagles in rushing in more games than Watters and more frequently than Westbrook. But it was late ’70s/early ’80s star Wilbert Montgomery who has led the team in rushing most often. Oh, and you might notice a certain quarterback led the Eagles in rushing 37 times, too.

RusherFirst YrLast YrLeading RusherTotal Games%
Wilbert Montgomery197719848210777%
Brian Westbrook200220098111869%
LeSean McCoy20092014719376%
Duce Staley199720035210550%
Timmy Brown19601967459746%
Ricky Watters19951997455188%
Tom Woodeshick196319714311139%
Randall Cunningham198519953712929%
Tom Sullivan19721977368045%
Clarence Peaks19571963278333%
Billy Ray Barnes19571961266143%
Herschel Walker19921994255050%
Keith Byars198619922311021%
Donovan McNabb199920092216413%
Heath Sherman19891993188023%
Correll Buckhalter20012008178420%
Anthony Toney19861990177024%
Steve Van Buren19441951148716%
Earnest Jackson19851985131681%
Charlie Garner19941998136919%
Earl Gros19641966124129%
Cyril Pinder19681970124229%
Mike Hogan19761980124229%
Jim Parmer19481956128913%
Jay Ajayi20172018111479%
Po James19721975114922%
Wendell Smallwood20162018113928%
Ryan Mathews20152016102638%

What about the leaders in receiving in Eagles history? Terrell Owens did so in 68% of his games, but he only suited up with the Eagles 22 times. Hall of Famer Pete Pihos did so in 37 games while being an outstanding defensive player, but it’s 6’8 Harold Carmichael who easily paces the field here.

ReceiverFirst YrLast YrLeading ReceiverTotal Games%
Harold Carmichael197119838418745%
Pete Retzlaff195619664813336%
Mike Quick198219904710246%
Pete Pihos194719553711133%
DeSean Jackson20082013369339%
Fred Barnett19901995338638%
Bobby Walston195119623114921%
Ben Hawkins196619733010229%
Tommy McDonald19571963268929%
Zach Ertz20132018269727%
Jeremy Maclin20092014257732%
Calvin Williams19901996259925%
Harold Jackson19691972235641%
Irving Fryar19961998214943%
Charlie Smith197419812112317%
Todd Pinkston20002004209022%
Jordan Matthews20142018196231%
Keith Jackson19881991186329%
Duce Staley199720031810517%
Timmy Brown19601967179718%
Brent Celek20072017161849%
Terrell Owens20042005152268%
Reggie Brown20052009157719%
Keith Krepfle19751981159915%
Keith Byars198619921511014%
Brian Westbrook200220091411812%
James Thrash20012003125422%
Jason Avant200620131212410%
Alshon Jeffery20172018113432%
Gary Ballman19671972116617%
John Spagnola19791987101179%

That’s it for the Philadelphia version of this series. Please leave your thoughts in the comments.

{ 0 comments }

All Time AFC East Teams, by Bryan Frye

Friend of the program Bryan Frye is back for another guest series. As regular readers know, Bryan operates his own fantastic site, http://www.thegridfe.com. You can view all of Bryan’s guest posts here, and follow him on twitter @LaverneusDingle.


Smith is an obvious choice for any All AFC-East team

With the NFL’s centennial celebration coming soon, I have been thinking much about “all-time,” “best of,” and “greatest” lists. This time, that list involves an eight part series on each division’s all-time teams. As I stated before, I will be treating all teams as if they are in their current divisions (so Kenny Easley would be eligible for the NFC West squad, not the AFC West to which the Seahawks belonged when he played). Today, we’ll be looking at Tom Brady’s division.

A quick reminder of the series rules before jumping into the content:

  1. I write everything before my painkiller prescription runs out (although Chase will publish this later),
  2. I write it completely off the top of my head and don’t do any research,
  3. I don’t have to proofread this when I finish it, and
  4. Chase doesn’t edit my nonsense out of the article (so parts may read like a Raider Joe rant).

Roster construction is as follows: 1 QB, 2 RB, 3 WR, 2 TE, 2 T, 2 G, 1 C, 2 DE, 2 DT, 2 OLB, 2 MLB/ILB, 3 CB, 2 S, 1 K, 1 P, 1 HC.

Without further ado, here’s the AFC East

Offense

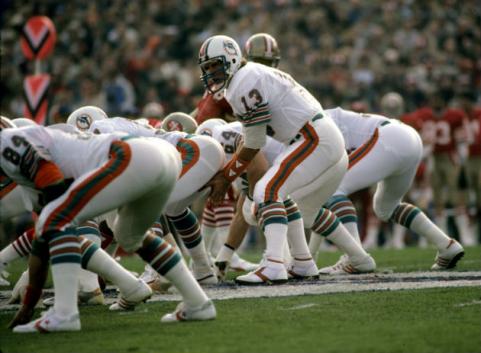
Quarterback – Tom Brady

Dan Marino may have been the most natural thrower I have ever seen, but this spot was never in doubt. If you like rings, Brady has more than any QB. If you like stats, he has some of the best ever. If you just likes guys with handsome faces, well by golly he has that too.

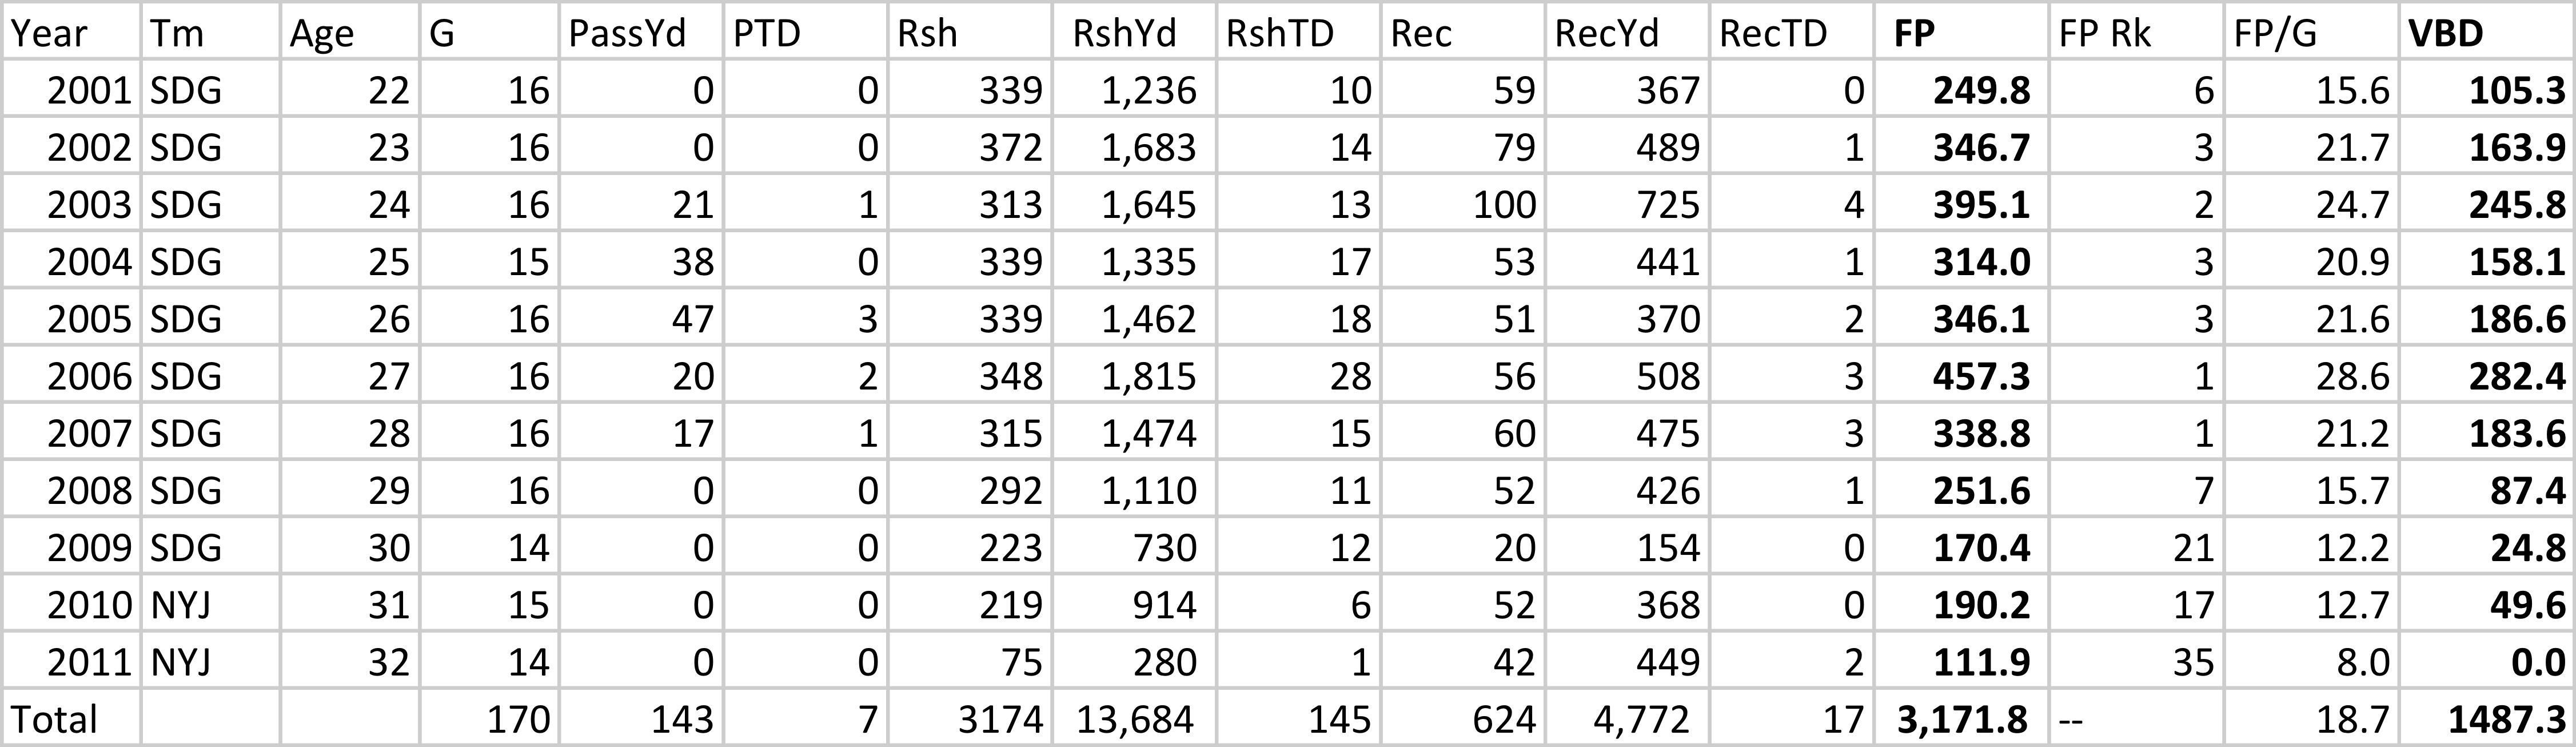
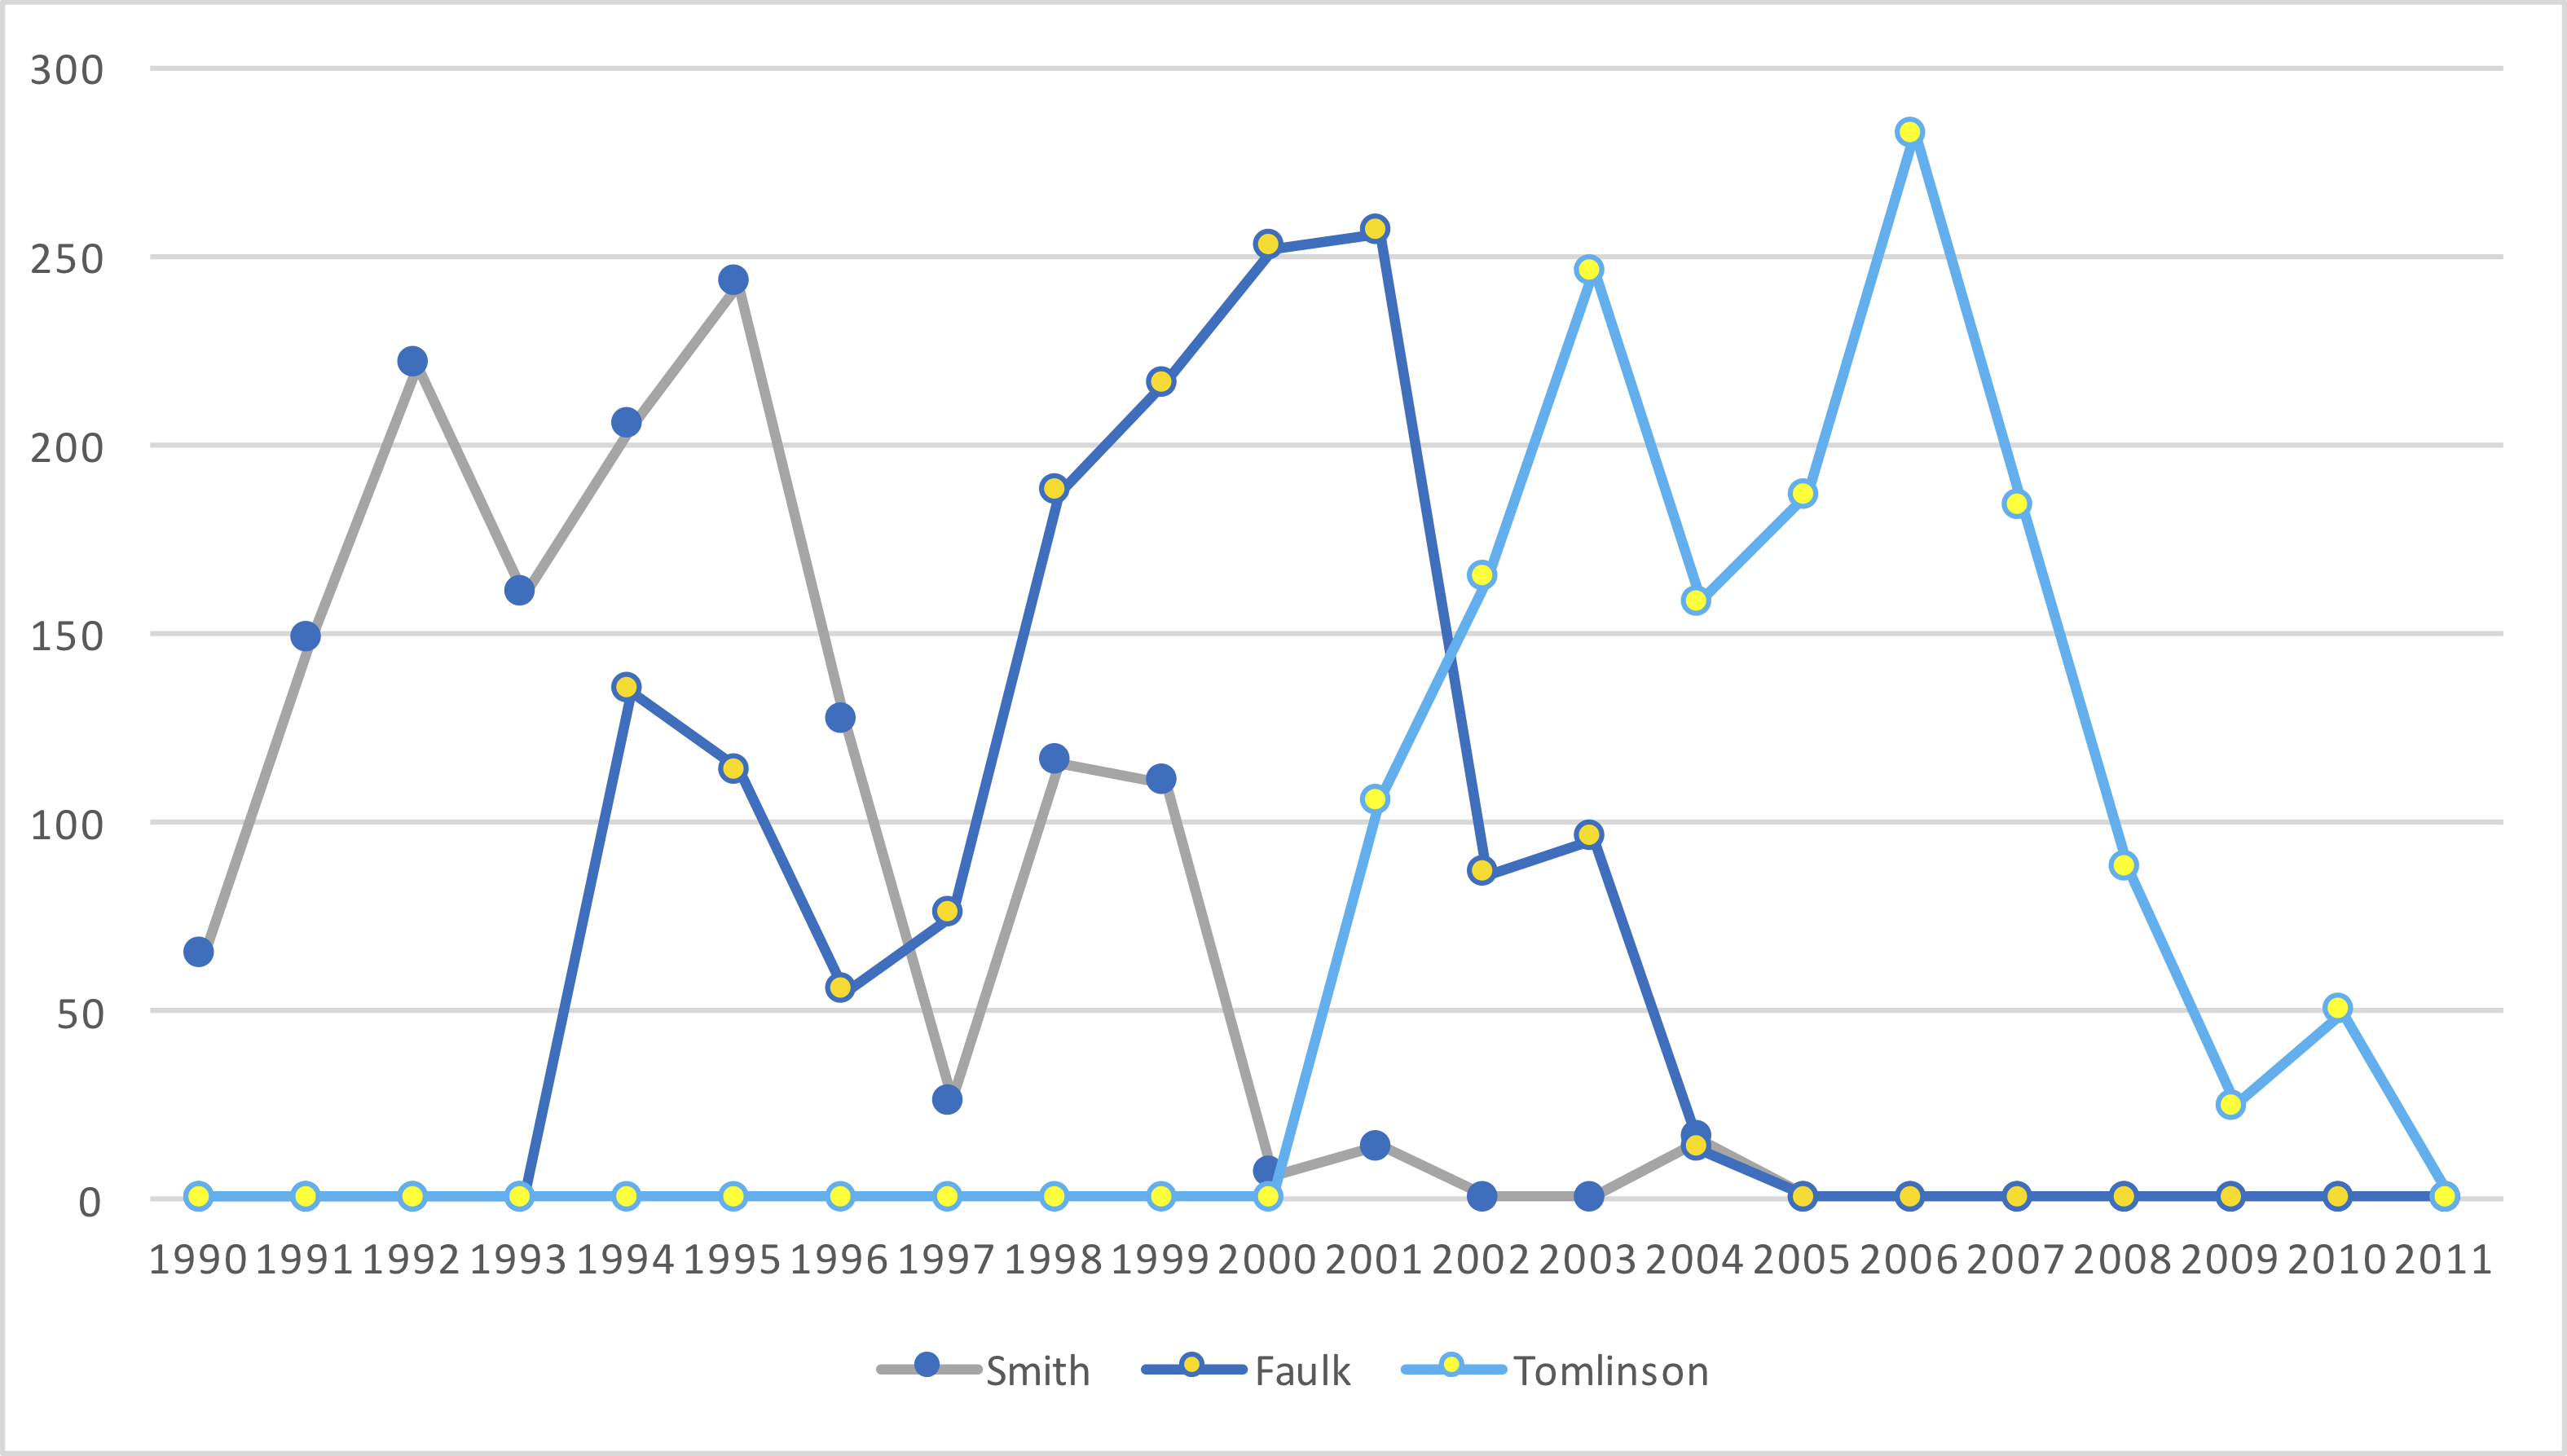
Running Backs – O.J. Simpson and Curtis Martin

When Simpson became the first back to break the 2,000 yard mark, he set a record for rushing yards per game that still stands. And that probably wasn’t even his best season! Martin didn’t have the highs of some of the inner circle guys, but he was a consistent producer and a respected teammate.

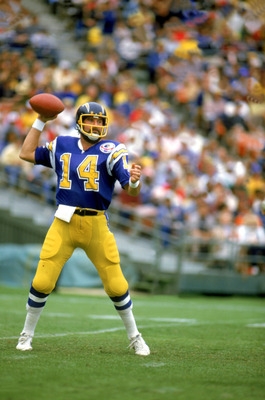
Wide Receivers – Don Maynard, Paul Warfield, and Andre Reed

Maynard is the second best AFL wideout and did amazing things with DESERVING HALL OF FAMER Joe Namath throwing him the ball. Warfield was tough to place because he split his time between Miami and Cleveland, spending much more time in the Midwest. I opted to put him here because his time with the Dolphins was good enough to merit the spot. He’s the greatest deep threat in history and an underrated blocker. Reed put up solid numbers in suboptimal weather, and his work after the catch is the stuff of legend.

Tight Ends – Rob Gronkowski and Russ Francis

Gronk is the greatest tight end of all time, in my opinion. Every other great at the position had at least one glaring weakness. Gronk’s only weakness was his health. Francis is like a proto version of Gronk. He didn’t put up gaudy receiving numbers, but he was nonetheless an incredible receiver and arguably an even better athletic specimen. Like Gronk, he was also excelled as a blocker.

Tackles – Leon Gray and Marvin Powell

Gray was a hulking player who could manhandle defenders, and the brevity of his peak may be the only thing keeping him from having a bronze bust in an Ohio museum. Powell was an intelligent player who succeeded despite lacking the aggression of someone like Boomer Brown.

Guards – John Hannah and Joe DeLamielleure

Hannah may be the greatest guard of all time, and he is almost certainly the best run blocker. DeLamielleure possessed sound technique and rarely got himself out of position. I’ve heard some posit that he only made Pro Bowl because he got to block for O.J., but I don’t believe those people actually watched him play.

Center – Dwight Stephenson

Quite simply, Stephenson is the best I have even seen at the center position. He was far more athletic than anyone else, and despite his size was incredibly powerful. Opponents likened taking a hand shot from Stephenson to getting electrocuted.

Defense

Defensive End – Bruce Smith and Jason Taylor

Smith holds the NFL’s career sack record and racked up outlandish numbers without sacrificing run support. Taylor was a gifted athlete who made good use of his long arms to keep free from blockers.

Defensive Tackle – Tom Sestak and Joe Klecko

Sestak could play just about any technique across the line (aside, perhaps, from wide 9) with equal success getting after passers. Klecko is similar, having earned honors as an end and a nose tackle. Honorable mentions to Fred Smerlas and Vince Wilfork, who are two of the best nose tackles I’ve seen.

Outside Linebacker – Andre Tippett and Cornelius Bennett

Lawrence Taylor may be the only reason Tippett isn’t a household name. Known as a rushbacker, he could also force the edge against the run and even cover tight ends with success. Bennett was the epitome of versatility, able to make plays at all levels of the field.

Middle/Inside Linebacker – Nick Buoniconti and Zach Thomas

Buoniconti and Thomas were both undersized backers who tackled well and excelled in coverage. Thomas was a bit better at disengaging from blockers.

Cornerback – Darrelle Revis, Ty Law, and Asante Samuel

Revis and Law were classic, shutdown cornerbacks who you could put on a number one receiver and not worry about for the rest of the game. Samuel was a gambler who is unfortunately remembered just as much for his misses as he is for his numerous big plays.

Safety – Rodney Harrison and Dick Anderson

Most of Harrison’s prime came with the Chargers, but he remained an effective and important member of several successful Patriots squads. The infamous David Tyree play notwithstanding, he was typically consistent in coverage and as an enforcer. Choosing between Anderson and Jake Scott was no mean feat, but I opted for Anderson because I liked his penchant for turning defense into offense.

Special Teams and Head Coach

Kicker – Adam Vinatieri

If we want to get all analytical and look at metrics like points produced over expectation, Garo Yepremian would probably take this spot. But let’s take a moment to pretend we’re humans and not androids and consider that narrative actually does matter. I don’t care if he is statistically the best. No kicker has built a stronger legacy than Vinatieri.

Punter – Reggie Roby

Roby combined the big leg fans love to see with the precision kicking purists look for. Also, I like alliteration.

Head Coach – Bill Belichick

With respect to Don Shula’s 347 victories and absurd 172 games over .500, Belichick is my guy. To succeed consistently in the salary cap era while only holding on to one star player for a significant period of time is incredible. Despite the NFL’s best efforts at increasing parity, Belichick (with Brady) has presided over the greatest dynasty in NFL history.

Parting Shot

We’re done with part two. Brace yourselves for the AFC West article, in which I cry deeply over the sheer number of legendary tight ends I have to leave off my list.

{ 0 comments }

In this series, I will be looking at the history of coaches, quarterbacks, rushers, and receivers for all 32 franchises. For coaches and quarterbacks, I will be looking at how much their franchise’s career records (regular season only) would change if we removed the games with that person. For rushers and receivers, I will note how many times that player was the team’s leading rusher/receiver over the course of their time with that franchise (regular plus postseason).

Previous Teams:

Dolphins
Cowboys

The Buffalo Bills have had a lot of disappointing coaches in their history — I’m looking at you, Harvey Johnson — and only a few good ones. Just four have winning records, although that’s not the worst by AFC East standards. In many divisions, Marv Levy would be considered a strong candidate for the best coach in division history. In the AFC East, he’s relegated to third. But when it comes to Bills coaches, nobody can match his record: [continue reading…]

{ 0 comments }

In this series, I will be looking at the history of coaches, quarterbacks, rushers, and receivers for all 32 franchises. For coaches and quarterbacks, I will be looking at how much their franchise’s career records (regular season only) would change if we removed the games with that person. For rushers and receivers, I will note how many times that player was the team’s leading rusher/receiver over the course of their time with that franchise (regular plus postseason).

Previous Teams:

Dolphins

For the Cowboys, it’s not hard to figure out who is the best coach in team history. Tom Landry was so good for so long, that he’s really inflated the team’s overall mark. Consider Jason Garrett, who has gone a very respectable 77-59 as head coach of the Cowboys. That’s a 0.566 winning percentage, but that’s actually lower than the team’s overall winning percentage of 0.573. In other words, Dallas has a better career record in games without Garrett than with Garrett, which is a harbinger of things to come in today’s post. Meanwhile, Dave Campo is the only coach in Dallas history who had a losing record. [continue reading…]

{ 0 comments }

This offseason, I’m going to look at team histories in a different way than such data is usually presented. I’ll be looking at coach and quarterback records, along with rushing and receiving milestones. Let’s begin with coaches, and start with the Miami Dolphins.

Don Shula is one of the best coaches in history. He posted a 257-133-2 record in 392 regular season games, a 0.658 winning percentage. Now consider that over the course of its entire history, Miami has played 816 games, producing a 452-360-4 record, a 0.556 winning percentage.

In this series, I will look at how each coach has changed their franchise’s career winning percentages. Here’s what I mean, using Miami as an example. We know that the Dolphins have a 0.556 winning percentage. But in games not coached by Shula, Miami only has a 0.462 winning percentage. That’s a decline of 9.4%! Shula coached nearly half of all Miami games and has well over half of the franchise’s wins. If you perform this calculation for every coach for every team in NFL history — which I did — you will find that Shula has improved his franchise’s overall winning percentage by more than any other coach in history.

The table below shows this data for every coach in Miami history.  The  coach who has harmed the team’s winning percentage the most is George Wilson, the first coach of the team and Shula’s predecessor. He went 15-39-2 coaching the expansion franchise — hey, no judgment here — and without him, Miami would have a franchise winning percentage of 0.576, which is 2% higher than the team’s actual winning percentage.

For every post in this series, I will post the full results in a table like this, sorted by best to worst in terms of improving his franchise’s overall win percentage. [continue reading…]

{ 0 comments }

All Time AFC North Teams, by Bryan Frye

Chase is a little preoccupied at the moment. I just had back surgery and have little else to but lay in bed. When Chase mentioned he needed some ideas to keep The Streak alive, I offered to make a series of posts briefly detailing my picks for each division’s all-time team. It’s a pretty straightforward concept that has probably been done before, and I’m fine with that. My version comes with a twist: as I warned Chase, I am on quite a few different medications and may not be functioning at 100%. Thus, my stipulations for writing this series are as follows:

  1. that I do it before my prescription runs out,
  2. that I write it completely off the top of my head and don’t do any research,
  3. that I don’t have to proofread this when I finish it, and
  4. that Chase doesn’t edit my nonsense out of the article.

Because I had the idea and made my own rules, I got to set up rosters however I wanted. I landed on the following: one quarterback, two running backs, three wide receivers, two tight ends, two tackles, two guards, one center on offense; and two defensive ends, two defensive tackles, two outside linebackers, two middle/inside linebackers, three cornerbacks, and two safeties on defense. I also went with a kicker and punter, but no return man because I’m lazy and did this for Chase off the top of my head at the eleventh hour.

I also maintained modern division designations. That means if a Packers player from the 1990s makes the team, he does so as part of the NFC North rather than the NFC Central. I don’t have all day, folks. [continue reading…]

{ 0 comments }

Brad Oremland is a longtime commenter and a fellow football historian. There are few who have given as much thought to the history of pro football as Brad has over the years. What follows is Brad’s latest work, a multi-part series on the best players in pro football history.


Best Players in Pro Football History: 111-125

I’m in semi-retirement as a football writer and historian, but my passion for pro football history hasn’t diminished even as my willingness to engage the modern game wanes. I recently re-read and admired the all-time pro football roster constructed by Bryan Frye following the 2014 season, and Bryan was gracious enough to offer me a platform for assembling my own all-time roster to challenge his. It was a fun exercise, and it required a lot of thought about the greatest players in history. That, in turn, led me to this project.

Over the next six weeks, I’ll reveal my personal list of the 125 best players in the history of professional football, with brief profiles on all of them. It’s probably the most ambitious sports project I’ve ever undertaken, so I hope you’ll be understanding about any disagreements. Inevitably, there are some heart-breaking omissions in any project like this. If I left off your favorite player, please understand that I didn’t “forget” him; I just had to make some hard choices. There are 280 players in the Pro Football Hall of Fame, and that doesn’t include active or recently retired players who have already established HOF-worthy legacies. There are historically great, Hall of Fame-caliber players who are not on my list of the top 125 — most of them, in fact. Making this list is a much higher standard than making it to Canton, and missing the list shouldn’t be interpreted as an insult.

Let’s be clear: making this list at any point indicates that I have extraordinary regard for that player. I would like to write about the players in exclusively positive terms, but since this series is organized as a ranking, some of the comments will highlight weaknesses by way of explaining why the player isn’t even higher. I try to anticipate arguments that a player should be ranked higher or lower, and tailor the summaries accordingly, but please don’t misinterpret these justifications as disrespect for the player’s accomplishments. Everyone on the list was (or still is) incredible. [continue reading…]

{ 1 comment }

NFL Field Goal Rates From 2014 to 2018

Field goal efficiency continues to improve in the NFL. Every once in awhile, it’s worth checking in on the league average rates to get a sense of “what’s normal” when it comes to NFL kickers. For example, it’s now expected that a 50-yard field goal will be successful. In fact, over the last 5 years, kicks from 50-53 yards were made nearly 70% of the time!

The graph below shows the NFL success rate on field goals over 4-yard increments. Even from 54-57 yards, kickers are now expected to make those kicks.

We can also use those rates to take a simple look at how each kicker has fared relative to league average, based on the length of their kicks. This covers all field goals from 2014 to 2018, and you won’t be surprised to see Justin Tucker as the NFL’s top kicker over that period.

RkPlayerFGAFGM%Exp FGMDiff
1Justin Tucker19517489.2%159.514.5
2Matt Bryant15513989.7%129.39.7
3Robbie Gould13812691.3%118.17.9
4Stephen Gostkowski19917889.4%170.47.6
5Matt Prater15713686.6%128.97.1
6Adam Vinatieri15813988%132.66.4
7Josh Brown706592.9%60.74.3
8Ryan Succop13511786.7%113.23.8
9Stephen Hauschka17615386.9%149.53.5
10Jason Myers1159784.3%94.12.9
11Josh Lambo1099486.2%91.62.4
12Wil Lutz1099486.2%91.82.2
13Harrison Butker726488.9%622
14Chris Boswell13011386.9%1112
15Greg Zuerlein16313683.4%134.11.9
16Shaun Suisham353291.4%30.51.5
17Michael Badgley222090.9%18.61.4
18Graham Gano16914384.6%141.61.4
19Jake Elliott706085.7%58.71.3
20Jason Sanders201890%17.10.9
21Dustin Hopkins11710085.5%99.30.7
22Ka'imi Fairbairn675785.1%56.40.6
23Garrett Hartley33100%2.60.4
24Daniel Carlson211781%170
25Johnny Hekker11100%10
26Sebastian Janikowski1139382.3%93.1-0.1
27Greg Joseph201785%17.2-0.2
28Shayne Graham353085.7%30.3-0.3
29Aldrick Rosas585086.2%50.3-0.3
30Jay Feely4375%3.4-0.4
31Dan Carpenter907684.4%76.4-0.4
32Dan Bailey14712283%122.5-0.5
33Brett Maher383078.9%30.6-0.6
34Patrick Murray494081.6%40.6-0.6
35Randy Bullock1109485.5%94.6-0.6
36Giorgio Tavecchio262180.8%21.7-0.7
37Travis Coons403587.5%35.9-0.9
38Nick Rose141178.6%12.2-1.2
39Mason Crosby16213684%137.5-1.5
40Kai Forbath1028684.3%87.6-1.6
41Matthew McCrane12866.7%9.7-1.7
42Cairo Santos13011084.6%111.8-1.8
43Chandler Catanzaro14412184%123.1-2.1
44Nick Novak1068984%91.1-2.1
45Younghoe Koo6350%5.2-2.2
46Zach Hocker141071.4%12.3-2.3
47Sam Ficken8562.5%7.3-2.3
48Alex Henery5120%3.6-2.6
49Andrew Franks393179.5%33.6-2.6
50Nate Freese7342.9%6-3
51Billy Cundiff292275.9%25.1-3.1
52Brandon McManus14912281.9%125.3-3.3
53Mike Nugent1119182%94.5-3.5
54Phil Dawson12710481.9%107.5-3.5
55Kyle Brindza12650%9.5-3.5
56Zane Gonzalez342470.6%27.7-3.7
57Cody Parkey12210283.6%105.8-3.8
58Connor Barth856981.2%72.9-3.9
59Josh Scobee362672.2%29.9-3.9
60Nick Folk977880.4%82.7-4.7
61Caleb Sturgis1169481%99-5
62Roberto Aguayo312271%27.1-5.1
63Blair Walsh1229678.7%102.7-6.7
{ 7 comments }

On January 3, 2019, the St. Louis Blues had the worst record in the NHL. But by the end of the year, the Blues had captured their first championship. There is no similar success story in NFL history, but I was curious: which Super Bowl champion had the worst record after X games, for all X?

There have been 9 Super Bowl champions that began the year 0-1. That is not a very big hole from which to escape. But only three teams — the 1993 Cowboys, the 2001 Patriots, and the 2007 Giants — have won the Lombardi Trophy after an 0-2 start. And in the first two cases, it’s noteworthy that Emmitt Smith and Tom Brady were not part of that 0-2 start, but entered the starting lineup in week 3.

What about the worst team after 3 games to win a Super Bowl? 5 teams have begun the season with a 1-2 mark; the three teams mentioned above, along with the 1981 49ers and the 2018 Patriots.

After 4 games? Just one team has started 1-3 and won the Super Bowl: the 2001 Patriots.

After 5 games? Two teams have started 2-3 and won the Super Bowl: the 2001 Patriots and the 1980 Raiders.

After 6 games? No team has been 2-4, with the ’01 Patriots, ’80 Raiders, and the 2010 Packers.

After 7 games? Only team, the 2001 Patriots, had a losing record at 3-4 after 7 games.

After 8 games? Only the 2001 Patriots were 4-4 after 8 games; the other 52 Super Bowl champions had a winning record at this point in the season.

After 9 games? No team had a losing record and won the Super Bowl; in addition to the ’01 Patriots, the ’00 Ravens were the only other team at 5-4 after 9 games that won it all in the Super Bowl era (the ’57 Lions also pulled off this feat).

After 10 games? Yes, once again, we have a field of one: the 2001 Patriots are the only team without a winning record after 10 games, as New England began this season 0-2, 1-3, 3-4, and 5-5. That was the team’s last loss of the season.

After 11 games? Three teams started 6-5: the ’88 49ers, ’01 Patriots, and a new entry: the ’11 Giants.

After 12 games? Just one Super Bowl champion, the 2011 Giants, failed to have a winning record at this point in the season.

After 13 games? The 2011 Giants, at 7-6, are the lone entry here.

After 14 games? The 2011 Giants were 7-7! Only one other team, the 2010 Packers at 8-6, had even 6 losses after 14 games.

The 2011 Giants were the only team to win the Super Bowl with 7 losses, so they are the Super Bowl champion with the worst record after 15 and 16 games, too.

So the Patriots had the single worst record, either alone or tied with other teams, of any Super Bowl champion through X games, for all values of X from 1 to 11. At 6-5, the 2011 Giants were tied with the Patriots (and ’88 49ers) for worst record, and the 2011 Giants hold the mark for worst record of any Super Bowl champion through X games, for all values of X from 11 to 16. The graph below shows the winning percentages of both teams after each game of the regular season.

What do you think?

{ 0 comments }

AFC West Champion History: A Tale of Parity

Like the AFC East, the AFC West has been home to some of the best quarterbacks in NFL history. You know that the Broncos have been fortunate to have John Elway and Peyton Manning bring home 11 division titles, and that the Chargers have 7 from Philip Rivers and Dan Fouts. For Oakland, Daryle Lamonica (5), Ken Stabler (4), Rich Gannon (3) and Jim Plunkett (2) have led them to division crowns, But don’t forget that Joe Montana and Drew Brees have led AFC West teams to division titles.

In the early AFL days, it was Jack Kemp, Len Dawson, John Hadl and Tobin Rote bringing home division crowns. The AFL / AFC West has always been a remarkably competitive division, with the Raiders, Chiefs, Broncos, and Chargers always fighting for division superiority. And two times, it was the Seahawks — behind Dave Krieg in ’88 and Jon Kitna in ’98 — winning the division.

The graph below shows the AFL / AFC West division winner in each year since 1960. [continue reading…]

{ 0 comments }

Guest Post: 4th Quarter Comeback Percentage

Today’s guest post comes from one of the longest followers of this blog (and its predecessor), Richie Wohlers. Richie is 44-year-old accountant from Southern California who is a Dolphins fan despite never being to Florida. As always, we thank our guest posters for contributing.


One of the stereotypical traits of a great quarterback is to be able to rescue his team from certain defeat in the fourth quarter by leading his team to a come-from-behind win. Thanks to the awesome work of Scott Kacsmar, we now have definitions for what it means to have a “4th quarter comeback”.

I began watching football in the early ’80s, and for most of the late ’80s and early ’90s I had heard that Dan Marino and John Elway were battling for the title of most 4th quarter comebacks (4QC). You can run a query on Pro Football Reference and see that when Elway retired, he was tied with Marino for most 4QC. Marino picked up 2 more 4QC after Elway retired and then Marino retired as the all-time leader in the regular season.

In this game in 2009, Peyton Manning recorded his 34th 4QC to become the new all-time leader. Entering the 4th quarter trailing by 3 points and scoring the winning touchdown with 5:23 left isn’t the most exciting of comebacks, but it counts, nonetheless.

Manning remains the leader with 8 more 4QC than Tom Brady and 9 more than Drew Brees.

I was a Dan Marino fan, and always loved when he was listed at the top of the unofficial leaderboard for 4QC, but it felt a little hollow to me. Joe Montana also had a lot of comebacks, but it seemed to me that his team trailed in 4th quarter far less often than Marino’s teams. This meant that Marino had far more chances to rack up his 4QC than did Montana. In fact, Marino’s teams lost almost twice as many games during his career as Montana.

So which QB’s have had the best success rate for 4QC given the number of chances they had?

In order to figure out the 4th Quarter Comeback Percentage (CB%), I am dividing the number of successful 4QC by the number of opportunities. By Kacsmar’s definition, a QB can only earn a comeback if the team trailed or was tied at some point in the fourth quarter, and some type of offensive scoring drive put points on the board in the 4th quarter while the team trailed by one possession or were tied and of course the team had to win the game.

I calculated a 4QC opportunity as the sum of all of a quarterback’s losses, plus all his ties, plus all his successful comebacks. There is a little bit of slop in these numbers for a few reasons.

  • A QB’s W-L-T record on PFR is based on games started, so if a QB came on in relief and trailed in the 4th quarter but did not get a 4QC it will not count as a failed opportunity for him. Likewise, if he does get a 4QC, PFR still won’t credit him with a win.
  • If the defense scored the winning points it would not be a 4QC and would also not count as a failed opportunity.
  • If a team never trailed in the 4th quarter, but the game ended up as a tie, this would have never been an opportunity to earn a 4QC for the QB.
  • I think the 25 points by Neil Lomax was the largest 4th quarter comeback in history. So, any deficit of more than 25 would be nearly impossible, but it will still count as a failed opportunity. I’m fine with that, because any team trailing by more than 25 points probably got there because the QB wasn’t playing well to begin with.

There are probably a few other exceptions, but this should still create a reasonable approximation of 4QC success rate. The denominator is therefore (QB Losses + QB Ties + Successful 4th Quarter Comebacks). The numerator is Successful 4th Quarter comebacks plus QB Ties divided by 2, so a quarterback gets half-credit for each tie.

On average, these quarterbacks have a 19% success rate. The table below shows every QB who has had at least 5 opportunities for 4QC since the merger (including pre-merger stats for quarterbacks who played after the merger, but only back to 1960 for Len Dawson, John Brodie).

The final column shows how each quarterback fared relative to the average 19% success rate. Let’s use Peyton Manning as an example. He had 79 career losses, 0 ties, and 43 successful 4th quarter comebacks: therefore, he had 122 opportunities. Given the 19% success rate for the average quarterback, we would expect an average quarterback to have 23.1 successful comebacks. Instead, Manning has 43, or 19.9 more than expected. That’s the most of any quarterback; his father has the fewest. [continue reading…]

{ 0 comments }

When the Giants traded Odell Beckham to the Browns, I noted how rare it was for young, talented wide receivers to change teams. Over the last couple of weeks, I’ve calculated the fantasy value – as measured by VBD – of every player since 1970.

The graph below shows all WRs to enter the league since 1970 and produce at least 200 points of VBD. The X-Axis shows the year that player switched teams for the first time. The Y-Axis shows how much VBD they had in their career prior to switching teams.

As you can see, OBJ is a bit of an outlier when it comes to being both very good with his first team and leaving his first team at a young age.

The table below shows the 95 wide receivers with 200+ points of VBD since 1970. Here’s how to read the table below. John Jefferson played from 1978 to 1985, and was 25 years old when he first switched teams. He had a whopping 318 points of VBD with his first team, and 320 points of career VBD through age 26.

Wide ReceiverFirst YrLast YrAge When Switching TeamsVBD With 1st TeamCareer VBD Thru 26
Andre Rison19892000230384
Ken Burrough1970198123037
John Jefferson1978198525318320
Wes Chandler197819882590365
Cris Carter19872002251035
Ahmad Rashad197219822511
Reggie Rucker1970198125070
Brandon Marshall2006201826220242
Santana Moss200120142668156
Wes Welker2004201526061
Keenan McCardell1992200726020
Odell Beckham2014201827392392
Charlie Brown1982198727209209
Terance Mathis199020022700
Randy Moss1998201228689648
DeSean Jackson2008201828185120
Keyshawn Johnson1996200628146103
Joe Horn199620072800
Anthony Miller1988199729237115
Darrell Jackson2000200829210135
Joey Galloway1995201029196157
Vincent Jackson200520162913396
Drew Hill197919932900
Anquan Boldin2003201630408223
Carl Pickens1992200030313292
Antonio Freeman1995200330312261
Greg Jennings2006201530266141
Louis Lipps1984199230209176
J.T. Smith197819903000
Terrell Owens199620103155996
James Lofton1978199331510303
Gary Clark1985199531455186
Ernest Givins1986199531264168
Bob Chandler197119823121071
Derrick Mason19972011312043
Irving Fryar19842000314715
Mark Clayton1983199332518281
Muhsin Muhammad199620093224467
T.J. Houshmandzadeh20012011322150
Haywood Jeffires198719963220153
Torry Holt1999200933635192
Chad Johnson2001201133469183
Jordy Nelson200820183336187
Henry Ellard19831998333009
Eric Moulds199620073324990
Andre Johnson2003201634573134
Roy Green1979199234373143
Anthony Carter198519953422835
Harold Carmichael1971198435553245
Steve Smith2001201635498188
Stanley Morgan1977199035346184
Isaac Bruce1994200936560268
Andre Reed1985200036459212
Art Monk198019953742257
Tim Brown198820043859719
Jerry Rice19852004391636446
Marvin Harrison19962008na94143
Steve Largent19761989na810321
Antonio Brown20102018na724247
Larry Fitzgerald20042018na687424
Calvin Johnson20072015na683350
Sterling Sharpe19881994na574183
Julio Jones20112018na571342
Michael Irvin19881999na563211
Cliff Branch19721985na527149
Reggie Wayne20012014na50977
Herman Moore19912002na499321
Jimmy Smith19922005na4750
Rod Smith19952006na4620
A.J. Green20112018na423248
John Stallworth19741987na422117
Roddy White20052015na41934
Hines Ward19982011na405133
Mike Quick19821990na389280
Wesley Walker19771989na382176
Demaryius Thomas20102018na370194
DeAndre Hopkins20132018na362362
Tony Hill19771986na350197
Marques Colston20062015na337185
Dwight Clark19791987na332301
Drew Pearson19731983na331264
Sammy White19761985na331239
Mel Gray19711982na33099
Dez Bryant20102017na326302
Mark Duper19821992na314152
Cris Collinsworth19811988na296243
Lynn Swann19741982na295235
Isaac Curtis19731984na282274
Nat Moore19741986na279212
Alfred Jenkins19751983na270107
Steve Watson19791987na249180
Donald Driver19992012na2470
Mike Evans20142018na242242
Davante Adams20142018na213213
Al Toon19851992na213188

As for Beckham, he ranks 4th in career VBD through age 26 among all wide receivers to enter the NFL since 1970. The top three? Randy Moss, Jerry Rice, and Larry Fitzgerald.

{ 0 comments }

The AFC/AFL East has been around since 1960. Since that time, the Patriots (21) and Dolphins (14) have won the majority of division titles, while the Jets are behind one team no longer in the division and one team that hasn’t been in the division since the merger.

The graph below shows the winner of the AFC/AFL East in each year of existence.

[continue reading…]

{ 0 comments }

In 1998, Glenn Foley started the season as the Jets quarterback. He went 0-3 but was replaced by Vinny Testaverde, who went 12-1 as a starter that year. Testaverde led the Jets to an AFC East Division title that season.

In 2002, Testaverde had switched roles. He began the season as New York’s starter, but went 1-3, and was replaced by a young Chad Pennington. In his first year as a starter, Pennington led the NFL in completion percentage, touchdown percentage, and passer rating, and led New York to an 8-4 record. That included a win over the Patriots … in New England… on Sunday Night Football in week 16, that meant neither New England nor New York would control their own destiny for the playoffs. Entering week 17, Miami was 9-6, with the Jets and Patriots at both 8-7; Miami would win the division with a win over New England in week 17, New England would win the division with a win over Miami and a Jets loss to Green Bay, and New York would win with a win over the Packers and a Dolphins loss to New England.

Miami led 24-13 over the Patriots with 4 minutes to go, but New England completed a wild comeback to force overtime. The Patriots ultimately won, 27-24, and the stadium full of Jets fans erupted when news was blasted on the big screen. New York routed the Packers, giving the Jets the AFC East.

Why such lengthy descriptions about a pair of division titles? Because those are the only two times the Jets have ever won the AFC East. In 1968 and 1969, Joe Namath led the Jets to division titles over the Bills, Dolphins, Patriots, and Oilers to capture the AFL East crown, in those final two seasons prior to the merger.

But that’s it. In 59 seasons, the Jets have won just 4 division titles. How bad is that? Well, consider the following. For the first 6 seasons of the Jets franchise, they played in a 4-team division in the AFL East. The last 17 years, the Jets have played in the 4-team AFC East. So for 23 seasons, the Jets — if all teams were average — would have a 25% chance of winning the division. That would mean we would have expected New York to win 5.75 division titles those years. And for the 36 years from 1966 to 2001, the Jets played in a 5-team division, so you would expect 7.2 division titles with a 20% chance each season.

So over the 59 seasons, you would expect an average team in the Jets position to win 12.95 division titles. Instead, the Jets won 4, just 31% as many division titles as you would expect. That’s the fewest of any team.

The table below shows the results for every team in the NFL. The Cowbyos were in 7- and 8-team divisions for a couple of years, but like the Jets, entered the NFL in 1960. Dallas, like the Jets, was in a 5-team division from 1970 to 2001, and a 4-team division since; as a result, the Cowboys would be “expected” to have 12.38 division titles, with that number slightly lower than New York due to those early years in big divisions. In reality, Dallas has won 24 division titles, or 194% relative to expectation. That’s the most of any team. [continue reading…]

{ 2 comments }

The Best Fantasy Triplets Since 1970

The controls behind the top engine in fantasy football history

Troy Aikman, Emmitt Smith, and Michael Irvin will always be remembered as the triplets that took the NFL by storm in the early 1990s. But the best fantasy triplets ever? That honor belongs to the 1982 Chargers.

That year, shortened to 9 games by the strike, saw some of the best fantasy production ever. Wide receiver Wes Chandler had 1,032 yards and 9 touchdowns despite missing one game; he had arguably the most dominant fantasy season since 1970 by any wide receiver. Quarterback Dan Fouts averaged 320 passing yards per game, an NFL record that stood until 2011; he was the top fantasy quarterback that season. San Diego had a bit of a shared running back situation, as backup James Brooks was the 25th-most valuable fantasy RB that year, but starter Chuck Muncie was the 4th best fantasy runner. If you want to look at the best fantasy quartets, the 1982 Chargers stand out even farther from the pack. That year, tight end Kellen Winslow had one of the most dominant seasons in fantasy history, and was easily the top fantasy TE in the NFL.

So the 1982 Chargers had the best QB, best WR, and best TE, and the 4th-best RB. Can any other team come close to matching that? The 1993 and 1994 49ers come very close, with Ricky Watters, Jerry Rice, Steve Young, and Brent Jones. Both years, Young and Rice were the top fantasy players at their positions; in ’93, Watters was the #2 RB and Jones the #5 TE; in ’94, Watters was the #5 RB and Jones the #3 TE. Last year’s Chiefs nearly matched what the ’82 Chargers did: Patrick Mahomes was the top fantasy QB, Tyreek Hill the top fantasy WR, and Travis Kelce the top fantasy TE. RB Kareem Hunt was a top-5 fantasy RB through 12 weeks, when the Chiefs released him.

But my vote for the best fantasy triplets goes to the Chargers. I found the VBD score for the top QB, RB, and WR for every team since 1970, and then calculated the geometric mean of those three scores. The table below shows the top 200 seasons by this metric. Here’s how to read the table below. The top trio was the Chargers group from 1982. That year, Fouts had 130.2 points of VBD, Muncie had 116.8 points of VBD, and Chandler had 218.4 points of VBD. Fouts was the top QB in 1982, Muncie was the #4 RB, and Chandler the number one wide receiver. The geometric mean of the three VBD scores was 149.2, the best ever. [continue reading…]

{ 0 comments }

Over the last week, I’ve looked at the best fantasy players since 1970. Here are those links:

QB single-season
QB career
RB single-season
RB career
WR single-season
WR career
TE single-season

We conclude this series with a look at the top fantasy TEs, by career VBD, since 1970.

RkTight EndFirst YrLast YrVBD
1Tony Gonzalez199720131059
2Shannon Sharpe19902003802
3Antonio Gates20032018691
4Kellen Winslow19791987652
5Rob Gronkowski20102018564
6Todd Christensen19791988552
7Jason Witten20032017471
8Ben Coates19912000463
9Ozzie Newsome19781990447
10Dave Casper19741984433
11Keith Jackson19881996432
12Jimmy Graham20102018415
13Wesley Walls19892003342
14Travis Kelce20132018305
15Rich Caster19701982284
16Mark Bavaro19851994279
17Riley Odoms19721983275
18Bob Tucker19701980269
19Brent Jones19871997256
20Mickey Shuler19781991251
21Steve Jordan19821994250
22Eric Green19901999244
23Jay Novacek19851995238
24Jeremy Shockey20022011237
25Ted Kwalick19691977235
26Frank Wycheck19932003230
27Raymond Chester19701981230
28Todd Heap20012012215
29Zach Ertz20132018207
30Dallas Clark20032013194
31Charle Young19731985191
32Paul Coffman19781988190
33Greg Olsen20072018176
34Henry Childs19741984171
35Doug Cosbie19791988169
36Vernon Davis20062018167
37Charlie Sanders19681977158
38Dan Ross19791986155
39Alge Crumpler20012010155
40Chris Cooley20042012154
41Delanie Walker20062018151
42Jimmie Giles19771989150
43Rodney Holman19821995149
44Walter White19751979148
45Jim Mitchell19691979141
46Kellen Winslow20042013136
47Freddie Jones19972004133
48Rickey Dudley19962004128
49Jerome Barkum19721983127
50Johnny Mitchell19921996122
51Russ Francis19751988113
52Billy Joe DuPree19731983112
53Jerry Smith19651977108
54Jackie Harris19902001107
55Marv Cook19891995105
56Joe Senser1980198499
57Bob Trumpy1968197798
58George Kittle2017201897
59Dave Parks1964197395
60Julius Thomas2011201794
61Marcus Pollard1995200890
62Jackie Smith1963197886
63Jean Fugett1972197985
64Mark Chmura1993199983
65Pete Metzelaars1982199782
66Jordan Reed2013201876
67Eric Ebron2014201875
68Randy McMichael2002201274
69Owen Daniels2006201573
70Pete Holohan1981199269
71Gary Barnidge2008201669
72Aaron Hernandez2010201267
73Heath Miller2005201567
74Emery Moorehead1977198864
75Derrick Ramsey1978198763
76Tyler Eifert2013201862
77Robert Awalt1987199360
78Mike Barber1976198558
79Evan Engram2017201855
80Chad Lewis1997200554
81Kyle Rudolph2011201852
82Ethan Horton1985199451
83Calvin Magee1985198850
84David Hill1976198750
85Kyle Brady1995200750
86Jay Riemersma1997200450
87Don Hasselbeck1977198548
88Tony McGee1993200347
89Ken Dilger1995200446
90Martellus Bennett2008201746
91John Spagnola1979198945
92Cam Cleeland1998200545
93Bubba Franks2000200845
94Jermaine Wiggins2000200645
95Brent Celek2007201744
96Jared Cook2009201844
97Willie Frazier1964197542
98Jordan Cameron2011201642
99Eric Johnson2001200740
100Keith Krepfle1975198240

Please leave your thoughts in the comments.

{ 0 comments }

Over the last week, I’ve looked at the best fantasy players since 1970. Here are those links:

QB single-season
QB career
RB single-season
RB career
WR single-season
WR career

Today, we use the same methodology to analyze the top TE seasons in fantasy history (or, at least, since 1970). Todd Christensen has the best season by a fantasy tight end catching 92 passes for 1,247 yards with 12 TDs at a time when many tight ends were doing nothing. Cincinnati’s Dan Ross was the 12th-ranked TE in adjusted fantasy points (he ranked 10th overall and played in 16 games) and he had a 42-483-3 stat line. Suffice it to say, having Christensen on your team was like a cheat code: other than a rookie Eric Dickerson, the Raiders TE was the most valuable player in fantasy football in 1983.

The other names in the top five — Christensen has the 5th best season, too — are much less surprising: Kellen Winslow, Rob Gronkowski, and Tony Gonzalez.

The table below shows the 200 most dominant seasons by a tight end in fantasy football since 1970. [continue reading…]

{ 0 comments }

Over the last week, I’ve looked at the best fantasy players since 1970. Here are those links:

QB single-season
QB career
RB single-season
RB career
WR single-season

Today, the WR career list. It will come as no surprise that Jerry Rice is, by far, the greatest fantasy football wide receiver. His dominance is unmatched. After him comes three contemporaries in Randy Moss, Terrell Owens, and Marvin Harrison. You might be surprised to see Steve Largent come in at #5, who had 7 different seasons where he was a top-5 fantasy wide receiver. [continue reading…]

{ 0 comments }

On Saturday, I looked at the top fantasy seasons by running backs since 1970. On Tuesday, I looked at the top fantasy seasons by quarterbacks, and today, we will do that for wide receivers. I am using the same scoring system throughout this series: 1 point per 20 yards passing, 1 point per 10 yards rushing/receiving, 5 points per passing TD, -2 points for each interception, 6 points per rushing/receiving TD, 0.5 points per reception.

In 1995, Jerry Rice had one of the best seasons in NFL history. He caught 122 passes for 1,848 yards and 15 touchdowns, and also rushed for 36 yards and a touchdown. That translates to 352.5 fantasy points.  Meanwhile WR30 had 148.7 adjusted fantasy points (using the same system described in the running backs article).  That translates to 203.8 fantasy points of VBD.  That’s probably the best fantasy season by any wide receiver, with perhaps one exception.

In 1982, during the 9-game strike-shortened season, Wes Chandler of the Chargers caught 49 passes for 1,032 yards and 9 TDs, and also rushed for 32 yards. That translates to 184.9 fantasy points, a remarkable amount given that he just played in 8 games. WR36 in 1982 averaged 6.5 fantasy points per game, which means over a full 9-game season Chandler would be worth 191.4 fantasy points. That year, WR30 had 68.5 fantasy points, giving Chandler 122.9 points of VBD. If we pro-rate that to a 16-game season, that is worth 218.4 points of VBD. [continue reading…]

{ 0 comments }

Peyton Manning is the best quarterback in fantasy football history. That much is not open to debate. What separates Manning is not just his remarkable longevity, or his remarkable peak, but sustained level of very, very good play.

Here were Manning’s yearly fantasy ranks:

1998-9
1999-3
2000-3
2001-5
2002-4
2003-2
2004-2
2005-3
2006-1
2007-3
2008-6
2009-5
2010-3
2011-dnp
2012-4
2013-1
2014-3
2015-34

That’s a whopping 10 top-3 seasons, and 14 top-5 seasons, marks that will be difficult for any quarterback to ever match. Drew Brees and Tom Brady each have 7 top-3 seasons, while Aaron Rodgers has 6; Brees has 9 top-5 seasons, while Brady and Rodgers are at 7 and 6, respectively. That’s right: Peyton Manning has more top-5 fantasy seasons than Brady and Rodgers have combined.

The graph below shows each of the four superstar fantasy quarterbacks of our era shown in their primary team colors. This shows their VBD score by year — and remember, a player gets 0 VBD points if he was not a top-12 player in adjusted fantasy points (as described in yesterday’s post). [continue reading…]

{ 0 comments }

The best fantasy QB ever

On Saturday, I looked at the top fantasy seasons by a running back since 1970. Today, let’s look at quarterbacks.

As a reminder, I am using the following scoring system throughout this series: 1 point per 20 yards passing, 1 point per 10 yards rushing/receiving, 5 points per passing TD, -2 points for each interception, 6 points per rushing/receiving TD, 0.5 points per reception. Let’s use Dan Marino 1984 as an example. That season, Marino threw for 5,084 yards and 48 TDs, while throwing 17 interceptions. He finished with no rushing touchdowns and -7 rushing yards, for a total of 459.5 fantasy points.

Now, Peyton Manning in 2013 threw for 5,477 yards, with 55 TDs and just 10 interceptions. Like Marino, he wasn’t doing much on the ground, with -31 rushing yards and 1 TD. That’s a total of 531.8 fantasy points, which remains the most fantasy points any single player has every produced in a season of fantasy football.

But in 2013, Manning was probably not even the most valuable player in fantasy football that season, even if he scored the most points of any player ever. That’s because in fantasy football, your value is based on how you perform relative to your peers, the bedrock of VBD, which measures a player’s value relative to the worst starter. When calculating VBD scores, in this series, I used the 12th-ranked quarterback, 24th-ranked running back, 30th-ranked wide receiver, and 12th-ranked tight end. This assumes that the average league starts 1 QB, 2 RBs, 2.5 WRs, and 1 TE.

In 2013, the 12th-ranked QB (after adjusting for games played) had 339.8 fantasy points, so Manning finished with 192.0 points of VBD.  In 1984, the 12th-ranked quarterback had 252.2 fantasy points.  Therefore, Marino had 207.3 points of VBD, making it a more valuable season than Manning.

The table below shows the top 200 fantasy seasons by a quarterback since 1970.  For a full description of the methodology, including how VBD incorporates missed games and non-16 game NFL seasons, click here. [continue reading…]

{ 0 comments }

Football Perspective Turns Seven Years Old

Keep on throwing until the final gun.

On June 15, 2012, Football Perspective was born. Since that day, Football Perspective has published at least one new article published every day, 7 days a week, 365 days a year, for 7 years. This is the site’s 2,731st post: You can view every article ever written at FP here, and at the top of each page on this site is a link to the Historical Archive, which is also updated after each post is published.

At some point, The Streak will end: it is now up to 2,559 days in a row. A few weeks ago, I chronicled my 17-year writing history and provided some writing tips I’ve picked up along the way. It remains important to me to pay it forward, and to remind younger writers that you are the sum of your connections. And nobody is more fortunate than me in that regard.

Today is a different sort of appreciation post: this one is about you. The readers of this site have already made Football Perspective way more successful than it ever should have been. It is never lost on me how lucky I am to have a community where people are willing to take time out of their busy lives to check Football Perspective. Many of you check in here every day. And in an era where civility is moving in inverse relationship to interception rate, it’s inspiring the way you conduct yourselves.

The comments sections on the internet are known for being awful and trending downward, but you go out of your way to be kind to others and to provide thoughtful, intelligent, helpful, and meaningful responses. There really is a Football Perspective community, and it’s a very cool thing. Getting to know you, getting help from you, and just learning and enjoying football with you is an awesome experience.

I have been influenced by some of the best people — and minds — in our football world: David Dodds and Joe Bryant at Footballguys.com, Sean Forman, Neil Paine, and Mike Kania at Sports-Reference.com, and the incomparable Doug Drinen at both sites. Without each of those six people actively and continuously supporting me, my life would be materially worse, and oh yeah this website wouldn’t exist. [continue reading…]

{ 0 comments }

Yesterday, I wrote that in 2006, LaDainian Tomlinson had the best fantasy season any running back has ever had. He produced a record 282.4 points of VBD that year, but Tomlinson was no one year wonder. In 2003, he had 245.8 points of VBD, the 6th-best season by any running back since 1970. He had 186.6 points of VBD in 2005 and 183.6 points in 2007, and was a top-3 fantasy running back every year from 2002 to 2007. Take a look at his career:

That number at the bottom right — 1,487.3 — shows how many career points of VBD Tomlinson produced. That’s the most of any running back since the merger, slightly edging out Marshall Faulk and Emmitt Smith. Those three overlapped from ’01 to ’04, and in some ways the fantasy torch was passed from Smith (#1 fantasy RB from ’92 to ’95) to Faulk (#1 from ’99 to ’01) to Tomlinson (top-3 each year from ’02 to ’07).

The graph below shows the VBD each player had from ’90 to ’01:

Of course, if we really want to compare those three, let’s do it by age. This chart is pretty interesting, because the three stand out in different ways: [continue reading…]

{ 1 comment }
The fantasy GOAT

The fantasy GOAT

As I have done before, over the next few days, I want to look at the top fantasy players throughout history.

I will be using the following scoring system throughout this series: 1 point per 20 yards passing, 1 point per 10 yards rushing/receiving, 5 points per passing TD, -2 points for each interception, 6 points per rushing/receiving TD, 0.5 points per reception. Let’s use LaDainian Tomlinson in 2006 as an example. That year, he rushed for 1,815 yards and 28, caught 56 passes for 508 yards and 3 touchdowns, and even threw for 20 yards and 2 touchdowns.

That means Tomlinson scored 457.3 fantasy points that year. How valuable is that? In fantasy football, using principles of VBD, a player’s value is determined based on how much better he was than the worst starter. When calculating VBD scores, in this series, I used the 12th-ranked quarterback, 24th-ranked running back, 30th-ranked wide receiver, and 12th-ranked tight end. This assumes that the average league starts 1 QB, 2 RBs, 2.5 WRs, and 1 TE.

In 2006, the 24th-ranked running back scored 174.9 fantasy points. Therefore, the traditional methodology would say that Tomlinson produced 282.4 points of VBD in 2006, which is the most of any season since 1970. That is the standard, straightforward way to analyze fantasy production. However, that baseline is probably a bit low because some of the top 24 RBs missed games. Assuming a league where everyone plays two starting running backs, that makes RB30 the backup. So I then sorted all players by fantasy points per game, and added the FP/G from the 30th-best RB in that metric to each player’s fantasy total. Doing this raises the RB24 baseline to 190.2 fantasy points. That means Tomlinson would have 267.1 points of VBD, rather than 282.4.

There are two other adjustments I am making in this series, although neither impact Tomlinson’s 2006 season.

Let’s look at the second-most famous season that O.J. Simpson had in Buffalo. In 1975, Simpson rushed for 1,817 yards and 16 touchdowns, but what made it a historic season was that he also caught 28 passes for 426 yards and 7 touchdowns. That gave him 376.3 fantasy points, while the RB24 that year had just 130.9 fantasy points. However, using adjusted fantasy points, RB24 that year had 134.5 fantasy points. Therefore, Simpson had 241.8 points of VBD that season, but remember: in 1975, the league’s season lasted just 14 games. Therefore, for all non-16 game seasons, I multiplied each player’s VBD by 16 and divided that result by the number of team games that year. Therefore, Simpson gets an era-adjusted VBD score of 276.3, just a hair ahead of Tomlinson’s 2006 campaign. So by this methodology, it’s actually Simpson’s 1975 season that is the best in running back history.

Finally, let’s look at what Marshall Faulk did in 2001. The Rams legend had 1,382 rushing yards and 12 rushing touchdowns, while catching 83 passes for 765 yards and 9 TDs. That means Faulk scored 382.2 fantasy points. However, Faulk missed two games that season due to injury. It’s better to score 382.2 fantasy points in 14 games than in 16 games, because from a fantasy perspective, you can play someone else in those two games and get more points. If you owned Marshall Faulk in fantasy that year, you would have played your backup RB those two weeks, and that’s worth something. It would have really been worth something if you played Marshall Faulk’s backup Trung Canidate, who gained 358 yards and scored 3 touchdowns those two weeks. But for these purposes, I took the average FP/G for the average backup — after sorting by FP/G, the results for QB18, RB30, WR36, and TE18 — and added that to each player’s VBD score. For Faulk, this raises his fantasy points total from 382.2 to 400.2, because the average backup running back that year produced 9 points per game. Since RB24 (on an adjusted basis) that year had 170.3 fantasy points, this means Faulk gets 229.9 points of VBD [continue reading…]

{ 0 comments }

Oldest Fantasy Players Since 1970, By Year

The table below shows the oldest QB, RB, WR, and TE in the NFL each season that ranked at least (i) in the top 30, for quarterbacks and tight ends, (ii) in the top 50, for running backs ,or (iii) in the top 70, for wide receivers.

The age is the player’s age as of September of the season in question. So last year, a 41.1-year-old Tom Brady was the oldest quarterback, Frank Gore at 35.3 years was the oldest running back,Larry Fitzgerald (35) was the oldest wide receiver, and a 38.2-year-old Antonio Gates was the oldest tight end. [continue reading…]

{ 0 comments }

There were only 2,214 punts last season, an average of just 4.32 per team game. That number is low, and it’s really low considering the low number of turnovers. Meanwhile, NFL teams scored 1,286 rushing or passing touchdowns last season and kicked 947 field goal attempts, meaning there were a total of 2,233 drives last year that ended in a touchdown or a field goal attempt.

You won’t be surprised to know that offensive production is on the way up, and we’ve long known that turnover rates are declining, scoring is up, and punting is down. But the 2018 season became the first since the merger with more drives ending on a scoring play or potential scoring play than on a punt.

The graph below shows the number of punts per team game, and the number of combined touchdowns and field goal attempts per team game, for each season since 1970. [continue reading…]

{ 1 comment }

Suppose you know for certain that prior to kickoff, a team has a 30% chance of winning.

Question: What are the odds that at some point in the game, this team has a win probability of at least 50%? And here I mean real win probability, not just that some win probability model says they have a 51% chance.

Now, here come the real two questions I want you to answer.

1) Is the answer question: (a) something that is just trivia, or (b) relevant information for NFL analyst?

2) Is this something that you can/should use data to answer, or something that can/should be answered using logic and intuition?

{ 1 comment }

NFL Players, Ironically, Don’t Begin On Sunday

There were over 11,000 players drafted from 1970 to 2018. You might think that those players were evenly distributed in terms of what day of the week they were born. For example, 1 out of every 6.9 were born on Monday, which is pretty close to what you would get by random chance. And 1 out of every 6.9 players were born on Tuesdays and Saturdays, respectively, too. In between those days, 1 out of every 6.7 or 6.8 NFL players were born on a Wednesday, Thursday, or Friday. All pretty even, until we get to the day dominated by pro football: only one out of every 8.2 NFL babies were born on a Sunday.

The graph below shows, for all NFL players drafted from ’70 to ’18 on whom I have birth data (generally those who actually made it to the NFL), how many were born on each day. As you can see, Sunday is a huge outlier. [continue reading…]

{ 0 comments }

Thirteen years ago, Doug Drinen first looked at NFL player birth days (the month and the day, not the year) at the old PFR Blog. Six years ago, I took a second look at that study.  And over the last two days, I spent time looking not just at when NFL players were born, but when people are born in the United States. Today is a continuation of those studies.

There have been 17,027 players to enter the NFL and play in a game since 1970.  Given what we know about the birth rate in the United States, we can then estimate how many NFL players should have which birth date.  For example,  the most common birthday, according to one study, is September 9th.  Roughly 0.303% of all U.S. babies are born on this day, which means we would “expect” there to be 51.5 players in this time period with 9/9 birthdays. It turns out that there have been 48, which is pretty close. September 8th is the date with the most NFL players since 1970 — 72 — compared to an expected result of 50.2 players.

Those are just two dates, of course, so let’s look at the entire calendar. I performed this same calculation for every date.  As it turns out, January 1st is the biggest outlier: it is a very rare day for babies to be born, but it’s actually an above-average day for NFL players.  More on that in a minute.  To smooth out the chart, I looked at 31-day periods, so the month of July would be captured by looking at July 16th on the draft (each data point represents that day, along with the 15 days before and after).

Two other notes.  For the ends of the year — early January and late December — I pro-rated the numbers to make them work while still using just calendar year cut-offs. [1]Specifically, here’s what I did.   For days before January 7th, I excluded due to small sample size.  Beginning on January 7th, I looked at the 7 days from the 1st to the 7th, and then … Continue reading The blue line represents the actual number of NFL players born in each 31-day window.  The orange line? That represents the estimated number of NFL players based on the birth rates for the United States. [continue reading…]

References

References
1 Specifically, here’s what I did.   For days before January 7th, I excluded due to small sample size.  Beginning on January 7th, I looked at the 7 days from the 1st to the 7th, and then multiplied that result by 31 divided by 7.  For January 8th, I looked at the players born from the 1st to the 8th, and multiplied that result by 31 and divided by 8.  And so on, until I got to January 16th. I used the same methodology for the end of December.
{ 0 comments }
Next Posts Previous Posts