≡ Menu

Moral Margin of Victory

Debating whether Moral Margin of Victory is the most superior model ever devised

Our Moral Margin of Victory is what's important, Bill.

Suppose you watch an entire football game. Your job is to put a single number on the degree to which the winning team beat the losing team. Qualitatively, the scale runs from “had any number of things gone differently at the end, the winning team would have lost” to “the winning team was in control for most of the game” to “this game was never in question.”

I want to quantify that qualitative scale. And I want to do it in a retrodictive way. In other words, I’m not as interested in the degree to which the winning team outplayed the losing team as I am in the degree to which the winning team was in control of the game. To see the difference, imagine a game where one team opens up a 14-0 lead on a kickoff return touchdown and a fluke turnover that leads to a score, then cruises to an uneventful 31-17 win. The advanced stats might even show that the losing team was more efficient. The predictive measures might give the losing team a better grade, because the reasons the winning team won were not things that are likely to carry over to future games. I don’t care about any of that. The kick return happened, and the turnover happened, and the result was that the game was never in any serious doubt.

The easiest way to do this is to use margin of victory, and that works well in most cases, but there are obvious outliers. Consider the Green Bay – Washington game from week two, which was 24-0 midway through the second quarter and never really got any closer, and the Colts-49ers game, which was a one-score game with five minutes remaining. The latter game finished with a larger margin of victory. Again, if you’re interested in predictive measures, you probably do want to record that Robert Griffin III was able to generate a couple of late TDs and that the Colts were able to put away the 49ers so quickly and thoroughly. But I’m not interested in that here.

Another natural answer would be to use Chase’s game scripts. Or, if you wanted to fancy up the same concept, you could compute the average win probability throughout the game. This too would work in the majority of cases, but not always. If a game is tied with two minutes left, that’s really all I need to know: the game should be graded as “could’ve gone either way.” But game scripts (or average WP) would be sensitive to how the game progressed for its first 58 minutes. Whether one team went up 21-0 and then the other team came back to tie it, or the game was a seesaw affair, all that really matters that the game was still very much in question at the end.

In 2008, I borrowed an idea that the great Matt Hinton called Time of Knockout. Chase later refined the idea with these two posts. Those were a couple more attempts to get at what I’m trying to get at above. These are fun, but they are flawed in ways similar to margin of victory and game script. The comments to Chase’s posts contain a lot of the ideas in the discussion above.

Now I’m going to tell you my answer. Then you’ll use the comments to tell me how to improve it. [continue reading…]

{ 31 comments }

Contest Results

contestLast week Chase announced this contest in honor of Football Perspective’s first birthday. Here’s the backstory…

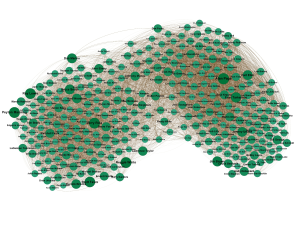
A couple of years ago, I moved. The house I was moving into, like many houses, had walls. The walls did not have artwork pre-installed, so I spent a good six months of my life obsessed with finding good wall-art. Somewhere in there, I stumbled on the open-source visualization program called Gephi. It looked super-cool, so I decided to play around with it.

The bug/bean/Australia/peanut/hairball Chase posted last week is the result. In addition to framing one for my own wall, I framed one each for Chase and Lisk, and I mailed them off. I don’t use the word “hero” very often, but really, what other word is there for someone who is talented enough to create world-class art and generous enough to send it to his friends? This was a good thing I had done. So what’s a hero to do when he is told, tactfully of course, by both Chase and Lisk, that his art kinda sucks? I thought the bean’s worth was self-evident.

The mechanics are straightforward. I don’t even remember the specifics but, as you all figured out, this is a roster of the best players in modern-ish NFL/AFL history. The size of a player’s dot represents his quality, as measured by career AV or 100-95-90-… AV — I can’t remember which. The strength of a connection between two players is the number of games they played with and against each other. So Peyton Manning is strongly connected to Marvin Harrison, less connected to Tom Brady, still less connected to Brian Urlacher, and not at all connected to Dan Fouts or Bill George. The layout was determined by Gephi’s “force atlas” algorithm. My understanding is that it pretends the connections are elastic bands — the stronger the connection the tauter the band — and then lets the physics take over. Manning and Harrison naturally end up close together because they are connected by a tight band. Urlacher sort of wants to be close to Manning, but there are tighter bands pulling him in other directions so he doesn’t get too close. He does get closer than Dan Fouts does, though.
[continue reading…]

{ 8 comments }