
It’s easy to make fun of Jeff Fisher, who has a reputation for being the very definition of mediocre. A search for “Jeff Fisher 7-9” on Twitter will send you down the rabbit hole. But do the numbers back it up? Is Fisher as average as it gets?
He has won 6 or 7 games in his last five seasons, and went 8-8 in the season before that. In 10 of his 20 full seasons as a head coach, he’s won 7 or 8 games. But Fisher did go 13-3 three times, and won double digit games three other times. So how do we measure how “Jeff Fisher” a coach is?
The key, I think, is being average. Mike Mularkey has a 4-21 record over the last 10 years. He went 2-14 with the Blaine Gabbert/Maurice Jones-Drew/Justin Blackmon Jaguars in 2012, and then 2-7 as the interim head coach for the Titans last year. We don’t want to count that as being “Jeff Fisher-like.”
So I came up with a formula to measure how far from .500 each coach was in each season, and gave more weight to extreme seasons. You can check this footnote for the fine print. [1]1) Calculate each head coach’s winning percentage in each season. For example, in 2015, Fisher’s team went 7-9, for a 0.4375 winning percentage. 2) Subtract that winning percentage from … Continue reading
As it turns out, Fisher was the 2nd most Jeff Fisher coach of the 50 men who have coached the most games. The least Jeff Fisher coach was Paul Brown, followed by George Seifert and Bill Belichick.
But the most Jeff Fisher coach? Any guesses? Here are some hints.
- Like Fisher, this coach has exactly 20 career full seasons as an NFL head coach.
- Fisher had three seasons with 13+ wins; this coach finished between 4-12 and 12-4 in 19 of 20 seasons.
- This coach went 6-10 an NFL record five times. In fact, Mike Ditka (three 6-10 seasons) is the only other head coach with more than two 6-10 seasons.
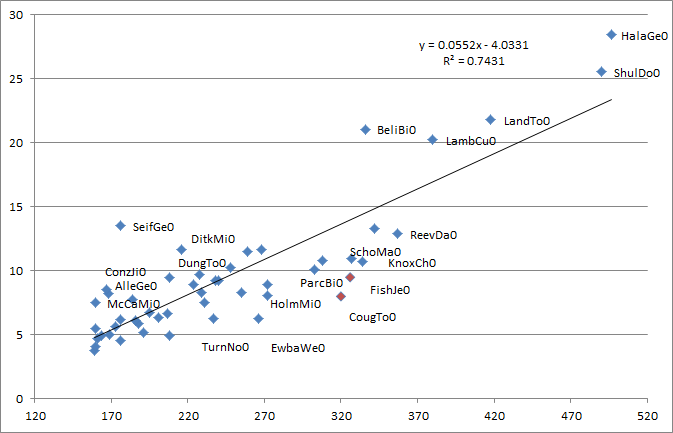
Give up? Why it’s Tom Coughlin, of course. The graph below shows the 50 head coaches who have coached the most pro football games in history. On the X-Axis is number of games; the Y-Axis displays the results of the methodology described above (which is so abstract a thing that I don’t even want to name it). The key, though, is the best-fit line. And no coach is farther from the line than Coughlin, with Fisher just behind him:
 Since Fisher and Coughlin have both coached for 20 full seasons (ignoring the six-game interim stint at the start of Fisher’s career), we can compare them without any tricky formula. Let’s just compare how many wins each coach was from 8 in each season. I will present this two ways: both squaring the difference (to give more credit to extreme seasons) and without.
| Coach | Year | Tm | Wins | Diff From 8 Wins | Diff Squared |
|---|---|---|---|---|---|
| Coughlin | 1999 | jax | 14 | 6 | 36 |
| Fisher | 2008 | oti | 13 | 5 | 25 |
| Fisher | 2000 | oti | 13 | 5 | 25 |
| Fisher | 1999 | oti | 13 | 5 | 25 |
| Fisher | 2005 | oti | 4 | -4 | 16 |
| Coughlin | 1995 | jax | 4 | -4 | 16 |
| Coughlin | 2008 | nyg | 12 | 4 | 16 |
| Fisher | 2003 | oti | 12 | 4 | 16 |
| Fisher | 2004 | oti | 5 | -3 | 9 |
| Coughlin | 2005 | nyg | 11 | 3 | 9 |
| Fisher | 2002 | oti | 11 | 3 | 9 |
| Coughlin | 1998 | jax | 11 | 3 | 9 |
| Coughlin | 1997 | jax | 11 | 3 | 9 |
| Coughlin | 2015 | nyg | 6 | -2 | 4 |
| Coughlin | 2014 | nyg | 6 | -2 | 4 |
| Fisher | 2014 | ram | 6 | -2 | 4 |
| Fisher | 2010 | oti | 6 | -2 | 4 |
| Coughlin | 2004 | nyg | 6 | -2 | 4 |
| Coughlin | 2002 | jax | 6 | -2 | 4 |
| Coughlin | 2001 | jax | 6 | -2 | 4 |
| Coughlin | 2010 | nyg | 10 | 2 | 4 |
| Coughlin | 2007 | nyg | 10 | 2 | 4 |
| Fisher | 2007 | oti | 10 | 2 | 4 |
| Coughlin | 2013 | nyg | 7 | -1 | 1 |
| Coughlin | 2000 | jax | 7 | -1 | 1 |
| Fisher | 2015 | ram | 7 | -1 | 1 |
| Fisher | 2013 | ram | 7 | -1 | 1 |
| Fisher | 2001 | oti | 7 | -1 | 1 |
| Fisher | 1995 | oti | 7 | -1 | 1 |
| Coughlin | 2012 | nyg | 9 | 1 | 1 |
| Coughlin | 2011 | nyg | 9 | 1 | 1 |
| Coughlin | 1996 | jax | 9 | 1 | 1 |
| Fisher | 2012 | ram | 7.5 | -0.5 | 0.25 |
| Coughlin | 2009 | nyg | 8 | 0 | 0 |
| Coughlin | 2006 | nyg | 8 | 0 | 0 |
| Fisher | 2009 | oti | 8 | 0 | 0 |
| Fisher | 2006 | oti | 8 | 0 | 0 |
| Fisher | 1998 | oti | 8 | 0 | 0 |
| Fisher | 1997 | oti | 8 | 0 | 0 |
| Fisher | 1996 | oti | 8 | 0 | 0 |
| Fisher | Total | 39.5 | 141.25 | ||
| Coughlin | Total | 42 | 128 |
As you can see, Fisher ends up with a higher number, which means his seasons were more extreme. However, that changes if we don’t square the differences. Fisher does have more seasons right at .500, but he also has those three 13-3 seasons. Ultimately, it’s those that make him look slightly less Jeff Fisher-like than Coughlin. I think two 6-10 seasons is more Jeff Fisher-like than an 8-8 season and a 4-12 season, which is why I chose to square the differences. But your mileage my vary.
Tom Coughlin, of course, is not going to be remembered in the same way that Fisher was. But he did finish between 6-10 and 10-6 in 70% of his seasons. Coughlin’s legacy will go down as being one of the best post-season coaches ever. When I ran the numbers three years ago, Coughlin had exceeded playoff expectations by a greater amount than all but one other coach in NFL history. Fortunately for Coughlin, he hasn’t made the playoffs since, so those numbers have not changed.
References
| ↑1 | 1) Calculate each head coach’s winning percentage in each season. For example, in 2015, Fisher’s team went 7-9, for a 0.4375 winning percentage.
2) Subtract that winning percentage from 0.500, and square the difference, to give more weight to extreme seasons. That produces a result of 0.004. Obviously an 8-8 season would produce a 0; a 10-6 season would yield 0.016. 3) Then, weight each season by the number of games played (to account for coaches who had partial seasons). 4) Then, get a career grade by summing the (games-weighted) result from each year. 5) Then, I took the 50 head coaches with the most career games, and created a best-fit formula to project the career differential based on games played. 6) Finally, subtract the expected result from the actual result to see how “Jeff Fisher” each coach is. |
|---|