
When the Los Angeles Chargers started the season 0-4, it was tempting to think that the season was over. But, as I cautioned, not all 0-4 teams are created equally. And while only one team had ever gone from 0-4 to the playoffs (ironically, the Chargers in 1992), that was a little misleading. Most 0-4 teams don’t make the playoffs because of the 0-4 start *and* because they are bad teams. But if the team is a good team, an 0-4 start is not necessarily a death sentence.
Los Angeles is proving that to be the case. Right now, the Chargers rank 7th in the NFL in Adjusted Net Yards per Attempt, and 4th in Adjusted Net Yards per Attempt allowed. The Chargers rank 3rd in the NFL in ANY/A Differential — the difference between those two statistics — and rank 1st in the AFC in that category. Take a look: Take a look: the Y-Axis shows each team’s winning percentage, while the X-Axis displays ANY/A differential.
| Rk | Team | ANY/A▼ | ANY/A All | Diff | Win % |
|---|---|---|---|---|---|
| 1 | Los Angeles Rams | 8.01 | 4.96 | 3.04 | 0.700 |
| 2 | Philadelphia Eagles | 7.59 | 4.74 | 2.86 | 0.900 |
| 3 | Los Angeles Chargers | 7.38 | 4.56 | 2.81 | 0.455 |
| 4 | Jacksonville Jaguars | 5.81 | 3.25 | 2.56 | 0.700 |
| 5 | New Orleans Saints | 7.95 | 5.46 | 2.50 | 0.800 |
| 6 | Minnesota Vikings | 7.46 | 5.16 | 2.30 | 0.818 |
| 7 | Pittsburgh Steelers | 6.61 | 4.35 | 2.26 | 0.800 |
| 8 | Atlanta Falcons | 7.00 | 5.67 | 1.33 | 0.600 |
| 9 | Seattle Seahawks | 6.65 | 5.39 | 1.26 | 0.600 |
| 10 | New England Patriots | 8.36 | 7.10 | 1.26 | 0.800 |
| 11 | Washington Redskins | 7.07 | 6.05 | 1.02 | 0.455 |
| 12 | Kansas City Chiefs | 7.39 | 6.49 | 0.90 | 0.600 |
| 13 | Cincinnati Bengals | 5.99 | 5.09 | 0.90 | 0.400 |
| 14 | Detroit Lions | 6.87 | 6.15 | 0.72 | 0.545 |
| 15 | Baltimore Ravens | 3.85 | 3.91 | -0.06 | 0.500 |
| 16 | Arizona Cardinals | 5.70 | 6.07 | -0.37 | 0.400 |
| 17 | New York Jets | 5.70 | 6.07 | -0.37 | 0.400 |
| 18 | Buffalo Bills | 5.19 | 5.68 | -0.49 | 0.500 |
| 19 | Carolina Panthers | 5.33 | 5.83 | -0.50 | 0.700 |
| 20 | Tampa Bay Buccaneers | 6.46 | 7.19 | -0.73 | 0.400 |
| 21 | Tennessee Titans | 4.98 | 6.05 | -1.07 | 0.600 |
| 22 | Houston Texans | 6.04 | 7.13 | -1.09 | 0.400 |
| 23 | Chicago Bears | 5.09 | 6.25 | -1.16 | 0.300 |
| 24 | Dallas Cowboys | 5.62 | 6.78 | -1.17 | 0.455 |
| 25 | Green Bay Packers | 4.95 | 6.65 | -1.71 | 0.500 |
| 26 | Indianapolis Colts | 5.47 | 7.32 | -1.85 | 0.300 |
| 27 | Denver Broncos | 4.50 | 6.58 | -2.08 | 0.300 |
| 28 | New York Giants | 5.12 | 7.21 | -2.09 | 0.182 |
| 29 | San Francisco 49ers | 4.73 | 7.09 | -2.37 | 0.100 |
| 30 | Oakland Raiders | 6.00 | 8.47 | -2.47 | 0.400 |
| 31 | Miami Dolphins | 4.82 | 7.45 | -2.63 | 0.400 |
| 32 | Cleveland Browns | 3.10 | 6.95 | -3.85 | 0.000 |
Of course, with a 5-6 record, it’s easy to see why the Chargers have been overlooked. But Los Angeles is the biggest outlier in the NFL when it comes to ANY/A Differential vs. Winning Percentage. Take a look:
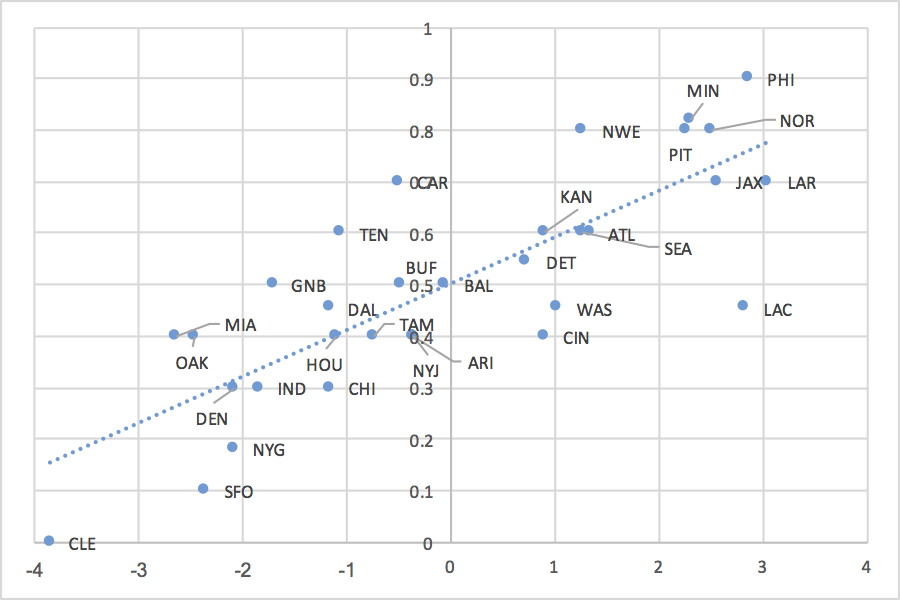
Los Angeles is third in ANY/A, but below-average in winning percentage. The Redskins and Bengals are the only other teams with positive ANY/A differentials but average or worse winning percentages. On the other side, the Titans and Panthers have “overachieved” in this category, along with the Patriots.
A few years ago, I wrote about where each Super Bowl champion ranked in a number of key metrics, including ANY/A differential. Other than record and Pythagorean record, the average Super Bowl champion ranked better in ANY/A differential than any other key metric. And last year, the top two teams in ANY/A differential met in the Super Bowl. At 5-6, the Chargers may not quite be a Super Bowl contender yet, but there are certainly in the running for biggest Super Bowl contender in history among teams that were below .500 entering December. Of course, while going from 0-4 to the playoffs is very Chargersesque, so is being a Super Bowl contender but missing the playoffs.