
The Carolina Panthers defense is really, really good. Let’s begin with the pass defense. Carolina has faced 444 pass attempts, and allowed 2,462 yards, 13 TDs, and 18 INTs. Carolina has also sacked opponents 33 times for 199 yards. That translates to an impressive 4.0 ANY/A allowed average, the best in the league. But let’s try to get a more precise measure of the passing game. First, we can add passing first downs: Carolina has allowed 134 of those (including the 13 TDs), so let’s add 9 yards for each non-TD first down allowed. Then, we should remove the 4 spikes the defense has faced. [1]Thanks to the great Bryan Frye, of The GridFe, for the spikes and kneels data. Now, Carolina has allowed 6.34 Adjusted ANY/A. That may not mean much in the abstract, so here’s some context: Denver has allowed 6.31 Adjusted ANY/A, and the Cardinals are 3rd at 7.27 ANY/A. The Chiefs, Jets, and Rams are the only other teams that have allowed less than 8 Adjusted ANY/A. So the Carolina pass defense has been pretty fantastic.
What about the run defense? Carolina has faced 255 rush attempts, and allowed 976 yards, 7 TDs, and 49 first downs. The Panthers are also the only team in the league that has not faced a kneel, but for every other defense, we need to back out those data as well. Therefore, using 20 yards per touchdown and 9 per (non-TD) first down, Carolina has allowed 5.86 Adjusted YPC this season. That’s the second best mark in the league, behind only Baltimore.
In the graph below, I’ve plotted each team’s defense. The X-Axis represents Adjusted ANY/A allowed, while the Y-Axis shows Adjusted YPC allowed. Given that I like to see the best units in the upper right corner, I have plotted all values in reverse order.
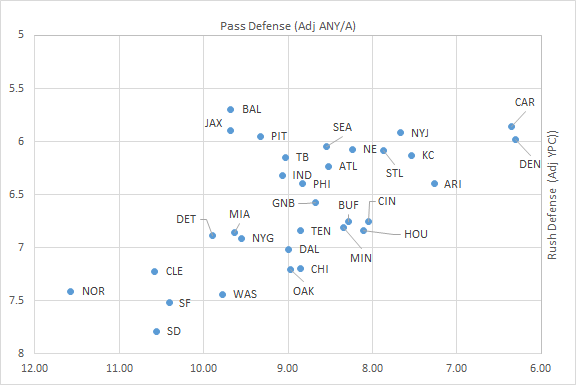 The Panthers and Broncos defenses obviously stand out far from the pack. Those two defenses are really, really good. What else stands out?
- The Ravens and Jaguars have two of the top three rush defenses by this metric, but that doesn’t mean all that much if you have a below-average pass defense, and these two teams rank 25th and 26th by Adjusted ANY/A.
- On the other side, Arizona (3rd in pass defense, 14th in rush), Cincinnati (7th, 18th), and Houston (8th, 20th).
- The Bears and Steelers are two teams that used to have great defenses but entered 2015 with a lot of defensive question marks. Pittsburgh, like Baltimore and Jacksonville, has been great against the run (ranking 5th) but not so good against the pas (22nd). Chicago is the opposite, ranking 16th against the pass but just 26th on the ground.
- Cleveland, San Francisco, New Orleans, and San Diego are all really, really bad on defense, against both the run and the pass.
- In that vein, the correlation coefficient between a team’s pass defense and rush defense, based on these ratings, is a very strong 0.60. Other than the outliers highlighted above, most teams are generally in the same ballpark in these two categories. That makes sense, because a defense that’s great against the run but bad against the pass, and vice-versa, can do some things to help balance things out (i.e., play mostly nickel and dime, call plays anticipating passes even in run-friendly situations, etc.). This is something I wrote about six years ago, and could probably use an offseason update.
Let’s do the same thing with the offense. Here, the correlation coefficient is a much lower 0.14. Teams like San Diego (5th in pass offense, 29th in rush offense), the Giants (8th, 28th), Cleveland (16th, 32nd), and Cincinnati (3rd, 18th) have been much more effective moving the ball through the air in 2015.

On the other hand, St. Louis (32nd in Adj. ANY/A, 8th in Adj. YPC), Minnesota (27th, 3rd), Miami (23rd, 6th), Buffalo (21st, 5th), Philadelphia (29th, 14th), and Seattle (13th, 1st) have been much more effective, relatively speaking, when it comes to running. And three teams –the Cardinals, Patriots, and Steelers — stand out for their success at moving the ball either way.
Finally, let’s look at all four metrics in one table. By adding each team’s offensive efficiency ratings in both passing and rushing, and then subtracting each team’s defensive ratings, we can create some overall ratings. Take a look:
| Rk | Team | Pass O | Rk P_O | Rush O | Rk R_O | Pass D | Rk P_D | Rush D | Rk R_D | Value |
|---|---|---|---|---|---|---|---|---|---|---|
| 1 | Arizona Cardinals | 11.86 | 1 | 6.97 | 10 | 7.27 | 3 | 6.40 | 14 | 5.16 |
| 2 | New England Patriots | 11.02 | 2 | 7.20 | 7 | 8.23 | 9 | 6.08 | 8 | 3.91 |
| 3 | Carolina Panthers | 9.28 | 11 | 6.79 | 15 | 6.34 | 2 | 5.86 | 2 | 3.86 |
| 4 | Kansas City Chiefs | 8.76 | 15 | 7.70 | 4 | 7.54 | 4 | 6.13 | 10 | 2.79 |
| 5 | Cincinnati Bengals | 10.56 | 3 | 6.65 | 18 | 8.05 | 7 | 6.75 | 18 | 2.40 |
| 6 | Seattle Seahawks | 9.06 | 13 | 7.87 | 1 | 8.55 | 13 | 6.04 | 7 | 2.34 |
| 7 | Pittsburgh Steelers | 9.46 | 7 | 7.81 | 2 | 9.32 | 22 | 5.95 | 5 | 2.00 |
| 8 | Atlanta Falcons | 9.28 | 10 | 7.01 | 9 | 8.52 | 12 | 6.23 | 12 | 1.54 |
| 9 | Tampa Bay Buccaneers | 9.39 | 9 | 6.93 | 11 | 9.03 | 20 | 6.15 | 11 | 1.14 |
| 10 | New York Jets | 8.33 | 22 | 6.39 | 20 | 7.67 | 5 | 5.92 | 4 | 1.13 |
| 11 | Denver Broncos | 7.40 | 31 | 5.98 | 25 | 6.31 | 1 | 5.98 | 6 | 1.09 |
| 12 | Buffalo Bills | 8.43 | 21 | 7.53 | 5 | 8.28 | 10 | 6.75 | 17 | 0.93 |
| 13 | St. Louis Rams | 7.39 | 32 | 7.13 | 8 | 7.87 | 6 | 6.09 | 9 | 0.57 |
| 14 | Green Bay Packers | 8.83 | 14 | 6.89 | 12 | 8.68 | 14 | 6.57 | 16 | 0.47 |
| 15 | Minnesota Vikings | 7.76 | 27 | 7.80 | 3 | 8.34 | 11 | 6.81 | 19 | 0.41 |
| 16 | Oakland Raiders | 9.59 | 6 | 6.60 | 19 | 8.97 | 18 | 7.21 | 27 | 0.01 |
| 17 | Baltimore Ravens | 7.95 | 24 | 6.72 | 16 | 9.68 | 25 | 5.70 | 1 | -0.71 |
| 18 | Miami Dolphins | 8.21 | 23 | 7.50 | 6 | 9.64 | 24 | 6.86 | 22 | -0.78 |
| 19 | Chicago Bears | 9.07 | 12 | 6.13 | 22 | 8.85 | 16 | 7.20 | 26 | -0.85 |
| 20 | Philadelphia Eagles | 7.49 | 29 | 6.83 | 14 | 8.83 | 15 | 6.40 | 15 | -0.90 |
| 21 | Houston Texans | 8.52 | 20 | 5.36 | 30 | 8.10 | 8 | 6.84 | 20 | -1.06 |
| 22 | Tennessee Titans | 8.60 | 17 | 6.03 | 24 | 8.86 | 17 | 6.84 | 21 | -1.07 |
| 23 | New York Giants | 9.40 | 8 | 5.77 | 28 | 9.55 | 23 | 6.91 | 24 | -1.29 |
| 24 | Dallas Cowboys | 7.77 | 26 | 6.71 | 17 | 8.99 | 19 | 7.02 | 25 | -1.53 |
| 25 | Indianapolis Colts | 7.61 | 28 | 6.15 | 21 | 9.07 | 21 | 6.32 | 13 | -1.64 |
| 26 | Jacksonville Jaguars | 7.93 | 25 | 5.84 | 26 | 9.68 | 26 | 5.90 | 3 | -1.81 |
| 27 | New Orleans Saints | 9.86 | 4 | 6.84 | 13 | 11.58 | 32 | 7.42 | 29 | -2.29 |
| 28 | Washington Redskins | 8.53 | 19 | 5.77 | 27 | 9.78 | 27 | 7.44 | 30 | -2.92 |
| 29 | San Diego Chargers | 9.69 | 5 | 5.63 | 29 | 10.56 | 30 | 7.79 | 32 | -3.03 |
| 30 | Detroit Lions | 8.57 | 18 | 5.11 | 31 | 9.90 | 28 | 6.88 | 23 | -3.10 |
| 31 | Cleveland Browns | 8.67 | 16 | 5.04 | 32 | 10.58 | 31 | 7.22 | 28 | -4.10 |
| 32 | San Francisco 49ers | 7.43 | 30 | 6.11 | 23 | 10.41 | 29 | 7.52 | 31 | -4.39 |
Not a lot of surprises here: the Cardinals, Patriots, and Panthers are the top three teams by this metric, and by most other metrics, too. The Kansas City Chiefs rate highly on the basis of a great rushing offense, a great pass defense, and solid play in the other two metrics. Meanwhile, the Chargers and Saints have great pass offenses but not much else.
What are your thoughts?
References
| ↑1 | Thanks to the great Bryan Frye, of The GridFe, for the spikes and kneels data. |
|---|