
Below is a scatter plot showing the Game Scripts (on the X-Axis) and pass ratio (on the Y-Axis) of every game so far this season. I have also provided a best-fit line:
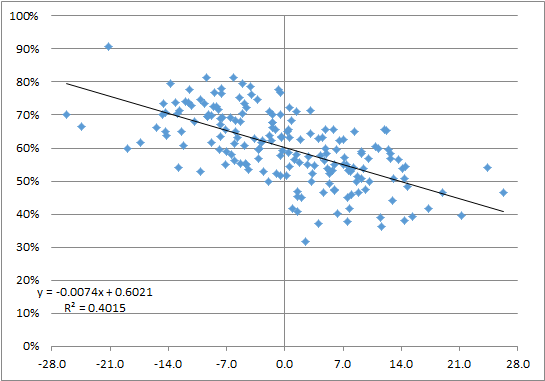
Unsurprisingly, there’s a negative correlation between Game Script and Pass Ratio. In general, teams are expected to pass about 3% less often for every 4 points of Game Script. In other words, based on six weeks worth of 2018 data, with a Game Script of +7.5, teams are expected to pass 54.7% of the time; at +11.5, the expected pass ratio would be 51.7%.
The table below shows the results from each game this season. It is sorted from most run-happy to least. The Bills/Titans game leads the way by a large margin. In that game, Buffalo had a Game Script of +2.5, which means you would expect the Bills to pass on 58.3% of plays; instead, Buffalo passed on just 31.7% of plays, a difference of 26.6%. That makes it the most run-heavy game of the year, which we wrote about at the time.
| Wk | Team | H/R | Opp | Boxscore | PF | PA | Margin | Game Script | W/L | Pass | Run | ExpPR | P/R Ratio | Diff |
|---|---|---|---|---|---|---|---|---|---|---|---|---|---|---|
| 5 | BUF | TEN | Boxscore | 13 | 12 | 1 | 2.5 | Win | 20 | 43 | 58.3% | 31.7% | 26.6% | |
| 3 | CAR | CIN | Boxscore | 31 | 21 | 10 | 4.1 | Win | 25 | 42 | 57.2% | 37.3% | 19.9% | |
| 3 | TEN | @ | JAX | Boxscore | 9 | 6 | 3 | 1.5 | Win | 24 | 35 | 59.1% | 40.7% | 18.4% |
| 5 | SEA | LAR | Boxscore | 31 | 33 | -2 | 0.9 | Loss | 23 | 32 | 59.5% | 41.8% | 17.7% | |
| 5 | NYJ | DEN | Boxscore | 34 | 16 | 18 | 7.6 | Win | 23 | 38 | 54.6% | 37.7% | 16.9% | |
| 3 | SFO | @ | KAN | Boxscore | 27 | 38 | -11 | -12.7 | Loss | 34 | 29 | 69.6% | 54% | 15.7% |
| 3 | WAS | GNB | Boxscore | 31 | 17 | 14 | 11.6 | Win | 20 | 35 | 51.6% | 36.4% | 15.3% | |
| 2 | TEN | HOU | Boxscore | 20 | 17 | 3 | 6.4 | Win | 23 | 34 | 55.5% | 40.4% | 15.2% | |
| 1 | HOU | @ | NWE | Boxscore | 20 | 27 | -7 | -10.1 | Loss | 38 | 34 | 67.7% | 52.8% | 14.9% |
| 4 | MIA | @ | NWE | Boxscore | 7 | 38 | -31 | -18.9 | Loss | 27 | 18 | 74.2% | 60% | 14.2% |
| 6 | SFO | @ | GNB | Boxscore | 30 | 33 | -3 | 1.5 | Loss | 25 | 30 | 59.1% | 45.5% | 13.6% |
| 4 | SEA | @ | ARI | Boxscore | 20 | 17 | 3 | 2 | Win | 28 | 34 | 58.7% | 45.2% | 13.6% |
| 1 | NYJ | @ | DET | Boxscore | 48 | 17 | 31 | 11.5 | Win | 23 | 36 | 51.7% | 39% | 12.7% |
| 3 | SEA | DAL | Boxscore | 24 | 13 | 11 | 7.8 | Win | 28 | 39 | 54.5% | 41.8% | 12.7% | |
| 4 | DAL | DET | Boxscore | 26 | 24 | 2 | 1.6 | Win | 31 | 35 | 59.1% | 47% | 12.1% | |
| 4 | ARI | SEA | Boxscore | 17 | 20 | -3 | -2 | Loss | 28 | 28 | 61.7% | 50% | 11.7% | |
| 6 | LAC | @ | CLE | Boxscore | 38 | 14 | 24 | 14.3 | Win | 22 | 36 | 49.6% | 37.9% | 11.7% |
| 1 | BUF | @ | BAL | Boxscore | 3 | 47 | -44 | -24.4 | Loss | 40 | 20 | 78.3% | 66.7% | 11.6% |
| 6 | JAX | @ | DAL | Boxscore | 7 | 40 | -33 | -17.3 | Loss | 29 | 18 | 73% | 61.7% | 11.3% |
| 3 | CHI | @ | ARI | Boxscore | 16 | 14 | 2 | -7.1 | Win | 38 | 31 | 65.4% | 55.1% | 10.4% |
| 2 | ATL | CAR | Boxscore | 31 | 24 | 7 | 4.7 | Win | 28 | 32 | 56.8% | 46.7% | 10.1% | |
| 6 | BUF | @ | HOU | Boxscore | 13 | 20 | -7 | -4.3 | Loss | 31 | 27 | 63.4% | 53.4% | 10% |
| 4 | TAM | @ | CHI | Boxscore | 10 | 48 | -38 | -26.3 | Loss | 42 | 18 | 79.6% | 70% | 9.6% |
| 6 | SEA | @ | OAK | Boxscore | 27 | 3 | 24 | 15.4 | Win | 24 | 37 | 48.8% | 39.3% | 9.5% |
| 1 | TAM | @ | NOR | Boxscore | 48 | 40 | 8 | 7.6 | Win | 28 | 34 | 54.6% | 45.2% | 9.5% |
| 5 | TEN | @ | BUF | Boxscore | 12 | 13 | -1 | -2.5 | Loss | 28 | 25 | 62.1% | 52.8% | 9.3% |
| 6 | CHI | @ | MIA | Boxscore | 28 | 31 | -3 | -0.5 | Loss | 33 | 31 | 60.6% | 51.6% | 9% |
| 3 | CLE | NYJ | Boxscore | 21 | 17 | 4 | -5.4 | Win | 41 | 33 | 64.2% | 55.4% | 8.8% | |
| 6 | NYJ | IND | Boxscore | 42 | 34 | 8 | 5.9 | Win | 32 | 36 | 55.8% | 47.1% | 8.8% | |
| 2 | NWE | @ | JAX | Boxscore | 20 | 31 | -11 | -12.2 | Loss | 37 | 24 | 69.3% | 60.7% | 8.6% |
| 5 | LAR | @ | SEA | Boxscore | 33 | 31 | 2 | -0.9 | Win | 33 | 30 | 60.9% | 52.4% | 8.5% |
| 6 | LAR | @ | DEN | Boxscore | 23 | 20 | 3 | 8 | Win | 33 | 39 | 54.3% | 45.8% | 8.5% |
| 5 | CIN | MIA | Boxscore | 27 | 17 | 10 | -4.6 | Win | 32 | 26 | 63.6% | 55.2% | 8.4% | |
| 1 | CLE | PIT | Boxscore | 21 | 21 | 0 | -4.7 | Tie | 47 | 38 | 63.7% | 55.3% | 8.4% | |
| 2 | DEN | OAK | Boxscore | 20 | 19 | 1 | -6 | Win | 36 | 28 | 64.7% | 56.3% | 8.4% | |
| 5 | DAL | @ | HOU | Boxscore | 16 | 19 | -3 | 0.2 | Loss | 31 | 29 | 60% | 51.7% | 8.4% |
| 1 | CAR | DAL | Boxscore | 16 | 8 | 8 | 6 | Win | 29 | 32 | 55.8% | 47.5% | 8.2% | |
| 1 | MIA | TEN | Boxscore | 27 | 20 | 7 | 3.2 | Win | 29 | 29 | 57.8% | 50% | 7.8% | |
| 2 | MIA | @ | NYJ | Boxscore | 20 | 12 | 8 | 8.9 | Win | 27 | 31 | 53.7% | 46.6% | 7.1% |
| 6 | NWE | KAN | Boxscore | 43 | 40 | 3 | 5.4 | Win | 37 | 38 | 56.2% | 49.3% | 6.9% | |
| 2 | HOU | @ | TEN | Boxscore | 17 | 20 | -3 | -6.4 | Loss | 36 | 26 | 64.9% | 58.1% | 6.8% |
| 2 | BUF | LAC | Boxscore | 20 | 31 | -11 | -14.2 | Loss | 39 | 22 | 70.7% | 63.9% | 6.8% | |
| 1 | WAS | @ | ARI | Boxscore | 24 | 6 | 18 | 12.9 | Win | 33 | 42 | 50.6% | 44% | 6.6% |
| 3 | NWE | @ | DET | Boxscore | 10 | 26 | -16 | -7.9 | Loss | 28 | 19 | 66% | 59.6% | 6.4% |
| 1 | SFO | @ | MIN | Boxscore | 16 | 24 | -8 | -7.1 | Loss | 36 | 25 | 65.4% | 59% | 6.4% |
| 1 | TEN | @ | MIA | Boxscore | 20 | 27 | -7 | -3.2 | Loss | 38 | 29 | 62.6% | 56.7% | 5.9% |
| 6 | DAL | JAX | Boxscore | 40 | 7 | 33 | 17.3 | Win | 30 | 42 | 47.4% | 41.7% | 5.7% | |
| 2 | ARI | @ | LAR | Boxscore | 0 | 34 | -34 | -14.4 | Loss | 28 | 15 | 70.9% | 65.1% | 5.7% |
| 5 | LAC | OAK | Boxscore | 26 | 10 | 16 | 9.7 | Win | 28 | 31 | 53% | 47.5% | 5.6% | |
| 6 | OAK | SEA | Boxscore | 3 | 27 | -24 | -15.4 | Loss | 37 | 19 | 71.6% | 66.1% | 5.5% | |
| 4 | NOR | @ | NYG | Boxscore | 33 | 18 | 15 | 3.3 | Win | 35 | 32 | 57.7% | 52.2% | 5.5% |
| 3 | PHI | IND | Boxscore | 20 | 16 | 4 | 0.5 | Win | 42 | 35 | 59.8% | 54.5% | 5.3% | |
| 3 | LAC | @ | LAR | Boxscore | 23 | 35 | -12 | -8.8 | Loss | 32 | 20 | 66.7% | 61.5% | 5.2% |
| 3 | BUF | @ | MIN | Boxscore | 27 | 6 | 21 | 21.2 | Win | 25 | 38 | 44.5% | 39.7% | 4.8% |
| 6 | TEN | BAL | Boxscore | 0 | 21 | -21 | -12.5 | Loss | 26 | 14 | 69.4% | 65% | 4.4% | |
| 3 | NYJ | @ | CLE | Boxscore | 17 | 21 | -4 | 5.4 | Loss | 33 | 30 | 56.2% | 52.4% | 3.9% |
| 5 | PIT | ATL | Boxscore | 41 | 17 | 24 | 8.6 | Win | 29 | 29 | 53.8% | 50% | 3.8% | |
| 1 | DEN | SEA | Boxscore | 27 | 24 | 3 | 1.8 | Win | 40 | 32 | 58.9% | 55.6% | 3.3% | |
| 1 | DAL | @ | CAR | Boxscore | 8 | 16 | -8 | -6 | Loss | 35 | 22 | 64.7% | 61.4% | 3.3% |
| 2 | CLE | @ | NOR | Boxscore | 18 | 21 | -3 | 2.7 | Loss | 33 | 27 | 58.2% | 55% | 3.2% |
| 3 | DEN | @ | BAL | Boxscore | 14 | 27 | -13 | -4.9 | Loss | 37 | 24 | 63.8% | 60.7% | 3.1% |
| 5 | ARI | @ | SFO | Boxscore | 28 | 18 | 10 | 5.7 | Win | 26 | 23 | 56% | 53.1% | 2.9% |
| 2 | SFO | DET | Boxscore | 30 | 27 | 3 | 5.4 | Win | 32 | 28 | 56.2% | 53.3% | 2.9% | |
| 4 | LAC | SFO | Boxscore | 29 | 27 | 2 | -3.1 | Win | 40 | 27 | 62.5% | 59.7% | 2.8% | |
| 1 | PHI | ATL | Boxscore | 18 | 12 | 6 | -0.5 | Win | 37 | 27 | 60.6% | 57.8% | 2.8% | |
| 1 | LAR | @ | OAK | Boxscore | 33 | 13 | 20 | 1.1 | Win | 34 | 26 | 59.4% | 56.7% | 2.7% |
| 2 | DAL | NYG | Boxscore | 20 | 13 | 7 | 10.1 | Win | 25 | 25 | 52.7% | 50% | 2.7% | |
| 5 | CAR | NYG | Boxscore | 33 | 31 | 2 | 5.1 | Win | 36 | 31 | 56.4% | 53.7% | 2.7% | |
| 1 | JAX | @ | NYG | Boxscore | 20 | 15 | 5 | 3.6 | Win | 34 | 28 | 57.5% | 54.8% | 2.7% |
| 1 | CIN | @ | IND | Boxscore | 34 | 23 | 11 | -3.1 | Win | 30 | 20 | 62.5% | 60% | 2.5% |
| 1 | KAN | @ | LAC | Boxscore | 38 | 28 | 10 | 9.2 | Win | 28 | 27 | 53.4% | 50.9% | 2.5% |
| 3 | LAR | LAC | Boxscore | 35 | 23 | 12 | 8.8 | Win | 37 | 35 | 53.7% | 51.4% | 2.3% | |
| 6 | ARI | @ | MIN | Boxscore | 17 | 27 | -10 | -7.7 | Loss | 35 | 20 | 65.9% | 63.6% | 2.3% |
| 3 | DET | NWE | Boxscore | 26 | 10 | 16 | 7.9 | Win | 37 | 33 | 54.4% | 52.9% | 1.5% | |
| 5 | SFO | ARI | Boxscore | 18 | 28 | -10 | -5.7 | Loss | 58 | 34 | 64.5% | 63% | 1.4% | |
| 6 | MIA | CHI | Boxscore | 31 | 28 | 3 | 0.5 | Win | 44 | 31 | 59.8% | 58.7% | 1.2% | |
| 2 | IND | @ | WAS | Boxscore | 21 | 9 | 12 | 7.7 | Win | 32 | 28 | 54.5% | 53.3% | 1.2% |
| 5 | HOU | DAL | Boxscore | 19 | 16 | 3 | -0.2 | Win | 45 | 31 | 60.4% | 59.2% | 1.2% | |
| 5 | WAS | @ | NOR | Boxscore | 19 | 43 | -24 | -14.7 | Loss | 42 | 18 | 71.1% | 70% | 1.1% |
| 4 | CLE | @ | OAK | Boxscore | 42 | 45 | -3 | 1.4 | Loss | 43 | 31 | 59.1% | 58.1% | 1% |
| 5 | NOR | WAS | Boxscore | 43 | 19 | 24 | 14.7 | Win | 30 | 32 | 49.3% | 48.4% | 0.9% | |
| 6 | MIN | ARI | Boxscore | 27 | 17 | 10 | 7.7 | Win | 37 | 32 | 54.5% | 53.6% | 0.9% | |
| 3 | OAK | @ | MIA | Boxscore | 20 | 28 | -8 | 2.8 | Loss | 43 | 32 | 58.1% | 57.3% | 0.8% |
| 3 | MIA | OAK | Boxscore | 28 | 20 | 8 | -2.8 | Win | 24 | 15 | 62.3% | 61.5% | 0.8% | |
| 2 | OAK | @ | DEN | Boxscore | 19 | 20 | -1 | 6 | Loss | 33 | 27 | 55.8% | 55% | 0.8% |
| 1 | PIT | @ | CLE | Boxscore | 21 | 21 | 0 | 4.7 | Tie | 45 | 35 | 56.7% | 56.3% | 0.5% |
| 2 | PHI | @ | TAM | Boxscore | 21 | 27 | -6 | -10.9 | Loss | 51 | 24 | 68.3% | 68% | 0.3% |
| 1 | MIN | SFO | Boxscore | 24 | 16 | 8 | 7.1 | Win | 39 | 32 | 55% | 54.9% | 0.1% | |
| 4 | JAX | NYJ | Boxscore | 31 | 12 | 19 | 8.2 | Win | 40 | 34 | 54.1% | 54.1% | 0.1% | |
| 6 | CLE | LAC | Boxscore | 14 | 38 | -24 | -14.3 | Loss | 51 | 21 | 70.8% | 70.8% | 0% | |
| 1 | NYG | JAX | Boxscore | 15 | 20 | -5 | -3.6 | Loss | 39 | 23 | 62.9% | 62.9% | 0% | |
| 2 | NOR | CLE | Boxscore | 21 | 18 | 3 | -2.7 | Win | 38 | 23 | 62.2% | 62.3% | -0.1% | |
| 2 | SEA | @ | CHI | Boxscore | 17 | 24 | -7 | -7.1 | Loss | 42 | 22 | 65.5% | 65.6% | -0.1% |
| 3 | NYG | @ | HOU | Boxscore | 27 | 22 | 5 | 7.5 | Win | 33 | 27 | 54.7% | 55% | -0.3% |
| 5 | DET | GNB | Boxscore | 31 | 23 | 8 | 13.1 | Win | 29 | 28 | 50.5% | 50.9% | -0.4% | |
| 4 | NWE | MIA | Boxscore | 38 | 7 | 31 | 18.9 | Win | 35 | 40 | 46.2% | 46.7% | -0.5% | |
| 2 | KAN | @ | PIT | Boxscore | 42 | 37 | 5 | 9.4 | Win | 29 | 25 | 53.2% | 53.7% | -0.5% |
| 6 | IND | @ | NYJ | Boxscore | 34 | 42 | -8 | -5.9 | Loss | 43 | 23 | 64.6% | 65.2% | -0.5% |
| 1 | ARI | WAS | Boxscore | 6 | 24 | -18 | -12.9 | Loss | 36 | 15 | 69.8% | 70.6% | -0.8% | |
| 6 | HOU | BUF | Boxscore | 20 | 13 | 7 | 4.3 | Win | 33 | 24 | 57% | 57.9% | -0.9% | |
| 4 | DET | @ | DAL | Boxscore | 24 | 26 | -2 | -1.6 | Loss | 33 | 20 | 61.4% | 62.3% | -0.9% |
| 2 | LAR | ARI | Boxscore | 34 | 0 | 34 | 14.4 | Win | 34 | 33 | 49.6% | 50.7% | -1.2% | |
| 3 | DAL | @ | SEA | Boxscore | 13 | 24 | -11 | -7.8 | Loss | 39 | 19 | 66% | 67.2% | -1.3% |
| 4 | BUF | @ | GNB | Boxscore | 0 | 22 | -22 | -12.7 | Loss | 40 | 16 | 69.6% | 71.4% | -1.9% |
| 4 | HOU | @ | IND | Boxscore | 37 | 34 | 3 | 5.1 | Win | 49 | 35 | 56.5% | 58.3% | -1.9% |
| 2 | CHI | SEA | Boxscore | 24 | 17 | 7 | 7.1 | Win | 36 | 27 | 54.9% | 57.1% | -2.2% | |
| 4 | KAN | @ | DEN | Boxscore | 27 | 23 | 4 | -1.8 | Win | 46 | 26 | 61.6% | 63.9% | -2.3% |
| 1 | GNB | CHI | Boxscore | 24 | 23 | 1 | -9.3 | Win | 41 | 18 | 67.1% | 69.5% | -2.4% | |
| 6 | CAR | @ | WAS | Boxscore | 17 | 23 | -6 | -9.2 | Loss | 41 | 18 | 67% | 69.5% | -2.4% |
| 6 | NYG | PHI | Boxscore | 13 | 34 | -21 | -14.5 | Loss | 47 | 17 | 71% | 73.4% | -2.5% | |
| 3 | ATL | NOR | Boxscore | 37 | 43 | -6 | -0.3 | Loss | 38 | 22 | 60.5% | 63.3% | -2.9% | |
| 2 | NYJ | MIA | Boxscore | 12 | 20 | -8 | -8.9 | Loss | 44 | 19 | 66.8% | 69.8% | -3.1% | |
| 2 | WAS | IND | Boxscore | 9 | 21 | -12 | -7.7 | Loss | 49 | 22 | 65.9% | 69% | -3.1% | |
| 4 | ATL | CIN | Boxscore | 36 | 37 | -1 | -0.4 | Loss | 42 | 24 | 60.5% | 63.6% | -3.1% | |
| 1 | LAC | KAN | Boxscore | 28 | 38 | -10 | -9.2 | Loss | 52 | 22 | 67% | 70.3% | -3.2% | |
| 5 | CLE | BAL | Boxscore | 12 | 9 | 3 | 0.6 | Win | 48 | 28 | 59.8% | 63.2% | -3.4% | |
| 3 | BAL | DEN | Boxscore | 27 | 14 | 13 | 4.9 | Win | 42 | 28 | 56.6% | 60% | -3.4% | |
| 3 | HOU | NYG | Boxscore | 22 | 27 | -5 | -7.5 | Loss | 43 | 19 | 65.7% | 69.4% | -3.6% | |
| 6 | TAM | @ | ATL | Boxscore | 29 | 34 | -5 | -5.9 | Loss | 43 | 20 | 64.6% | 68.3% | -3.7% |
| 6 | KAN | @ | NWE | Boxscore | 40 | 43 | -3 | -5.4 | Loss | 36 | 17 | 64.2% | 67.9% | -3.7% |
| 5 | GNB | @ | DET | Boxscore | 23 | 31 | -8 | -13.1 | Loss | 56 | 20 | 69.9% | 73.7% | -3.8% |
| 4 | BAL | @ | PIT | Boxscore | 26 | 14 | 12 | 6.2 | Win | 44 | 30 | 55.6% | 59.5% | -3.8% |
| 4 | DEN | KAN | Boxscore | 23 | 27 | -4 | 1.8 | Loss | 37 | 22 | 58.8% | 62.7% | -3.9% | |
| 2 | LAC | @ | BUF | Boxscore | 31 | 20 | 11 | 14.2 | Win | 29 | 25 | 49.7% | 53.7% | -4% |
| 5 | PHI | MIN | Boxscore | 21 | 23 | -2 | -6.5 | Loss | 38 | 17 | 65.1% | 69.1% | -4% | |
| 1 | NWE | HOU | Boxscore | 27 | 20 | 7 | 10.1 | Win | 41 | 31 | 52.7% | 56.9% | -4.2% | |
| 2 | BAL | @ | CIN | Boxscore | 23 | 34 | -11 | -11.2 | Loss | 59 | 22 | 68.5% | 72.8% | -4.3% |
| 1 | OAK | LAR | Boxscore | 13 | 33 | -20 | -1.1 | Loss | 42 | 22 | 61% | 65.6% | -4.6% | |
| 3 | JAX | TEN | Boxscore | 6 | 9 | -3 | -1.5 | Loss | 37 | 19 | 61.3% | 66.1% | -4.8% | |
| 6 | WAS | CAR | Boxscore | 23 | 17 | 6 | 9.2 | Win | 39 | 28 | 53.4% | 58.2% | -4.8% | |
| 6 | PHI | @ | NYG | Boxscore | 34 | 13 | 21 | 14.5 | Win | 37 | 31 | 49.5% | 54.4% | -5% |
| 3 | NOR | @ | ATL | Boxscore | 43 | 37 | 6 | 0.3 | Win | 50 | 27 | 60% | 64.9% | -5% |
| 5 | IND | @ | NWE | Boxscore | 24 | 38 | -14 | -12 | Loss | 60 | 21 | 69.1% | 74.1% | -5% |
| 3 | GNB | @ | WAS | Boxscore | 17 | 31 | -14 | -11.6 | Loss | 48 | 17 | 68.8% | 73.8% | -5.1% |
| 6 | DEN | LAR | Boxscore | 20 | 23 | -3 | -8 | Loss | 43 | 17 | 66.1% | 71.7% | -5.6% | |
| 4 | LAR | MIN | Boxscore | 38 | 31 | 7 | 4 | Win | 34 | 20 | 57.3% | 63% | -5.7% | |
| 1 | CHI | @ | GNB | Boxscore | 23 | 24 | -1 | 9.3 | Loss | 39 | 27 | 53.4% | 59.1% | -5.7% |
| 4 | CIN | @ | ATL | Boxscore | 37 | 36 | 1 | 0.4 | Win | 44 | 23 | 59.9% | 65.7% | -5.8% |
| 4 | CHI | TAM | Boxscore | 48 | 10 | 38 | 26.3 | Win | 27 | 31 | 40.8% | 46.6% | -5.8% | |
| 5 | ATL | @ | PIT | Boxscore | 17 | 41 | -24 | -8.6 | Loss | 50 | 19 | 66.6% | 72.5% | -5.9% |
| 4 | GNB | BUF | Boxscore | 22 | 0 | 22 | 12.7 | Win | 42 | 32 | 50.8% | 56.8% | -5.9% | |
| 5 | OAK | @ | LAC | Boxscore | 10 | 26 | -16 | -9.7 | Loss | 36 | 13 | 67.4% | 73.5% | -6.1% |
| 4 | NYJ | @ | JAX | Boxscore | 12 | 31 | -19 | -8.2 | Loss | 37 | 14 | 66.3% | 72.5% | -6.2% |
| 4 | TEN | PHI | Boxscore | 26 | 23 | 3 | -1.4 | Win | 46 | 22 | 61.3% | 67.6% | -6.4% | |
| 5 | NYG | @ | CAR | Boxscore | 31 | 33 | -2 | -5.1 | Loss | 38 | 16 | 64% | 70.4% | -6.4% |
| 5 | KAN | JAX | Boxscore | 30 | 14 | 16 | 13.7 | Win | 39 | 30 | 50.1% | 56.5% | -6.4% | |
| 4 | SFO | @ | LAC | Boxscore | 27 | 29 | -2 | 3.1 | Loss | 38 | 21 | 57.9% | 64.4% | -6.5% |
| 4 | OAK | CLE | Boxscore | 45 | 42 | 3 | -1.4 | Win | 61 | 29 | 61.3% | 67.8% | -6.5% | |
| 5 | MIA | @ | CIN | Boxscore | 17 | 27 | -10 | 4.6 | Loss | 38 | 22 | 56.8% | 63.3% | -6.5% |
| 2 | NYG | @ | DAL | Boxscore | 13 | 20 | -7 | -10.1 | Loss | 50 | 17 | 67.7% | 74.6% | -6.9% |
| 5 | MIN | @ | PHI | Boxscore | 23 | 21 | 2 | 6.5 | Win | 38 | 23 | 55.4% | 62.3% | -6.9% |
| 3 | KAN | SFO | Boxscore | 38 | 27 | 11 | 12.7 | Win | 39 | 28 | 50.8% | 58.2% | -7.4% | |
| 3 | ARI | CHI | Boxscore | 14 | 16 | -2 | 7.1 | Loss | 30 | 18 | 55% | 62.5% | -7.5% | |
| 2 | CIN | BAL | Boxscore | 34 | 23 | 11 | 11.2 | Win | 42 | 28 | 51.9% | 60% | -8.1% | |
| 2 | TAM | PHI | Boxscore | 27 | 21 | 6 | 10.9 | Win | 35 | 23 | 52.2% | 60.3% | -8.2% | |
| 6 | PIT | @ | CIN | Boxscore | 28 | 21 | 7 | 0.8 | Win | 45 | 21 | 59.6% | 68.2% | -8.6% |
| 2 | CAR | @ | ATL | Boxscore | 24 | 31 | -7 | -4.7 | Loss | 47 | 18 | 63.7% | 72.3% | -8.7% |
| 6 | GNB | SFO | Boxscore | 33 | 30 | 3 | -1.5 | Win | 49 | 21 | 61.3% | 70% | -8.7% | |
| 6 | BAL | @ | TEN | Boxscore | 21 | 0 | 21 | 12.5 | Win | 37 | 25 | 51% | 59.7% | -8.7% |
| 1 | DET | NYJ | Boxscore | 17 | 48 | -31 | -11.5 | Loss | 52 | 15 | 68.7% | 77.6% | -8.9% | |
| 2 | GNB | MIN | Boxscore | 29 | 29 | 0 | 4.8 | Tie | 46 | 24 | 56.6% | 65.7% | -9.1% | |
| 5 | JAX | @ | KAN | Boxscore | 14 | 30 | -16 | -13.7 | Loss | 66 | 17 | 70.3% | 79.5% | -9.2% |
| 1 | SEA | @ | DEN | Boxscore | 24 | 27 | -3 | -1.8 | Loss | 39 | 16 | 61.5% | 70.9% | -9.4% |
| 5 | BAL | @ | CLE | Boxscore | 9 | 12 | -3 | -0.6 | Loss | 59 | 25 | 60.6% | 70.2% | -9.6% |
| 2 | MIN | @ | GNB | Boxscore | 29 | 29 | 0 | -4.8 | Tie | 50 | 18 | 63.8% | 73.5% | -9.7% |
| 6 | ATL | TAM | Boxscore | 34 | 29 | 5 | 5.9 | Win | 42 | 22 | 55.9% | 65.6% | -9.8% | |
| 3 | TAM | PIT | Boxscore | 27 | 30 | -3 | -8.4 | Loss | 53 | 16 | 66.4% | 76.8% | -10.4% | |
| 5 | DEN | @ | NYJ | Boxscore | 16 | 34 | -18 | -7.6 | Loss | 55 | 17 | 65.8% | 76.4% | -10.6% |
| 3 | PIT | @ | TAM | Boxscore | 30 | 27 | 3 | 8.4 | Win | 41 | 22 | 54% | 65.1% | -11.1% |
| 2 | DET | @ | SFO | Boxscore | 27 | 30 | -3 | -5.4 | Loss | 55 | 18 | 64.2% | 75.3% | -11.1% |
| 4 | NYG | NOR | Boxscore | 18 | 33 | -15 | -3.3 | Loss | 44 | 15 | 62.7% | 74.6% | -11.9% | |
| 1 | BAL | BUF | Boxscore | 47 | 3 | 44 | 24.4 | Win | 40 | 34 | 42.1% | 54.1% | -11.9% | |
| 4 | PHI | @ | TEN | Boxscore | 23 | 26 | -3 | 1.4 | Loss | 54 | 22 | 59.1% | 71.1% | -11.9% |
| 1 | NOR | TAM | Boxscore | 40 | 48 | -8 | -7.6 | Loss | 46 | 13 | 65.8% | 78% | -12.2% | |
| 1 | ATL | @ | PHI | Boxscore | 12 | 18 | -6 | 0.5 | Loss | 47 | 18 | 59.8% | 72.3% | -12.5% |
| 4 | MIN | @ | LAR | Boxscore | 31 | 38 | -7 | -4 | Loss | 54 | 17 | 63.2% | 76.1% | -12.9% |
| 1 | IND | CIN | Boxscore | 23 | 34 | -11 | 3.1 | Loss | 55 | 22 | 57.9% | 71.4% | -13.5% | |
| 2 | JAX | NWE | Boxscore | 31 | 20 | 11 | 12.2 | Win | 45 | 24 | 51.2% | 65.2% | -14.1% | |
| 2 | PIT | KAN | Boxscore | 37 | 42 | -5 | -9.4 | Loss | 61 | 14 | 67.2% | 81.3% | -14.1% | |
| 5 | NWE | IND | Boxscore | 38 | 24 | 14 | 12 | Win | 44 | 23 | 51.3% | 65.7% | -14.3% | |
| 3 | MIN | BUF | Boxscore | 6 | 27 | -21 | -21.2 | Loss | 59 | 6 | 75.9% | 90.8% | -14.9% | |
| 3 | CIN | @ | CAR | Boxscore | 21 | 31 | -10 | -4.1 | Loss | 48 | 13 | 63.2% | 78.7% | -15.5% |
| 4 | IND | HOU | Boxscore | 34 | 37 | -3 | -5.1 | Loss | 66 | 17 | 64% | 79.5% | -15.6% | |
| 3 | IND | @ | PHI | Boxscore | 16 | 20 | -4 | -0.5 | Loss | 43 | 13 | 60.6% | 76.8% | -16.2% |
| 4 | PIT | BAL | Boxscore | 14 | 26 | -12 | -6.2 | Loss | 48 | 11 | 64.8% | 81.4% | -16.6% | |
| 6 | CIN | PIT | Boxscore | 21 | 28 | -7 | -0.8 | Loss | 45 | 13 | 60.8% | 77.6% | -16.8% |
And finally, here are the full season ratings. The Bills, Titans, Seahawks, 49ers, and Jets are the five most run-heavy teams this season. Meanwhile, the AFC North has three of the most pass-happy teams in the NFL:
| Rk | Team | G | Avg GS | Avg Pass Ratio | Exp Pass Ratio | Rush Identity |
|---|---|---|---|---|---|---|
| 1 | BUF | 6 | -5.3 | 54.5% | 64.1% | 9.6% |
| 2 | TEN | 6 | -2 | 53.9% | 61.7% | 7.8% |
| 3 | SEA | 6 | 2.9 | 50.8% | 58.1% | 7.3% |
| 4 | SFO | 6 | -2.6 | 56.5% | 62.1% | 5.6% |
| 5 | NYJ | 6 | 2.2 | 53.1% | 58.6% | 5.5% |
| 6 | DAL | 6 | 2.6 | 53.2% | 58.3% | 5.2% |
| 7 | MIA | 6 | -0.8 | 56.7% | 60.8% | 4.1% |
| 8 | CAR | 5 | 0.3 | 56.1% | 60% | 3.9% |
| 9 | WAS | 5 | 2.3 | 55.5% | 58.5% | 3% |
| 10 | CLE | 6 | -3.3 | 59.6% | 62.6% | 3% |
| 11 | LAC | 6 | 2.8 | 55.1% | 58.1% | 3% |
| 12 | HOU | 6 | -2.5 | 59.3% | 62% | 2.8% |
| 13 | LAR | 6 | 5.9 | 53.3% | 55.9% | 2.5% |
| 14 | ARI | 6 | -4 | 60.8% | 63.2% | 2.4% |
| 15 | CHI | 5 | 7 | 53.9% | 55% | 1.1% |
| 16 | NWE | 6 | 4.4 | 56.5% | 57% | 0.5% |
| 17 | TAM | 5 | -4.4 | 64.1% | 63.5% | -0.6% |
| 18 | DEN | 6 | -3.8 | 63.9% | 63% | -0.9% |
| 19 | OAK | 6 | -3.1 | 64.2% | 62.5% | -1.7% |
| 20 | PHI | 6 | -0.2 | 62.5% | 60.4% | -2.1% |
| 21 | NOR | 5 | 1.6 | 61.2% | 59% | -2.2% |
| 22 | JAX | 6 | -1.4 | 63.6% | 61.2% | -2.3% |
| 23 | KAN | 6 | 6.3 | 58.5% | 55.5% | -3% |
| 24 | DET | 5 | 0.5 | 63.8% | 59.8% | -4% |
| 25 | ATL | 6 | 0.3 | 64% | 60% | -4% |
| 26 | NYG | 6 | -4.9 | 68.5% | 63.8% | -4.7% |
| 27 | GNB | 6 | -3 | 68.2% | 62.4% | -5.8% |
| 28 | CIN | 6 | -0.1 | 66.2% | 60.3% | -5.9% |
| 29 | BAL | 6 | 6 | 62.7% | 55.8% | -7% |
| 30 | MIN | 6 | -1.5 | 68.5% | 61.3% | -7.2% |
| 31 | PIT | 6 | 1.2 | 67% | 59.4% | -7.7% |
| 32 | IND | 6 | -2.1 | 70% | 61.8% | -8.3% |
Oh, and perhaps the most surprising result: the Bears have the best average Game Script this season, based mostly on the demolition over Tampa Bay.