
A fun couple of articles for you to read today, courtesy of Eldorado (@eldo_co) (with a hat tip to Football Outsiders).
The full articles are worth your read, but the premise: a record number of made field goals, a high number of missed extra points, and a ton of successful two-point conversions have lead to a record low number of “Football Scores.”
I wanted to run my own numbers on this, and while the effect using my methodology isn’t quite as extreme, 2015 does still stand out. I looked at the likelihood of every score occurring in NFL history (for example, (20-17 has occurred 1.6% of the time throughout NFL history, 17-14 and 27-24 1.3%, 23-20 and 13-10 at 1.1%, and so on). I then took the average likelihood of each score in each season, plotted below:
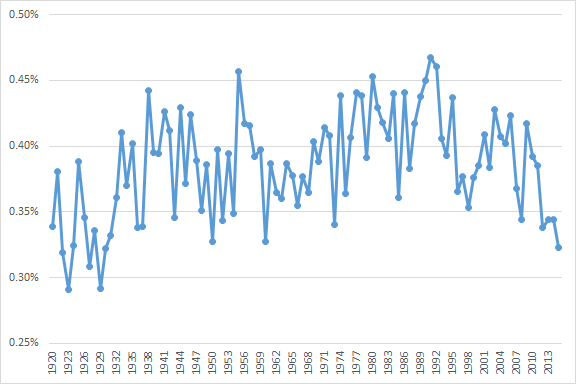
From 1995 to 2014, the “average” final score score had a 0.38% likelihood of occuring; this year number has dropped to 0.32%. Again, that’s not quite as extreme as Eldorado’s results, but it is consistent in direction: 2015 is having some very unusual scores. In fact, the last time the average rate was at 0.32% was in 1930. This year, Tennessee beat Jacksonville 42-39, Pittsburgh beat San Francisco 43-18, and Pittsburgh beat Seattle 39-30; in each instance, those scores had never occurred before in NFL history.