
We know that there is a strong correlation between winning percentage and rushing plays: the teams with the best records tend to run most often, as leading in the second half of games is strongly correlated with both winning games and running in the second half of games. Last year, the top 5 teams in rushing attempts all made the playoffs, and 9 of the top 10 teams (sorry, Buffalo) in rushing attempts won at least 9 games.
The flip side of this is that there is a negative correlation between winning percentage and pass plays. But what I wanted to look at today is how this has changed over time.
I grouped all games into ones where a team passed between 20 and 29 times, 30 and 39 times, or 40 to 49 times. I then checked, for every season since 1960, how often teams won when meeting those criteria. The results are in the graph below:
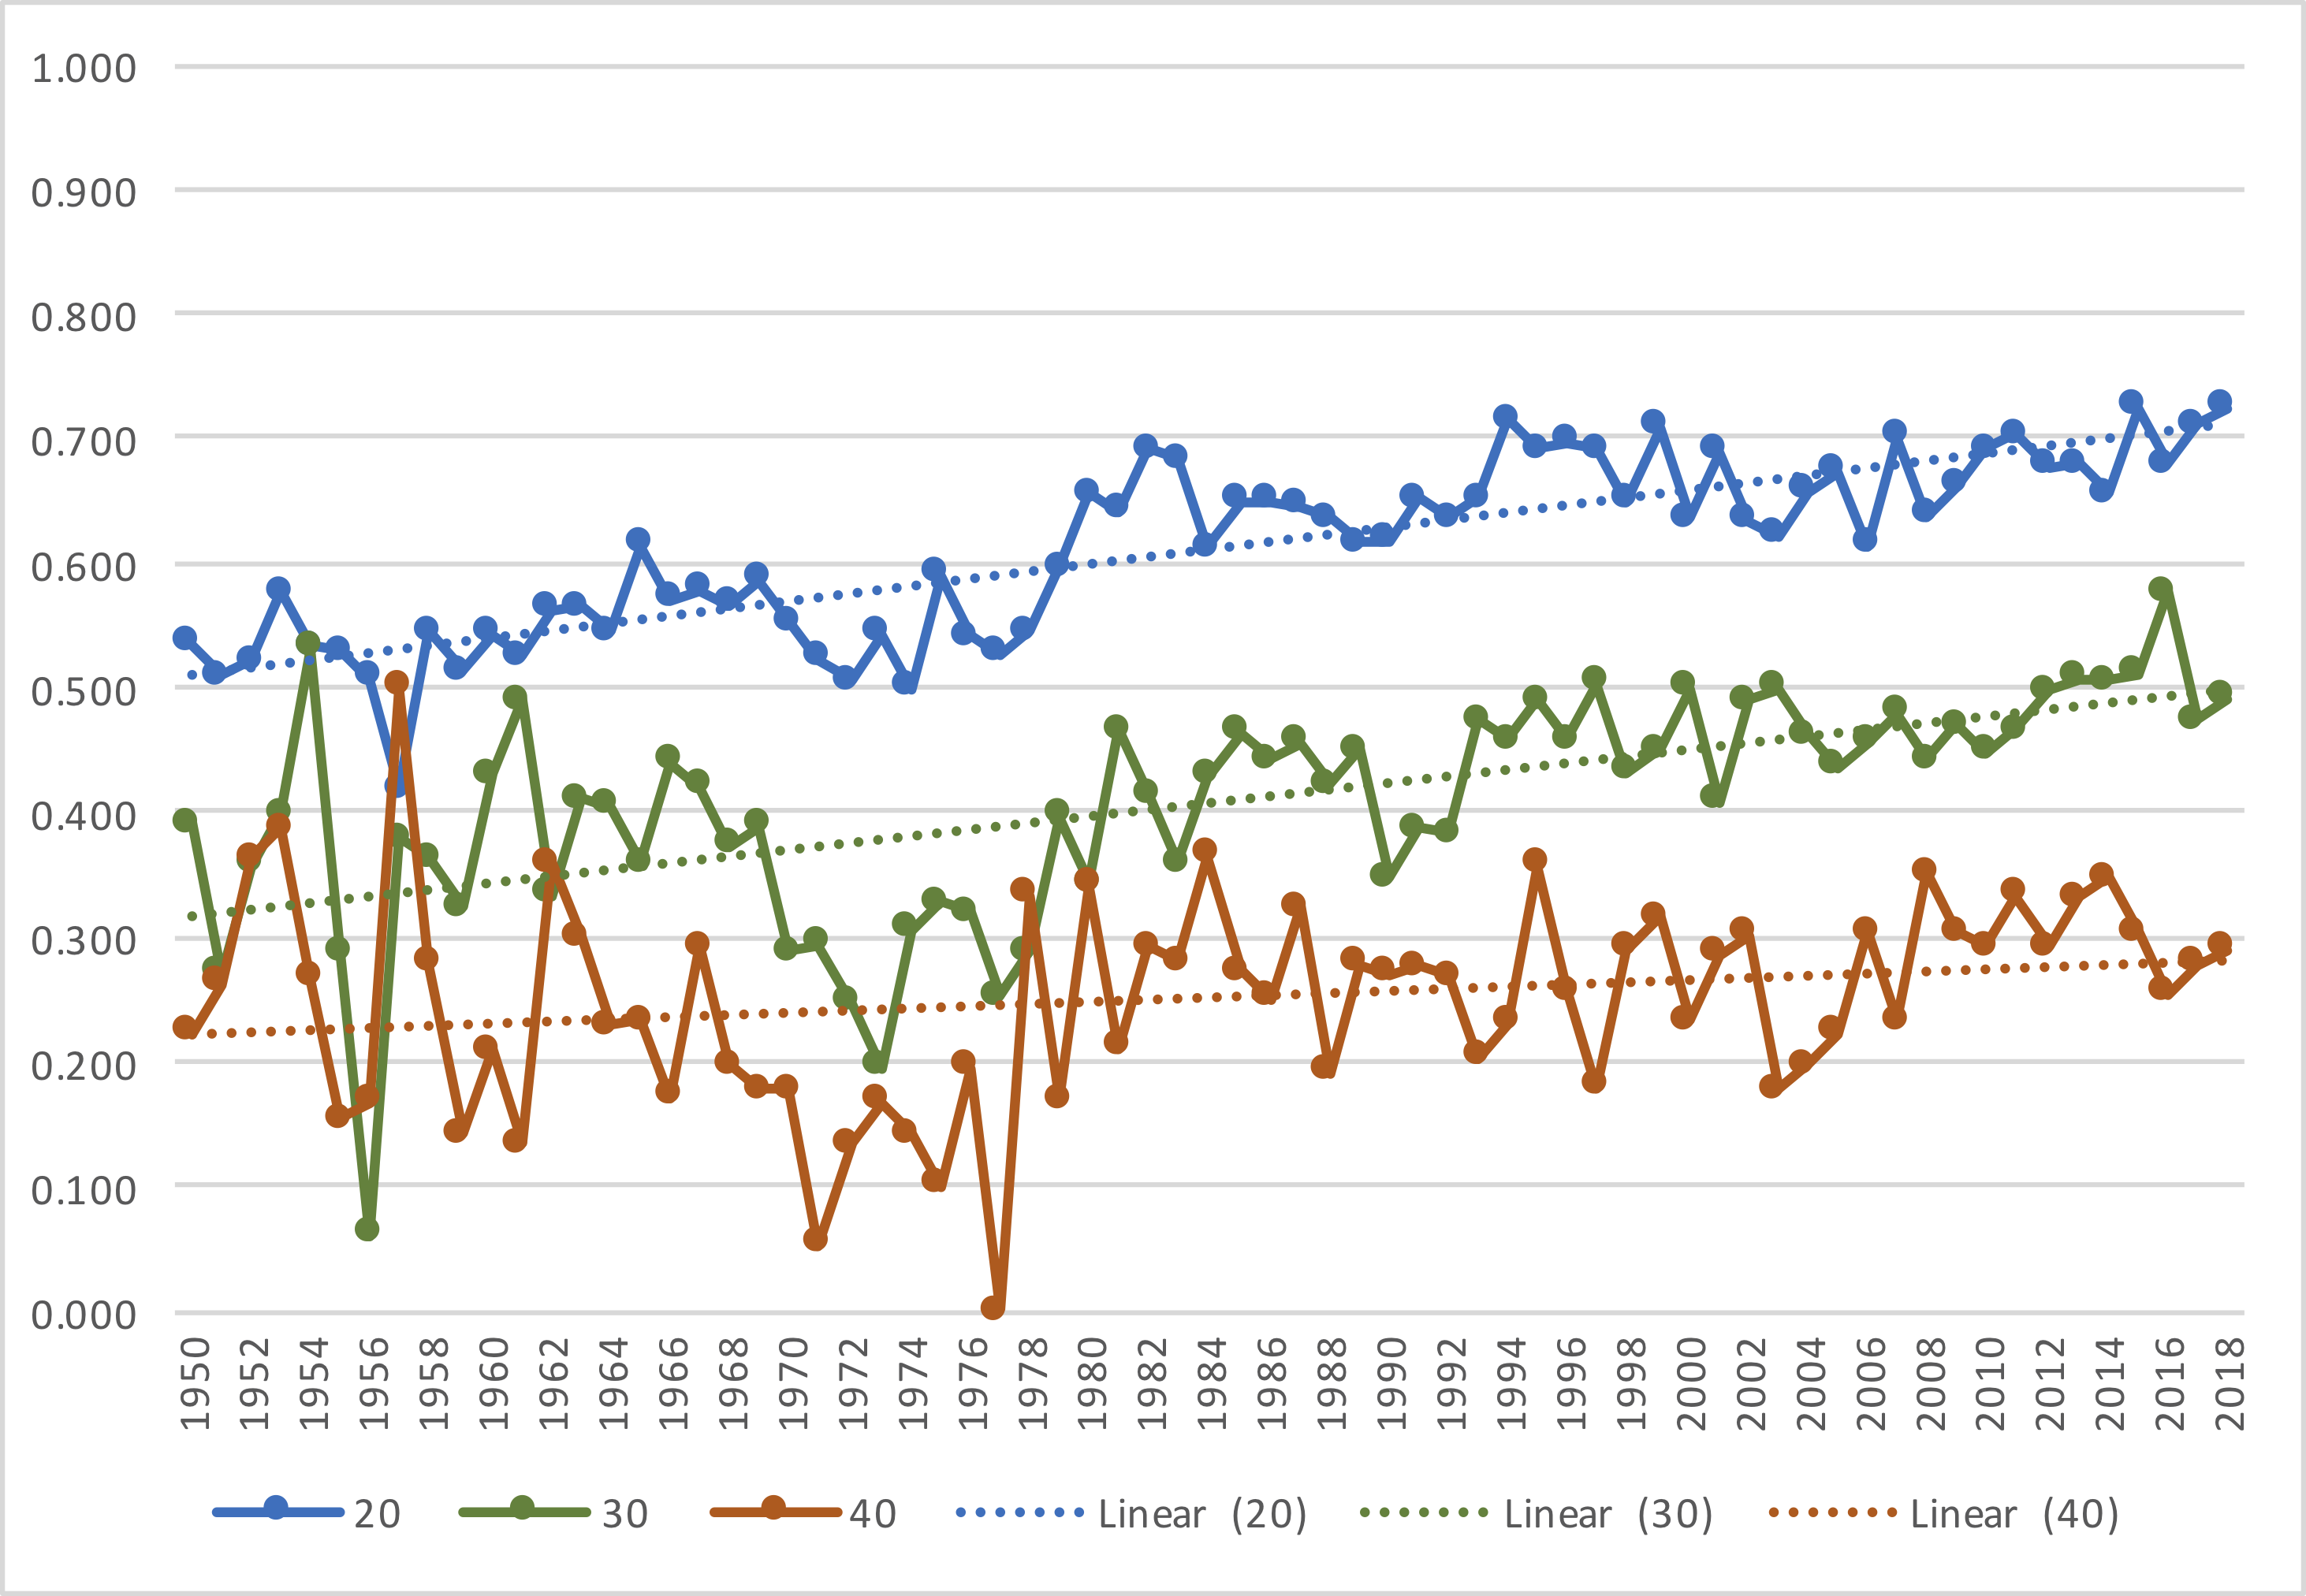
Perhaps the most interesting change is in the 30-39 range, which is now basically a 50/50 proposition as to whether the team won (it used to be that teams would only win one out of every three such games0. The 40+ attempt game, though, even in our high passing era, is still the mark of losing teams. One team bucking that trend last year was Pittsburgh, who actually went 4-2-1 in such games.