
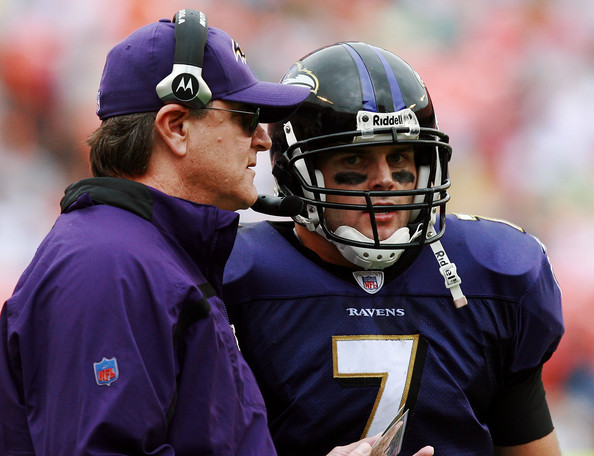
Touchdowns were at a premium in Billick's games.
The 2004 Ravens were hardly Brian Billick’s most interesting team. But those Ravens serve as a shining example of what you envision when you think of Baltimore in the 2000s: terrible on offense and great on defense. The team went 9-7 despite the Kyle Boller-led offense producing just 24 touchdowns, tied for the second fewest in the league. But Ray Lewis, Ed Reed, Terrell Suggs, Chris McAlister, and even Deion Sanders were on a defense that allowed only 23 touchdowns, the second best mark in the NFL. So Baltimore was +1 in net offensive touchdowns, but that doesn’t really demonstrate the type of team the Ravens were.
Here’s a better way: the average team in 2004 produced 35.9 offensive touchdowns. This means the Baltimore offense fell 11.9 touchdowns shy of average, while the defense was 12.9 touchdowns above average. So if you don’t like watching offensive touchdowns, the 2004 Ravens were the team for you: 24.8 fewer offensive scores came in Ravens games than in the average game that season.
That’s the 4th largest negative differential in NFL history, behind…
- The 2002 Bucs (-25.1), who allowed 18.1 fewer touchdowns than average while scoring 7.1 fewer offensive touchdowns;
- The 2005 Bears (-26.2), who allowed 14.6 fewer offensive touchdowns to opponents, and produced 11.6 fewer offensive touchdowns than average; and
- The 1967 Oilers (-28.7), who allowed 17.3 fewer offensive touchdowns than average and scored 11.3 fewer offensive touchdowns than the rest of the AFL.