
Yes, this was the lowest-scoring Super Bowl ever. Just as the game ended, I tweeted this graph:
This is the first Super Bowl to ever have less than 20 combined points. Patriots win, 13-3.
X-Axis: Super Bowl number
Y-Axis: Total points scored by both teams pic.twitter.com/bVyKULKYYa— Football Perspective (@fbgchase) February 4, 2019
But this game was even more anemic than you think, once you consider the two teams in the game. Consider that in the regular season, Los Angeles averaged 32.9 points per game, just 1/16th of a point per game more than the famed ’99 Rams. In fact, the ’18 Rams were the 6th-highest scoring offense to ever make the Super Bowl, behind five other Super Bowl losers: the ’13 Broncos, ’07 Patriots, ’83 Redskins, ’16 Falcons, and ’67 Raiders. But by being held to just 3 points, Los Angeles came in at a whopping 29.9 points below their regular season average. That narrowly (by, in fact, 1/16th of a point per game) bests the ’13 Broncos as the biggest underachieving result in the Super Bowl. There have been 106 teams to play in the Super Bowl, and despite being the 6th-highest scoring team to make it, LA finished as one of just two teams to score only 3 points in the Super Bowl (no team has ever been shut out).
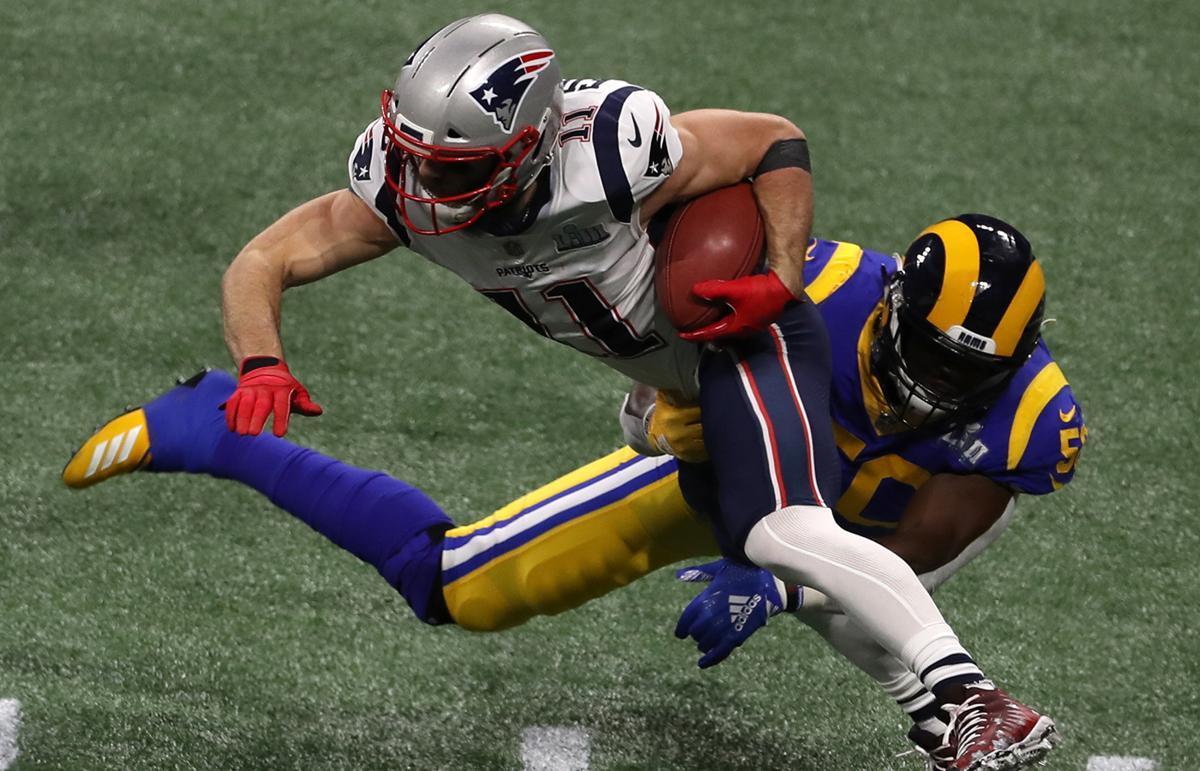
Edelman didn’t score and the Patriots went 3/12 on 3rd downs…. and he was still the best player on the field.
So there you have it: the Rams were the lowest scoring team (relative to their average) of any team to lose in the Super Bowl, and the Patriots were the lowest scoring team (relative to their average) of any team to win the Super Bowl. With just 16 points, this was the lowest scoring Super Bowl, of course, but it was expected to be the third highest scoring Super Bowl ever! The Over/Under was 55.5 points, which trails only the ’16 Super Bowl (New England/Atlanta, with an O/U of 57.0 points and 62 points actually scored) and the ’09 Super Bowl (New Orleans/Indianapolis, 56.5, 48).
The biggest overachievers in Super Bowl history? Well, that honor belongs to the ’89 49ers, who averaged 27.6 points per game in the regular season and then doubled up on that number in the Super Bowl. The table below is fully sortable and searchable, and shows all 106 teams to make the Super Bowl, and how many more (or less) points they scored in the Super Bowl compared to their regular season average:
| Rk | Tm | Year | Super Bowl | Opp | Result | Reg Sea PPG | PF | Diff |
|---|---|---|---|---|---|---|---|---|
| 1 | SFO | 1989 | SBXXIV | DEN | W 55-10 | 27.6 | 55 | 27.4 |
| 2 | DAL | 1992 | SBXXVII | BUF | W 52-17 | 25.6 | 52 | 26.4 |
| 3 | TAM | 2002 | SBXXXVII | OAK | W 48-21 | 21.6 | 48 | 26.4 |
| 4 | CHI | 1985 | SBXX | NWE | W 46-10 | 28.5 | 46 | 17.5 |
| 5 | SFO | 1994 | SBXXIX | SDG | W 49-26 | 31.6 | 49 | 17.4 |
| 6 | SEA | 2013 | SBXLVIII | DEN | W 43-8 | 26.1 | 43 | 16.9 |
| 7 | WAS | 1987 | SBXXII | DEN | W 42-10 | 25.3 | 42 | 16.7 |
| 8 | NYG | 1986 | SBXXI | DEN | W 39-20 | 23.2 | 39 | 15.8 |
| 9 | BAL | 2000 | SBXXXV | NYG | W 34-7 | 20.8 | 34 | 13.2 |
| 10 | PIT | 1978 | SBXIII | DAL | W 35-31 | 22.3 | 35 | 12.8 |
| 11 | PHI | 2017 | SBLII | NWE | W 41-33 | 28.6 | 41 | 12.4 |
| 12 | GNB | 1966 | SBI | KAN | W 35-10 | 23.9 | 35 | 11.1 |
| 13 | RAI | 1983 | SBXVIII | WAS | W 38-9 | 27.6 | 38 | 10.4 |
| 14 | NWE | 2003 | SBXXXVIII | CAR | W 32-29 | 21.8 | 32 | 10.3 |
| 15 | GNB | 1967 | SBII | OAK | W 33-14 | 23.7 | 33 | 9.3 |
| 16 | BAL | 2012 | SBXLVII | SFO | W 34-31 | 24.9 | 34 | 9.1 |
| 17 | CAR | 2003 | SBXXXVIII | NWE | L 29-32 | 20.3 | 29 | 8.7 |
| 18 | SFO | 1984 | SBXIX | MIA | W 38-16 | 29.7 | 38 | 8.3 |
| 19 | DAL | 1978 | SBXIII | PIT | L 31-35 | 24 | 31 | 7 |
| 20 | OAK | 1976 | SBXI | MIN | W 32-14 | 25 | 32 | 7 |
| 21 | GNB | 2010 | SBXLV | PIT | W 31-25 | 24.3 | 31 | 6.8 |
| 22 | WAS | 1991 | SBXXVI | BUF | W 37-24 | 30.3 | 37 | 6.7 |
| 23 | GNB | 1996 | SBXXXI | NWE | W 35-21 | 28.5 | 35 | 6.5 |
| 24 | DAL | 1993 | SBXXVIII | BUF | W 30-13 | 23.5 | 30 | 6.5 |
| 25 | NWE | 2016 | SBLI | ATL | W 34-28 | 27.6 | 34 | 6.4 |
| 26 | SFO | 2012 | SBXLVII | BAL | L 31-34 | 24.8 | 31 | 6.2 |
| 27 | WAS | 1982 | SBXVII | MIA | W 27-17 | 21.1 | 27 | 5.9 |
| 28 | PIT | 2008 | SBXLIII | ARI | W 27-23 | 21.7 | 27 | 5.3 |
| 29 | PIT | 1979 | SBXIV | RAM | W 31-19 | 26 | 31 | 5 |
| 30 | NWE | 2017 | SBLII | PHI | L 33-41 | 28.6 | 33 | 4.4 |
| 31 | OAK | 1980 | SBXV | PHI | W 27-10 | 22.8 | 27 | 4.3 |
| 32 | SFO | 1981 | SBXVI | CIN | W 26-21 | 22.3 | 26 | 3.7 |
| 33 | DEN | 1998 | SBXXXIII | ATL | W 34-19 | 31.3 | 34 | 2.7 |
| 34 | DAL | 1977 | SBXII | DEN | W 27-10 | 24.6 | 27 | 2.4 |
| 35 | IND | 2006 | SBXLI | CHI | W 29-17 | 26.7 | 29 | 2.3 |
| 36 | SDG | 1994 | SBXXIX | SFO | L 26-49 | 23.8 | 26 | 2.2 |
| 37 | DEN | 2015 | SB50 | CAR | W 24-10 | 22.2 | 24 | 1.8 |
| 38 | PIT | 2010 | SBXLV | GNB | L 25-31 | 23.4 | 25 | 1.6 |
| 39 | DEN | 1997 | SBXXXII | GNB | W 31-24 | 29.5 | 31 | 1.5 |
| 40 | DAL | 1995 | SBXXX | PIT | W 27-17 | 27.2 | 27 | -0.2 |
| 41 | MIA | 1973 | SBVIII | MIN | W 24-7 | 24.5 | 24 | -0.5 |
| 42 | SEA | 2014 | SBXLIX | NWE | L 24-28 | 24.6 | 24 | -0.6 |
| 43 | NOR | 2009 | SBXLIV | IND | W 31-17 | 31.9 | 31 | -0.9 |
| 44 | NYG | 1990 | SBXXV | BUF | W 20-19 | 20.9 | 20 | -0.9 |
| 45 | RAM | 1979 | SBXIV | PIT | L 19-31 | 20.2 | 19 | -1.2 |
| 46 | NWE | 2014 | SBXLIX | SEA | W 28-24 | 29.3 | 28 | -1.3 |
| 47 | GNB | 1997 | SBXXXII | DEN | L 24-31 | 26.4 | 24 | -2.4 |
| 48 | KAN | 1969 | SBIV | MIN | W 23-7 | 25.6 | 23 | -2.6 |
| 49 | SFO | 1988 | SBXXIII | CIN | W 20-16 | 23.1 | 20 | -3.1 |
| 50 | PHI | 2004 | SBXXXIX | NWE | L 21-24 | 24.1 | 21 | -3.1 |
| 51 | NWE | 2001 | SBXXXVI | STL | W 20-17 | 23.2 | 20 | -3.2 |
| 52 | NWE | 2004 | SBXXXIX | PHI | W 24-21 | 27.3 | 24 | -3.3 |
| 53 | PIT | 2005 | SBXL | SEA | W 21-10 | 24.3 | 21 | -3.3 |
| 54 | DEN | 1986 | SBXXI | NYG | L 20-39 | 23.6 | 20 | -3.6 |
| 55 | NYG | 2011 | SBXLVI | NWE | W 21-17 | 24.6 | 21 | -3.6 |
| 56 | ARI | 2008 | SBXLIII | PIT | L 23-27 | 26.7 | 23 | -3.7 |
| 57 | BUF | 1991 | SBXXVI | WAS | L 24-37 | 28.6 | 24 | -4.6 |
| 58 | MIA | 1982 | SBXVII | WAS | L 17-27 | 22 | 17 | -5 |
| 59 | DAL | 1971 | SBVI | MIA | W 24-3 | 29 | 24 | -5 |
| 60 | NWE | 1996 | SBXXXI | GNB | L 21-35 | 26.1 | 21 | -5.1 |
| 61 | CIN | 1981 | SBXVI | SFO | L 21-26 | 26.3 | 21 | -5.3 |
| 62 | PIT | 1975 | SBX | DAL | W 21-17 | 26.6 | 21 | -5.6 |
| 63 | ATL | 2016 | SBLI | NWE | L 28-34 | 33.8 | 28 | -5.8 |
| 64 | PIT | 1974 | SBIX | MIN | W 16-6 | 21.8 | 16 | -5.8 |
| 65 | NYG | 2007 | SBXLII | NWE | W 17-14 | 23.3 | 17 | -6.3 |
| 66 | BUF | 1992 | SBXXVII | DAL | L 17-52 | 23.8 | 17 | -6.8 |
| 67 | BAL | 1970 | SBV | DAL | W 16-13 | 22.9 | 16 | -6.9 |
| 68 | OAK | 2002 | SBXXXVII | TAM | L 21-48 | 28.1 | 21 | -7.1 |
| 69 | BUF | 1993 | SBXXVIII | DAL | L 13-30 | 20.6 | 13 | -7.6 |
| 70 | BUF | 1990 | SBXXV | NYG | L 19-20 | 26.8 | 19 | -7.8 |
| 71 | MIN | 1976 | SBXI | OAK | L 14-32 | 21.8 | 14 | -7.8 |
| 72 | DAL | 1975 | SBX | PIT | L 17-21 | 25 | 17 | -8 |
| 73 | DAL | 1970 | SBV | BAL | L 13-16 | 21.4 | 13 | -8.4 |
| 74 | PIT | 1995 | SBXXX | DAL | L 17-27 | 25.4 | 17 | -8.4 |
| 75 | TEN | 1999 | SBXXXIV | STL | L 16-23 | 24.5 | 16 | -8.5 |
| 76 | ATL | 1998 | SBXXXIII | DEN | L 19-34 | 27.6 | 19 | -8.6 |
| 77 | IND | 2009 | SBXLIV | NOR | L 17-31 | 26 | 17 | -9 |
| 78 | DEN | 1977 | SBXII | DAL | L 10-27 | 19.6 | 10 | -9.6 |
| 79 | CHI | 2006 | SBXLI | IND | L 17-29 | 26.7 | 17 | -9.7 |
| 80 | STL | 1999 | SBXXXIV | TEN | W 23-16 | 32.9 | 23 | -9.9 |
| 81 | CIN | 1988 | SBXXIII | SFO | L 16-20 | 28 | 16 | -12 |
| 82 | DEN | 1989 | SBXXIV | SFO | L 10-55 | 22.6 | 10 | -12.6 |
| 83 | NWE | 1985 | SBXX | CHI | L 10-46 | 22.6 | 10 | -12.6 |
| 84 | NYG | 2000 | SBXXXV | BAL | L 7-34 | 20.5 | 7 | -13.5 |
| 85 | MIA | 1972 | SBVII | WAS | W 14-7 | 27.5 | 14 | -13.5 |
| 86 | NYJ | 1968 | SBIII | BAL | W 16-7 | 29.9 | 16 | -13.9 |
| 87 | PHI | 1980 | SBXV | OAK | L 10-27 | 24 | 10 | -14 |
| 88 | MIN | 1973 | SBVIII | MIA | L 7-24 | 21.1 | 7 | -14.1 |
| 89 | NWE | 2018 | SBLIII | LAR | W 13-3 | 27.3 | 13 | -14.3 |
| 90 | STL | 2001 | SBXXXVI | NWE | L 17-20 | 31.4 | 17 | -14.4 |
| 91 | NWE | 2011 | SBXLVI | NYG | L 17-21 | 32.1 | 17 | -15.1 |
| 92 | DEN | 1987 | SBXXII | WAS | L 10-42 | 25.3 | 10 | -15.3 |
| 93 | MIA | 1984 | SBXIX | SFO | L 16-38 | 32.1 | 16 | -16.1 |
| 94 | MIN | 1974 | SBIX | PIT | L 6-16 | 22.1 | 6 | -16.1 |
| 95 | WAS | 1972 | SBVII | MIA | L 7-14 | 24 | 7 | -17 |
| 96 | SEA | 2005 | SBXL | PIT | L 10-21 | 28.3 | 10 | -18.3 |
| 97 | OAK | 1967 | SBII | GNB | L 14-33 | 33.4 | 14 | -19.4 |
| 98 | MIA | 1971 | SBVI | DAL | L 3-24 | 22.5 | 3 | -19.5 |
| 99 | MIN | 1969 | SBIV | KAN | L 7-23 | 27.1 | 7 | -20.1 |
| 100 | CAR | 2015 | SB50 | DEN | L 10-24 | 31.3 | 10 | -21.3 |
| 101 | BAL | 1968 | SBIII | NYJ | L 7-16 | 28.7 | 7 | -21.7 |
| 102 | KAN | 1966 | SBI | GNB | L 10-35 | 32 | 10 | -22 |
| 103 | NWE | 2007 | SBXLII | NYG | L 14-17 | 36.8 | 14 | -22.8 |
| 104 | WAS | 1983 | SBXVIII | RAI | L 9-38 | 33.8 | 9 | -24.8 |
| 105 | DEN | 2013 | SBXLVIII | SEA | L 8-43 | 37.9 | 8 | -29.9 |
| 106 | LAR | 2018 | SBLIII | NWE | L 3-13 | 32.9 | 3 | -29.9 |
The Patriots have actually scored below their expectation in 6 of the 9 Super Bowls under Brady and Belichick, with Super Bowl LIII being the worst offender in a winning effort and Super Bowl XLII being the worst performance overall. With better defenses in the Super Bowl, this isn’t too surprising: 67 of the 106 teams (63%) scored fewer points in the Super Bowl than they averaged during the regular season.