
Since 1970, you would do a pretty good job estimating any team’s record by regressing that team’s record back to the mean by about 60%. More specifically, if you take 40% of the team’s actual winning percentage the prior year, and 60% of the league average winning percentage, you would get a pretty good estimate of their record the next season (though the R^2 is just 0.17).
That’s over a long period, though, and team variability is on the rise. If you look at the last 20 years, it’s more like 70%, with the best fit formula to project winning percentage being something like 35% plus 30% of the team’s winning percentage the prior year.
Last year was a bit of a weird year, with some notable outliers. The 3-13 Browns would have been expected to progress to the mean, but instead went 1-15. The 49ers went from 5-11 to 2-14. The Bears went from 6-10 to 3-13. And on the positive side of .500, the Panthers dropped from 15-1 to 6-10, while the Jets win total dropped in half, from 10 to five.
The Patriots defied regression to the mean for the umpteenth straight year, improving from 12-4 to 14-2. The Raiders zoomed past the mean, going from 7-9 to 12-4. The Giants similarly went from 6-10 to 11-5.
The correlation coefficient between team winning percentage in 2015 and team winning percentage in 2016 was 0.27, which is pretty low, but not abnormally so. Here are the correlation coefficients for each pair of years since 1970:
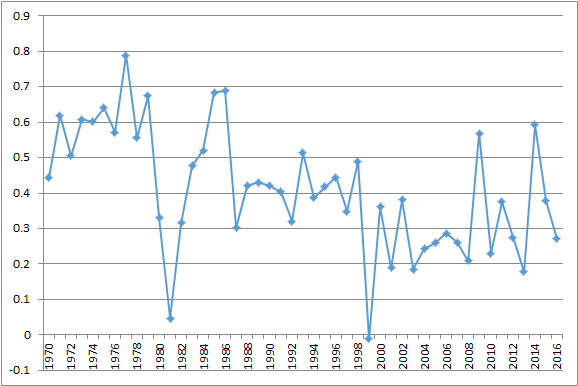
The wackiest year, of course, is 1999. That’s a good year for a trip down the wormhole on another day.