
My favorite measure of quarterback play is Adjusted Net Yards per Attempt. For new readers, ANY/A is simply yards per attempt, but it includes sacks (both in the denominator and with those yards lost deducted from the numerator) and adjustments for touchdowns (20-yard bonus) and interceptions (45-yard penalty).
Midway through the 2016 season, I looked at Joe Flacco’s ANY/A average in every game of his career. I want to update that post today. The graph below shows Flacco’s trailing ten game ANY/A over each ten-game block of his career (excluding the postseason). His best stretch was from games 4 through 13 of the 2013 season, where his average ANY/A over those ten games (taking an average of the averages) was 7.92. His worst T10G ANY/A was 3.74, covering the final three games of 2016 and the first seven games of 2017.
Perhaps most importantly, I included a black line representing the league average for each of these trailing ten games. The black line represents the NFL average ANY/A for that season, but it combines averages when crossing seasons (so the T10G ANY/A at week 5 of 2017 is 50% of the NFL 2017 ANY/A average and 50% of the NFL 2016 ANY/A average).
Okay, that’s a lot of fine print. In short: the purple line is how good Flacco’s been over a stretch of ten games; the black line is average. He’s below-average a lot lately:

Much of the narrative on Flacco is that after his remarkable Super Bowl run in 2012, he’s been bad. And that’s, well, pretty accurate: there are 23 quarterbacks with at least 1500 pass attempts since 2013, and Flacco has the worst ANY/A of any of them. And as an offense, Baltimore ranks in the bottom five in both NY/A and passer rating over the last five seasons.
On the other hand, Flacco did have a really good run in 2014. For the season, he finished 13th in ANY/A, playing with Steve Smith, Torrey Smith, and Owen Daniels. Since then, here are the top 20 leaders in targets for the 2015-2017 Ravens:
| Game | Game | Rece | Rece | Rece | Rece | Rece | Rece | Rece | Rece | |||||
|---|---|---|---|---|---|---|---|---|---|---|---|---|---|---|
| Rk | Player | From | To | Draft | G | GS | Tgt | Rec | Yds | Y/R | TD | Y/G | Ctch% | Y/Tgt |
| 1 | Mike Wallace | 2016 | 2017 | 3-84 | 31 | 30 | 208 | 124 | 1765 | 14.23 | 8 | 56.9 | 59.6% | 8.49 |
| 2 | Kamar Aiken | 2015 | 2016 | 32 | 20 | 177 | 104 | 1272 | 12.23 | 6 | 39.8 | 58.8% | 7.19 | |
| 3 | Steve Smith | 2015 | 2016 | 3-74 | 21 | 21 | 174 | 116 | 1469 | 12.66 | 8 | 70.0 | 66.7% | 8.44 |
| 4 | Javorius Allen | 2015 | 2017 | 4-125 | 40 | 6 | 126 | 94 | 618 | 6.57 | 4 | 15.5 | 74.6% | 4.90 |
| 5 | Dennis Pitta | 2016 | 2016 | 4-114 | 16 | 12 | 121 | 86 | 729 | 8.48 | 2 | 45.6 | 71.1% | 6.02 |
| 6 | Kyle Juszczyk | 2015 | 2016 | 4-130 | 32 | 18 | 105 | 78 | 587 | 7.53 | 4 | 18.3 | 74.3% | 5.59 |
| 7 | Breshad Perriman | 2016 | 2017 | 1-26 | 27 | 4 | 101 | 43 | 576 | 13.40 | 3 | 21.3 | 42.6% | 5.70 |
| 8 | Ben Watson | 2017 | 2017 | 1-32 | 16 | 12 | 79 | 61 | 522 | 8.56 | 4 | 32.6 | 77.2% | 6.61 |
| 9 | Jeremy Maclin | 2017 | 2017 | 1-19 | 12 | 12 | 72 | 40 | 440 | 11.00 | 3 | 36.7 | 55.6% | 6.11 |
| 10 | Nick Boyle | 2015 | 2017 | 5-171 | 32 | 13 | 66 | 52 | 400 | 7.69 | 0 | 12.5 | 78.8% | 6.06 |
| 11 | Maxx Williams | 2015 | 2017 | 2-55 | 29 | 15 | 66 | 47 | 354 | 7.53 | 2 | 12.2 | 71.2% | 5.36 |
| 12 | Crockett Gillmore | 2015 | 2016 | 3-99 | 17 | 15 | 61 | 41 | 483 | 11.78 | 5 | 28.4 | 67.2% | 7.92 |
| 13 | Justin Forsett | 2015 | 2016 | 7-233 | 13 | 13 | 55 | 42 | 189 | 4.50 | 0 | 14.5 | 76.4% | 3.44 |
| 14 | Chris Moore | 2016 | 2017 | 4-107 | 28 | 4 | 54 | 25 | 294 | 11.76 | 3 | 10.5 | 46.3% | 5.44 |
| 15 | Terrance West | 2015 | 2017 | 3-94 | 27 | 17 | 54 | 40 | 280 | 7.00 | 1 | 10.4 | 74.1% | 5.19 |
| 16 | Chris Givens | 2015 | 2015 | 4-96 | 12 | 6 | 53 | 19 | 346 | 18.21 | 1 | 28.8 | 35.8% | 6.53 |
| 17 | Jeremy Butler | 2015 | 2015 | 8 | 0 | 44 | 31 | 363 | 11.71 | 0 | 45.4 | 70.5% | 8.25 | |
| 18 | Kenneth Dixon | 2016 | 2016 | 4-134 | 12 | 0 | 41 | 30 | 162 | 5.40 | 1 | 13.5 | 73.2% | 3.95 |
| 19 | Danny Woodhead | 2017 | 2017 | 8 | 0 | 39 | 33 | 200 | 6.06 | 0 | 25.0 | 84.6% | 5.13 | |
| 20 | Alex Collins | 2017 | 2017 | 5-171 | 15 | 12 | 36 | 23 | 187 | 8.13 | 0 | 12.5 | 63.9% | 5.19 |
Here’s the breakdown by position:
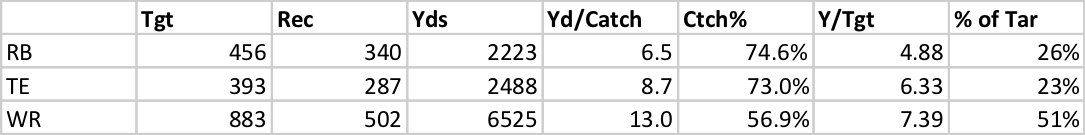
There are a few problems here. The first is too many passes to his running backs, which have killed his yards per attempt average. The second? His tight ends are averaging just 8.7 yards per catch. He’s actually been OK on throws to his wide receivers, but there simply haven’t been enough of them (or, said differently, his numbers to his wide receivers don’t look bad because he only throws to them in advantageous situations). It’s clear that Flacco’s supporting cast has fallen off, and his poor production is not all his fault. On the other hand, we’ve now had a very long run of below-average performances from Flacco. Over the last three years, he’s been by far the worst passer in the NFL among players with 1,000 pass attempts; he’s farther away from the 2nd-worst QB than the 2nd-worst QB is from league average.