
In 2017, the Carolina Panthers went 11-5, thanks largely to a 7-1 record in games decided by 7 or fewer points. This means that in non-close games, Carolina went 4-4.
In 2018, Carolina was even better in non-close games, going 5-2. But the Panthers didn’t replicate their close-game success; in fact, the Panthers luck swung wildly in a different direction, going just 2-7 in close games. This has actually been a trend of the Ron Rivera / Cam Newton Panthers. The duo got off to a very rocky start, going 1-5 (0.167) in close games in their first year together in 2011, and then 1-7 (0.125) in close games in 2012. After that season, I wrote that Carolina looked like a team on the rise that would probably start experiencing good luck soon. That turned out to be one of my most accurate predictions, as in close games, Carolina went 5-2 (0.714) in 2013, 4-2-1 (0.643) in 2014, and then 6-1 (0.857) in 2015. The Panthers then swung the other way, going 2-6 (0.250) in 2016, then up to 7-1 (0.875) in 2017, and back down to 2-7 (0.222) in 2018.
The Panthers yo-yo performance in close games is not that unusual; for the most part, winning percentage in close games is not sustainable. How did I measure that?
1) I looked at the records in close games (7 or fewer points margin of victor) and records in non-close games for every team since 1990.
2) Because of small sample sizes, I then calculated a projected winning percentage in close games based on that team’s winning percentage in non-close games after adding 11 games of .500 play to that record. So if a team went 2-0 in non-close games, they’d be expected to have a 0.577 winning percentage (7.5 wins out of 13 games) in close games.
3) I then calculate how many wins above expectation in close games each team had. By this measure, the 2012 Colts exceeded expectations the most. That year, Indianapolis went 2-4 in non-close games, so we would expect them to have a 0.441 winning percentage in close games (7.5 wins out of 17 games). Indianapolis played in 10 close games (expected to win 4.41 games) and actually won 9 of them, giving the Colts 4.59 more close games wins than expected. The next year, Indianapolis won 1.70 more close games than expected, so this regressed to the mean quite a bit.
The correlation coefficient between wins above expectation in Year N and in Year N+1 is just 0.04, making it practically zero. The graph below shows all teams since 1990; their wins above expectation in Year N is on the X-Axis, and wins above expectation in Year N+1 is on the Y-Axis. As you can tell, it’s essentially a random scatterplot of data:
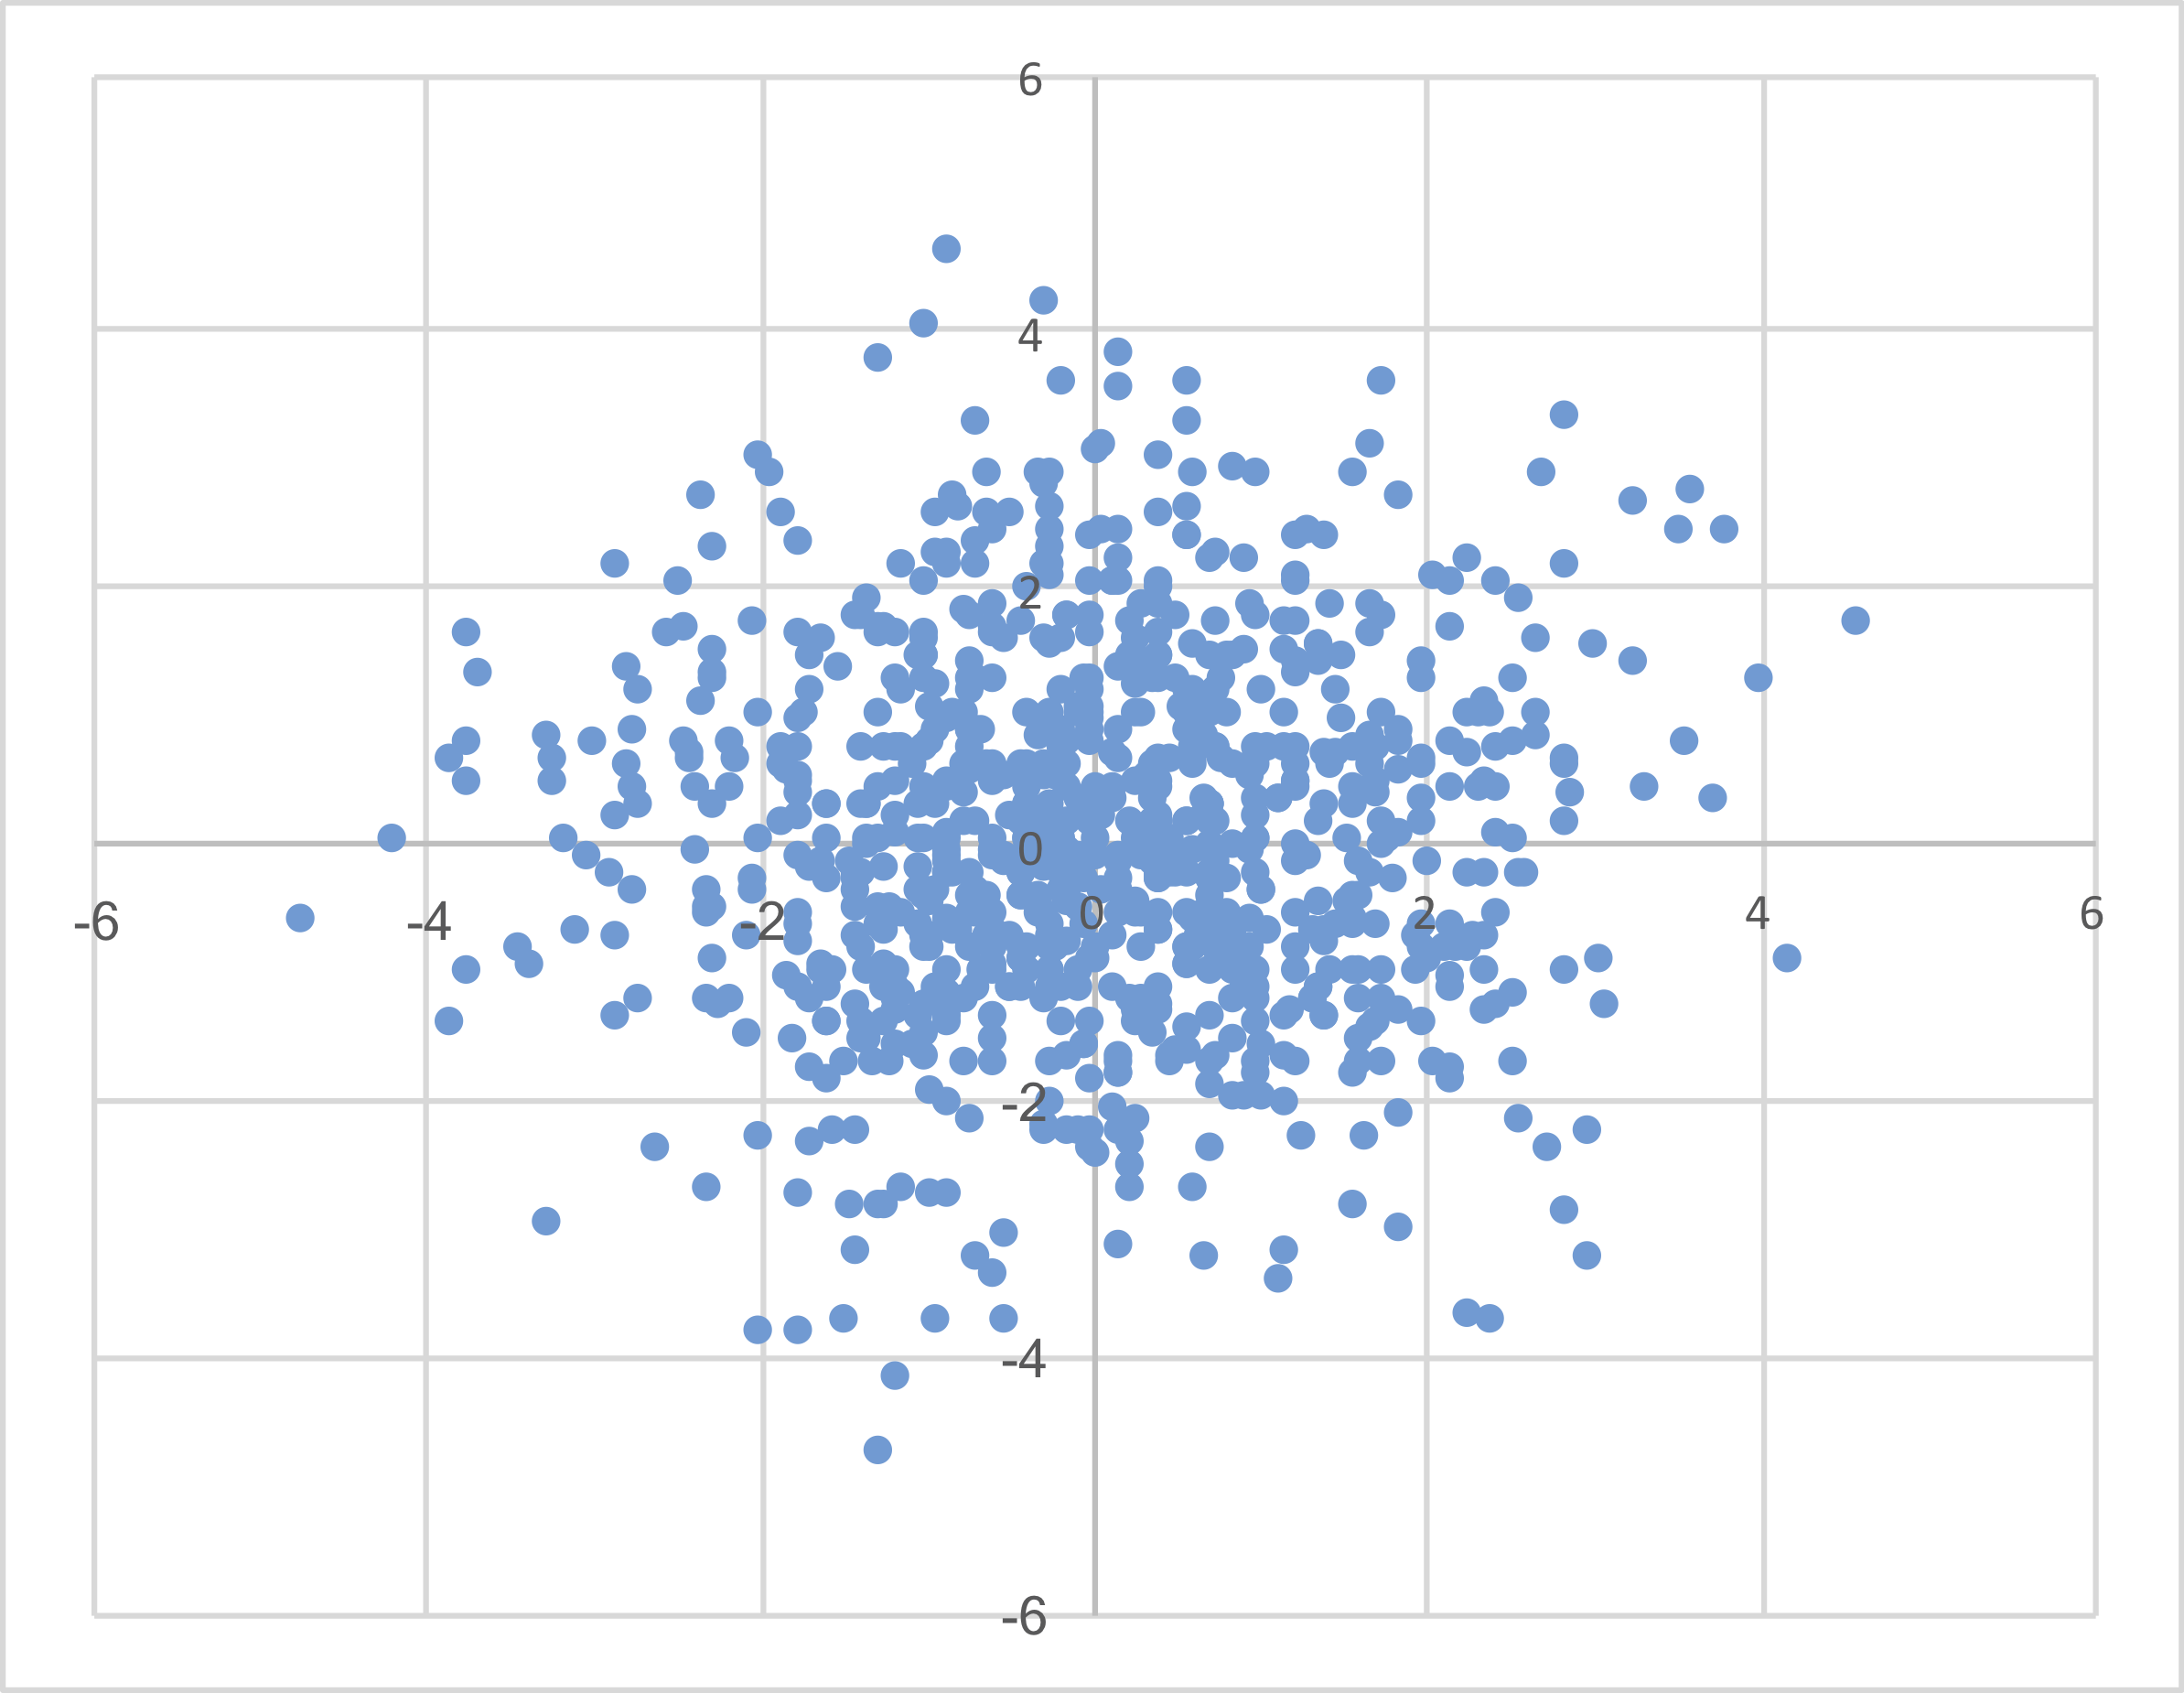
And here is the raw data:
| Year | Team | NCG Wins | NCG | NCG W% | CG Wins | CG | CG W% | Exp CG W% | Diff | N+1 |
|---|---|---|---|---|---|---|---|---|---|---|
| 2012 | clt | 2 | 6 | 0.333 | 9 | 10 | 0.900 | 0.441 | 4.59 | 1.71 |
| 2016 | htx | 1 | 6 | 0.167 | 8 | 10 | 0.800 | 0.382 | 4.18 | -0.93 |
| 1995 | buf | 3 | 9 | 0.333 | 7 | 7 | 1.000 | 0.425 | 4.03 | 1.25 |
| 1993 | rai | 1 | 4 | 0.250 | 9 | 12 | 0.750 | 0.433 | 3.80 | 2.42 |
| 2011 | rai | 1 | 7 | 0.143 | 7 | 9 | 0.778 | 0.361 | 3.75 | 0.30 |
| 2016 | mia | 2 | 6 | 0.333 | 8 | 10 | 0.800 | 0.441 | 3.59 | 2.73 |
| 2001 | chi | 5 | 8 | 0.625 | 8 | 8 | 1.000 | 0.553 | 3.58 | 0.76 |
| 2004 | jax | 1 | 5 | 0.200 | 8 | 11 | 0.727 | 0.406 | 3.53 | 2.41 |
| 2000 | nyg | 5 | 9 | 0.556 | 7 | 7 | 1.000 | 0.525 | 3.33 | 0.42 |
| 2008 | clt | 4 | 7 | 0.571 | 8 | 9 | 0.889 | 0.528 | 3.25 | 2.63 |
| 2016 | rai | 4 | 7 | 0.571 | 8 | 9 | 0.889 | 0.528 | 3.25 | 1.38 |
| 2009 | rai | 0 | 9 | 0.000 | 5 | 7 | 0.714 | 0.275 | 3.08 | -1.29 |
| 1996 | sdg | 3 | 11 | 0.273 | 5 | 5 | 1.000 | 0.386 | 3.07 | -0.93 |
| 1992 | clt | 3 | 9 | 0.333 | 6 | 7 | 0.857 | 0.425 | 3.03 | 1.52 |
| 2003 | car | 2 | 4 | 0.500 | 9 | 12 | 0.750 | 0.500 | 3.00 | -2.29 |
| 2017 | car | 4 | 8 | 0.500 | 7 | 8 | 0.875 | 0.500 | 3.00 | -3.25 |
| 2011 | crd | 0 | 3 | 0.000 | 8 | 13 | 0.615 | 0.393 | 2.89 | 0.38 |
| 1999 | nyg | 2 | 10 | 0.200 | 5 | 6 | 0.833 | 0.357 | 2.86 | 3.33 |
| 1995 | ram | 2 | 10 | 0.200 | 5 | 6 | 0.833 | 0.357 | 2.86 | 0.57 |
| 2001 | nyj | 2 | 5 | 0.400 | 8 | 11 | 0.727 | 0.469 | 2.84 | -1.03 |
| 2014 | sfo | 2 | 8 | 0.250 | 6 | 8 | 0.750 | 0.395 | 2.84 | 2.14 |
| 2008 | den | 2 | 8 | 0.250 | 6 | 8 | 0.750 | 0.395 | 2.84 | 0.61 |
| 2017 | crd | 2 | 8 | 0.250 | 6 | 8 | 0.750 | 0.395 | 2.84 | 0.14 |
| 1998 | rai | 2 | 8 | 0.250 | 6 | 8 | 0.750 | 0.395 | 2.84 | -2.89 |
| 2002 | sfo | 3 | 7 | 0.429 | 7 | 9 | 0.778 | 0.472 | 2.75 | -2.42 |
| 2017 | mia | 1 | 9 | 0.111 | 5 | 7 | 0.714 | 0.325 | 2.73 | 2.86 |
| 2007 | sfo | 0 | 8 | 0.000 | 5 | 8 | 0.625 | 0.289 | 2.68 | 1.57 |
| 1993 | det | 4 | 9 | 0.444 | 6 | 7 | 0.857 | 0.475 | 2.68 | 1.00 |
| 2002 | clt | 4 | 9 | 0.444 | 6 | 7 | 0.857 | 0.475 | 2.68 | 0.82 |
| 2009 | clt | 7 | 9 | 0.778 | 7 | 7 | 1.000 | 0.625 | 2.63 | -0.25 |
| 1998 | crd | 2 | 6 | 0.333 | 7 | 10 | 0.700 | 0.441 | 2.59 | 1.86 |
| 1996 | clt | 2 | 6 | 0.333 | 7 | 10 | 0.700 | 0.441 | 2.59 | -2.16 |
| 2013 | nyj | 3 | 10 | 0.300 | 5 | 6 | 0.833 | 0.405 | 2.57 | -0.25 |
| 2006 | oti | 1 | 5 | 0.200 | 7 | 11 | 0.636 | 0.406 | 2.53 | 1.25 |
| 2015 | clt | 1 | 5 | 0.200 | 7 | 11 | 0.636 | 0.406 | 2.53 | 0.75 |
| 2003 | cin | 1 | 5 | 0.200 | 7 | 11 | 0.636 | 0.406 | 2.53 | 0.00 |
| 2011 | den | 1 | 5 | 0.200 | 7 | 11 | 0.636 | 0.406 | 2.53 | -1.19 |
| 2008 | was | 1 | 5 | 0.200 | 7 | 11 | 0.636 | 0.406 | 2.53 | -1.75 |
| 2013 | jax | 0 | 10 | 0.000 | 4 | 6 | 0.667 | 0.262 | 2.43 | 0.06 |
| 2003 | crd | 0 | 10 | 0.000 | 4 | 6 | 0.667 | 0.262 | 2.43 | -0.58 |
| 1993 | min | 3 | 8 | 0.375 | 6 | 8 | 0.750 | 0.447 | 2.42 | 2.00 |
| 2004 | sea | 3 | 8 | 0.375 | 6 | 8 | 0.750 | 0.447 | 2.42 | 0.74 |
| 2001 | sea | 3 | 8 | 0.375 | 6 | 8 | 0.750 | 0.447 | 2.42 | 0.42 |
| 1994 | rai | 3 | 8 | 0.375 | 6 | 8 | 0.750 | 0.447 | 2.42 | -1.29 |
| 1990 | rai | 4 | 6 | 0.667 | 8 | 10 | 0.800 | 0.559 | 2.41 | 1.00 |
| 2005 | jax | 4 | 6 | 0.667 | 8 | 10 | 0.800 | 0.559 | 2.41 | -3.75 |
| 1997 | cin | 2 | 9 | 0.222 | 5 | 7 | 0.714 | 0.375 | 2.38 | 1.08 |
| 1990 | dal | 2 | 9 | 0.222 | 5 | 7 | 0.714 | 0.375 | 2.38 | 0.43 |
| 1996 | crd | 2 | 9 | 0.222 | 5 | 7 | 0.714 | 0.375 | 2.38 | -0.25 |
| 2017 | gnb | 2 | 9 | 0.222 | 5 | 7 | 0.714 | 0.375 | 2.38 | -0.75 |
| 1994 | nor | 2 | 9 | 0.222 | 5 | 7 | 0.714 | 0.375 | 2.38 | -1.00 |
| 1995 | tam | 2 | 9 | 0.222 | 5 | 7 | 0.714 | 0.375 | 2.38 | -1.33 |
| 1992 | mia | 5 | 9 | 0.556 | 6 | 7 | 0.857 | 0.525 | 2.33 | 1.00 |
| 2014 | det | 5 | 9 | 0.556 | 6 | 7 | 0.857 | 0.525 | 2.33 | 0.42 |
| 1990 | cin | 4 | 10 | 0.400 | 5 | 6 | 0.833 | 0.452 | 2.29 | -0.74 |
| 2015 | tam | 1 | 8 | 0.125 | 5 | 8 | 0.625 | 0.342 | 2.26 | 1.00 |
| 1991 | nwe | 1 | 8 | 0.125 | 5 | 8 | 0.625 | 0.342 | 2.26 | -0.86 |
| 1997 | phi | 1 | 7 | 0.143 | 5.5 | 9 | 0.611 | 0.361 | 2.25 | 0.68 |
| 2008 | mia | 4 | 7 | 0.571 | 7 | 9 | 0.778 | 0.528 | 2.25 | 2.18 |
| 1990 | sfo | 6 | 7 | 0.857 | 8 | 9 | 0.889 | 0.639 | 2.25 | -3.68 |
| 2004 | nor | 2 | 7 | 0.286 | 6 | 9 | 0.667 | 0.417 | 2.25 | -0.28 |
| 2015 | den | 3 | 4 | 0.750 | 9 | 12 | 0.750 | 0.567 | 2.20 | -0.84 |
| 2009 | jax | 1 | 6 | 0.167 | 6 | 10 | 0.600 | 0.382 | 2.18 | 2.03 |
| 2011 | kan | 1 | 6 | 0.167 | 6 | 10 | 0.600 | 0.382 | 2.18 | 0.75 |
| 2009 | mia | 1 | 6 | 0.167 | 6 | 10 | 0.600 | 0.382 | 2.18 | 0.42 |
| 2014 | gnb | 7 | 11 | 0.636 | 5 | 5 | 1.000 | 0.568 | 2.16 | -1.07 |
| 2012 | htx | 7 | 11 | 0.636 | 5 | 5 | 1.000 | 0.568 | 2.16 | -1.78 |
| 2002 | gnb | 7 | 11 | 0.636 | 5 | 5 | 1.000 | 0.568 | 2.16 | -1.86 |
| 1995 | kan | 6 | 8 | 0.750 | 7 | 8 | 0.875 | 0.605 | 2.16 | 1.68 |
| 1999 | oti | 6 | 8 | 0.750 | 7 | 8 | 0.875 | 0.605 | 2.16 | -0.68 |
| 2016 | nyg | 3 | 5 | 0.600 | 8 | 11 | 0.727 | 0.531 | 2.16 | -1.14 |
| 2015 | sfo | 1 | 10 | 0.100 | 4 | 6 | 0.667 | 0.310 | 2.14 | -0.86 |
| 2011 | tam | 0 | 9 | 0.000 | 4 | 7 | 0.571 | 0.275 | 2.08 | -1.75 |
| 2017 | was | 3 | 11 | 0.273 | 4 | 5 | 0.800 | 0.386 | 2.07 | 2.07 |
| 2010 | jax | 3 | 9 | 0.333 | 5 | 7 | 0.714 | 0.425 | 2.03 | -0.16 |
| 1999 | sdg | 3 | 9 | 0.333 | 5 | 7 | 0.714 | 0.425 | 2.03 | -0.93 |
| 2003 | dal | 5 | 10 | 0.500 | 5 | 6 | 0.833 | 0.500 | 2.00 | 1.38 |
| 2012 | min | 5 | 10 | 0.500 | 5 | 6 | 0.833 | 0.500 | 2.00 | 1.25 |
| 2005 | nwe | 5 | 10 | 0.500 | 5 | 6 | 0.833 | 0.500 | 2.00 | 0.63 |
| 2001 | rav | 5 | 10 | 0.500 | 5 | 6 | 0.833 | 0.500 | 2.00 | 0.59 |
| 2007 | nyg | 5 | 10 | 0.500 | 5 | 6 | 0.833 | 0.500 | 2.00 | 0.14 |
| 1995 | phi | 4 | 8 | 0.500 | 6 | 8 | 0.750 | 0.500 | 2.00 | -0.84 |
| 2002 | nyg | 2 | 4 | 0.500 | 8 | 12 | 0.667 | 0.500 | 2.00 | 0.30 |
| 1994 | min | 3 | 6 | 0.500 | 7 | 10 | 0.700 | 0.500 | 2.00 | -1.42 |
| 1990 | mia | 6 | 9 | 0.667 | 6 | 7 | 0.857 | 0.575 | 1.98 | -0.68 |
| 1994 | nyg | 1 | 3 | 0.333 | 8 | 13 | 0.615 | 0.464 | 1.96 | -0.75 |
| 2016 | det | 1 | 3 | 0.333 | 8 | 13 | 0.615 | 0.464 | 1.96 | -1.03 |
| 2004 | pit | 9 | 10 | 0.900 | 6 | 6 | 1.000 | 0.690 | 1.86 | -2.14 |
| 1999 | crd | 2 | 10 | 0.200 | 4 | 6 | 0.667 | 0.357 | 1.86 | 0.52 |
| 2006 | sfo | 2 | 8 | 0.250 | 5 | 8 | 0.625 | 0.395 | 1.84 | 2.68 |
| 2001 | atl | 2 | 8 | 0.250 | 5 | 8 | 0.625 | 0.395 | 1.84 | 0.75 |
| 1990 | clt | 2 | 8 | 0.250 | 5 | 8 | 0.625 | 0.395 | 1.84 | 0.04 |
| 1998 | pit | 2 | 8 | 0.250 | 5 | 8 | 0.625 | 0.395 | 1.84 | -1.33 |
| 2015 | phi | 2 | 8 | 0.250 | 5 | 8 | 0.625 | 0.395 | 1.84 | -3.03 |
| 2004 | ram | 4 | 11 | 0.364 | 4 | 5 | 0.800 | 0.432 | 1.84 | 0.84 |
| 2017 | pit | 5 | 6 | 0.833 | 8 | 10 | 0.800 | 0.618 | 1.82 | -0.30 |
| 2012 | dal | 1 | 4 | 0.250 | 7 | 12 | 0.583 | 0.433 | 1.80 | 0.00 |
| 2000 | chi | 0 | 6 | 0.000 | 5 | 10 | 0.500 | 0.324 | 1.76 | 3.58 |
| 2003 | htx | 0 | 6 | 0.000 | 5 | 10 | 0.500 | 0.324 | 1.76 | -1.00 |
| 1996 | min | 3 | 7 | 0.429 | 6 | 9 | 0.667 | 0.472 | 1.75 | 1.75 |
| 2016 | oti | 3 | 7 | 0.429 | 6 | 9 | 0.667 | 0.472 | 1.75 | 1.00 |
| 1997 | min | 3 | 7 | 0.429 | 6 | 9 | 0.667 | 0.472 | 1.75 | -0.04 |
| 2000 | det | 3 | 7 | 0.429 | 6 | 9 | 0.667 | 0.472 | 1.75 | -1.24 |
| 1999 | mia | 3 | 7 | 0.429 | 6 | 9 | 0.667 | 0.472 | 1.75 | -1.73 |
| 2003 | nwe | 7 | 8 | 0.875 | 7 | 8 | 0.875 | 0.658 | 1.74 | 0.13 |
| 2009 | cle | 1 | 9 | 0.111 | 4 | 7 | 0.571 | 0.325 | 1.73 | -1.41 |
| 2005 | chi | 6 | 10 | 0.600 | 5 | 6 | 0.833 | 0.548 | 1.71 | 0.70 |
| 2013 | clt | 6 | 10 | 0.600 | 5 | 6 | 0.833 | 0.548 | 1.71 | 0.43 |
| 1991 | chi | 6 | 10 | 0.600 | 5 | 6 | 0.833 | 0.548 | 1.71 | -0.65 |
| 1998 | atl | 9 | 11 | 0.818 | 5 | 5 | 1.000 | 0.659 | 1.70 | 0.38 |
| 2005 | sfo | 0 | 8 | 0.000 | 4 | 8 | 0.500 | 0.289 | 1.68 | 1.84 |
| 2012 | phi | 0 | 8 | 0.000 | 4 | 8 | 0.500 | 0.289 | 1.68 | 0.83 |
| 2006 | cle | 0 | 8 | 0.000 | 4 | 8 | 0.500 | 0.289 | 1.68 | -0.25 |
| 1995 | sdg | 4 | 9 | 0.444 | 5 | 7 | 0.714 | 0.475 | 1.68 | 3.07 |
| 1996 | kan | 4 | 9 | 0.444 | 5 | 7 | 0.714 | 0.475 | 1.68 | 1.63 |
| 2017 | buf | 4 | 9 | 0.444 | 5 | 7 | 0.714 | 0.475 | 1.68 | 0.57 |
| 2014 | sdg | 4 | 9 | 0.444 | 5 | 7 | 0.714 | 0.475 | 1.68 | -1.47 |
| 1991 | det | 8 | 12 | 0.667 | 4 | 4 | 1.000 | 0.587 | 1.65 | -2.33 |
| 1997 | kan | 7 | 9 | 0.778 | 6 | 7 | 0.857 | 0.625 | 1.63 | -1.00 |
| 2009 | sdg | 7 | 9 | 0.778 | 6 | 7 | 0.857 | 0.625 | 1.63 | -1.57 |
| 2003 | kan | 7 | 9 | 0.778 | 6 | 7 | 0.857 | 0.625 | 1.63 | -1.75 |
| 1992 | gnb | 5 | 11 | 0.455 | 4 | 5 | 0.800 | 0.477 | 1.61 | -0.42 |
| 2005 | min | 5 | 11 | 0.455 | 4 | 5 | 0.800 | 0.477 | 1.61 | -1.25 |
| 2010 | was | 0 | 4 | 0.000 | 6 | 12 | 0.500 | 0.367 | 1.60 | -0.16 |
| 2013 | mia | 2 | 6 | 0.333 | 6 | 10 | 0.600 | 0.441 | 1.59 | -0.61 |
| 1993 | phi | 2 | 6 | 0.333 | 6 | 10 | 0.600 | 0.441 | 1.59 | -1.00 |
| 2013 | chi | 2 | 6 | 0.333 | 6 | 10 | 0.600 | 0.441 | 1.59 | -1.83 |
| 2010 | nor | 5 | 8 | 0.625 | 6 | 8 | 0.750 | 0.553 | 1.58 | 0.70 |
| 2008 | atl | 5 | 8 | 0.625 | 6 | 8 | 0.750 | 0.553 | 1.58 | 0.39 |
| 2000 | min | 5 | 8 | 0.625 | 6 | 8 | 0.750 | 0.553 | 1.58 | -0.43 |
| 2004 | atl | 5 | 8 | 0.625 | 6 | 8 | 0.750 | 0.553 | 1.58 | -0.68 |
| 2007 | den | 3 | 10 | 0.300 | 4 | 6 | 0.667 | 0.405 | 1.57 | 2.84 |
| 2007 | buf | 3 | 10 | 0.300 | 4 | 6 | 0.667 | 0.405 | 1.57 | 0.29 |
| 2008 | sfo | 3 | 10 | 0.300 | 4 | 6 | 0.667 | 0.405 | 1.57 | -2.84 |
| 1995 | cin | 1 | 5 | 0.200 | 6 | 11 | 0.545 | 0.406 | 1.53 | 0.00 |
| 2013 | oti | 1 | 5 | 0.200 | 6 | 11 | 0.545 | 0.406 | 1.53 | -0.48 |
| 2014 | car | 3 | 9 | 0.333 | 4.5 | 7 | 0.643 | 0.425 | 1.53 | 0.93 |
| 1993 | clt | 1 | 11 | 0.091 | 3 | 5 | 0.600 | 0.295 | 1.52 | 1.42 |
| 2004 | phi | 9 | 12 | 0.750 | 4 | 4 | 1.000 | 0.630 | 1.48 | 1.18 |
| 1991 | den | 4 | 5 | 0.800 | 8 | 11 | 0.727 | 0.594 | 1.47 | 0.68 |
| 2006 | clt | 4 | 5 | 0.800 | 8 | 11 | 0.727 | 0.594 | 1.47 | -0.68 |
| 2003 | ram | 7 | 10 | 0.700 | 5 | 6 | 0.833 | 0.595 | 1.43 | 1.84 |
| 2008 | car | 7 | 10 | 0.700 | 5 | 6 | 0.833 | 0.595 | 1.43 | 0.56 |
| 1993 | buf | 7 | 10 | 0.700 | 5 | 6 | 0.833 | 0.595 | 1.43 | -1.00 |
| 1993 | nor | 3 | 8 | 0.375 | 5 | 8 | 0.625 | 0.447 | 1.42 | 2.38 |
| 2000 | buf | 3 | 8 | 0.375 | 5 | 8 | 0.625 | 0.447 | 1.42 | 0.25 |
| 2006 | ram | 3 | 8 | 0.375 | 5 | 8 | 0.625 | 0.447 | 1.42 | -0.70 |
| 1994 | clt | 3 | 8 | 0.375 | 5 | 8 | 0.625 | 0.447 | 1.42 | -0.80 |
| 2009 | oti | 3 | 8 | 0.375 | 5 | 8 | 0.625 | 0.447 | 1.42 | -1.39 |
| 2002 | buf | 3 | 8 | 0.375 | 5 | 8 | 0.625 | 0.447 | 1.42 | -1.39 |
| 2010 | chi | 4 | 6 | 0.667 | 7 | 10 | 0.700 | 0.559 | 1.41 | 0.68 |
| 2012 | oti | 2 | 9 | 0.222 | 4 | 7 | 0.571 | 0.375 | 1.38 | 1.53 |
| 2017 | rai | 2 | 9 | 0.222 | 4 | 7 | 0.571 | 0.375 | 1.38 | 1.52 |
| 1997 | nor | 2 | 9 | 0.222 | 4 | 7 | 0.571 | 0.375 | 1.38 | 1.38 |
| 2004 | dal | 2 | 9 | 0.222 | 4 | 7 | 0.571 | 0.375 | 1.38 | 0.16 |
| 2001 | cin | 2 | 9 | 0.222 | 4 | 7 | 0.571 | 0.375 | 1.38 | -0.48 |
| 1998 | nor | 2 | 9 | 0.222 | 4 | 7 | 0.571 | 0.375 | 1.38 | -1.14 |
| 1997 | buf | 2 | 9 | 0.222 | 4 | 7 | 0.571 | 0.375 | 1.38 | -1.18 |
| 2014 | cin | 7 | 12 | 0.583 | 3.5 | 4 | 0.875 | 0.543 | 1.33 | -0.73 |
| 1996 | dal | 5 | 9 | 0.556 | 5 | 7 | 0.714 | 0.525 | 1.33 | -1.25 |
| 1991 | phi | 5 | 9 | 0.556 | 5 | 7 | 0.714 | 0.525 | 1.33 | -1.26 |
| 2010 | nwe | 10 | 12 | 0.833 | 4 | 4 | 1.000 | 0.674 | 1.30 | -0.14 |
| 2002 | crd | 2 | 11 | 0.182 | 3 | 5 | 0.600 | 0.341 | 1.30 | 2.43 |
| 1992 | sfo | 8 | 9 | 0.889 | 6 | 7 | 0.857 | 0.675 | 1.28 | -2.30 |
| 2016 | was | 3 | 7 | 0.429 | 5.5 | 9 | 0.611 | 0.472 | 1.25 | 2.07 |
| 2010 | atl | 6 | 7 | 0.857 | 7 | 9 | 0.778 | 0.639 | 1.25 | -0.02 |
| 2016 | dal | 6 | 7 | 0.857 | 7 | 9 | 0.778 | 0.639 | 1.25 | -0.17 |
| 2012 | atl | 6 | 7 | 0.857 | 7 | 9 | 0.778 | 0.639 | 1.25 | -0.82 |
| 1997 | atl | 2 | 7 | 0.286 | 5 | 9 | 0.556 | 0.417 | 1.25 | 1.70 |
| 2001 | crd | 2 | 7 | 0.286 | 5 | 9 | 0.556 | 0.417 | 1.25 | 1.30 |
| 2001 | oti | 2 | 7 | 0.286 | 5 | 9 | 0.556 | 0.417 | 1.25 | 0.43 |
| 2013 | min | 1 | 7 | 0.143 | 4.5 | 9 | 0.500 | 0.361 | 1.25 | 0.42 |
| 1994 | atl | 2 | 7 | 0.286 | 5 | 9 | 0.556 | 0.417 | 1.25 | -0.59 |
| 2015 | nor | 2 | 7 | 0.286 | 5 | 9 | 0.556 | 0.417 | 1.25 | -1.00 |
| 1995 | crd | 0 | 7 | 0.000 | 4 | 9 | 0.444 | 0.306 | 1.25 | 2.38 |
| 1996 | buf | 4 | 7 | 0.571 | 6 | 9 | 0.667 | 0.528 | 1.25 | 1.38 |
| 2007 | oti | 4 | 7 | 0.571 | 6 | 9 | 0.667 | 0.528 | 1.25 | 0.70 |
| 1991 | atl | 4 | 7 | 0.571 | 6 | 9 | 0.667 | 0.528 | 1.25 | 0.57 |
| 2016 | ram | 0 | 7 | 0.000 | 4 | 9 | 0.444 | 0.306 | 1.25 | 0.43 |
| 2009 | cin | 4 | 7 | 0.571 | 6 | 9 | 0.667 | 0.528 | 1.25 | -1.75 |
| 1998 | sdg | 0 | 5 | 0.000 | 5 | 11 | 0.455 | 0.344 | 1.22 | 2.03 |
| 2002 | pit | 6 | 10 | 0.600 | 4.5 | 6 | 0.750 | 0.548 | 1.21 | -1.33 |
| 2005 | phi | 1 | 6 | 0.167 | 5 | 10 | 0.500 | 0.382 | 1.18 | -1.38 |
| 2010 | sea | 5 | 14 | 0.357 | 2 | 2 | 1.000 | 0.420 | 1.16 | -1.68 |
| 1990 | chi | 7 | 11 | 0.636 | 4 | 5 | 0.800 | 0.568 | 1.16 | 1.71 |
| 1992 | pit | 7 | 11 | 0.636 | 4 | 5 | 0.800 | 0.568 | 1.16 | 1.00 |
| 2014 | crd | 7 | 11 | 0.636 | 4 | 5 | 0.800 | 0.568 | 1.16 | 0.70 |
| 2005 | cin | 7 | 11 | 0.636 | 4 | 5 | 0.800 | 0.568 | 1.16 | -2.03 |
| 2003 | phi | 6 | 8 | 0.750 | 6 | 8 | 0.750 | 0.605 | 1.16 | 1.48 |
| 2008 | pit | 6 | 8 | 0.750 | 6 | 8 | 0.750 | 0.605 | 1.16 | -3.22 |
| 2014 | was | 1 | 10 | 0.100 | 3 | 6 | 0.500 | 0.310 | 1.14 | 0.33 |
| 2006 | tam | 1 | 10 | 0.100 | 3 | 6 | 0.500 | 0.310 | 1.14 | 0.33 |
| 2007 | gnb | 8 | 10 | 0.800 | 5 | 6 | 0.833 | 0.643 | 1.14 | -3.42 |
| 1998 | cin | 0 | 9 | 0.000 | 3 | 7 | 0.429 | 0.275 | 1.08 | 0.70 |
| 1991 | ram | 0 | 9 | 0.000 | 3 | 7 | 0.429 | 0.275 | 1.08 | -0.71 |
| 2009 | det | 0 | 12 | 0.000 | 2 | 4 | 0.500 | 0.239 | 1.04 | -0.41 |
| 2010 | car | 0 | 12 | 0.000 | 2 | 4 | 0.500 | 0.239 | 1.04 | -2.00 |
| 1991 | pit | 3 | 9 | 0.333 | 4 | 7 | 0.571 | 0.425 | 1.03 | 1.16 |
| 2012 | nor | 3 | 9 | 0.333 | 4 | 7 | 0.571 | 0.425 | 1.03 | -0.38 |
| 1996 | sea | 3 | 9 | 0.333 | 4 | 7 | 0.571 | 0.425 | 1.03 | -1.59 |
| 1996 | jax | 2 | 4 | 0.500 | 7 | 12 | 0.583 | 0.500 | 1.00 | -1.26 |
| 2000 | nyj | 4 | 8 | 0.500 | 5 | 8 | 0.625 | 0.500 | 1.00 | 2.84 |
| 2006 | kan | 4 | 8 | 0.500 | 5 | 8 | 0.625 | 0.500 | 1.00 | 0.73 |
| 1993 | pit | 6 | 12 | 0.500 | 3 | 4 | 0.750 | 0.500 | 1.00 | 0.63 |
| 2005 | mia | 4 | 8 | 0.500 | 5 | 8 | 0.625 | 0.500 | 1.00 | 0.02 |
| 1998 | nwe | 4 | 8 | 0.500 | 5 | 8 | 0.625 | 0.500 | 1.00 | 0.00 |
| 1993 | mia | 4 | 8 | 0.500 | 5 | 8 | 0.625 | 0.500 | 1.00 | -0.25 |
| 2011 | nyg | 4 | 8 | 0.500 | 5 | 8 | 0.625 | 0.500 | 1.00 | -1.03 |
| 1992 | was | 4 | 8 | 0.500 | 5 | 8 | 0.625 | 0.500 | 1.00 | -1.75 |
| 2002 | nwe | 5 | 10 | 0.500 | 4 | 6 | 0.667 | 0.500 | 1.00 | 1.74 |
| 1994 | det | 3 | 6 | 0.500 | 6 | 10 | 0.600 | 0.500 | 1.00 | 0.58 |
| 2017 | oti | 3 | 6 | 0.500 | 6 | 10 | 0.600 | 0.500 | 1.00 | 0.33 |
| 1991 | rai | 3 | 6 | 0.500 | 6 | 10 | 0.600 | 0.500 | 1.00 | 0.17 |
| 2000 | gnb | 3 | 6 | 0.500 | 6 | 10 | 0.600 | 0.500 | 1.00 | -1.14 |
| 2016 | tam | 3 | 6 | 0.500 | 6 | 10 | 0.600 | 0.500 | 1.00 | -1.41 |
| 2008 | nyj | 5 | 10 | 0.500 | 4 | 6 | 0.667 | 0.500 | 1.00 | -1.84 |
| 1997 | pit | 6 | 9 | 0.667 | 5 | 7 | 0.714 | 0.575 | 0.98 | 1.84 |
| 1998 | jax | 6 | 9 | 0.667 | 5 | 7 | 0.714 | 0.575 | 0.98 | 0.48 |
| 2000 | den | 6 | 9 | 0.667 | 5 | 7 | 0.714 | 0.575 | 0.98 | -0.61 |
| 2001 | mia | 6 | 9 | 0.667 | 5 | 7 | 0.714 | 0.575 | 0.98 | -0.84 |
| 2007 | nwe | 12 | 12 | 1.000 | 4 | 4 | 1.000 | 0.761 | 0.96 | -0.07 |
| 2005 | clt | 11 | 13 | 0.846 | 3 | 3 | 1.000 | 0.688 | 0.94 | 1.47 |
| 2014 | den | 8 | 11 | 0.727 | 4 | 5 | 0.800 | 0.614 | 0.93 | 2.20 |
| 2014 | dal | 8 | 11 | 0.727 | 4 | 5 | 0.800 | 0.614 | 0.93 | -1.16 |
| 2015 | car | 9 | 9 | 1.000 | 6 | 7 | 0.857 | 0.725 | 0.93 | -2.00 |
| 2012 | ram | 3 | 8 | 0.375 | 4.5 | 8 | 0.563 | 0.447 | 0.92 | -1.00 |
| 1998 | den | 9 | 10 | 0.900 | 5 | 6 | 0.833 | 0.690 | 0.86 | -2.00 |
| 2010 | crd | 2 | 10 | 0.200 | 3 | 6 | 0.500 | 0.357 | 0.86 | 2.89 |
| 1993 | tam | 2 | 10 | 0.200 | 3 | 6 | 0.500 | 0.357 | 0.86 | 0.57 |
| 2004 | oti | 2 | 10 | 0.200 | 3 | 6 | 0.500 | 0.357 | 0.86 | -0.93 |
| 2015 | atl | 2 | 5 | 0.400 | 6 | 11 | 0.545 | 0.469 | 0.84 | -1.26 |
| 2016 | rav | 2 | 5 | 0.400 | 6 | 11 | 0.545 | 0.469 | 0.84 | -1.57 |
| 2005 | ram | 2 | 8 | 0.250 | 4 | 8 | 0.500 | 0.395 | 0.84 | 1.42 |
| 1998 | was | 2 | 8 | 0.250 | 4 | 8 | 0.500 | 0.395 | 0.84 | -0.02 |
| 1998 | rav | 2 | 8 | 0.250 | 4 | 8 | 0.500 | 0.395 | 0.84 | -0.75 |
| 2013 | buf | 2 | 8 | 0.250 | 4 | 8 | 0.500 | 0.395 | 0.84 | -1.03 |
| 2007 | car | 4 | 11 | 0.364 | 3 | 5 | 0.600 | 0.432 | 0.84 | 1.43 |
| 2007 | det | 4 | 11 | 0.364 | 3 | 5 | 0.600 | 0.432 | 0.84 | -0.96 |
| 2010 | nyg | 7 | 12 | 0.583 | 3 | 4 | 0.750 | 0.543 | 0.83 | 1.00 |
| 2013 | phi | 7 | 12 | 0.583 | 3 | 4 | 0.750 | 0.543 | 0.83 | -0.57 |
| 2003 | clt | 5 | 6 | 0.833 | 7 | 10 | 0.700 | 0.618 | 0.82 | -0.30 |
| 1994 | den | 1 | 4 | 0.250 | 6 | 12 | 0.500 | 0.433 | 0.80 | 0.61 |
| 2008 | cin | 2 | 11 | 0.182 | 2.5 | 5 | 0.500 | 0.341 | 0.80 | 1.25 |
| 2002 | chi | 0 | 6 | 0.000 | 4 | 10 | 0.400 | 0.324 | 0.76 | -0.33 |
| 2003 | nor | 3 | 7 | 0.429 | 5 | 9 | 0.556 | 0.472 | 0.75 | 2.25 |
| 2002 | sdg | 3 | 7 | 0.429 | 5 | 9 | 0.556 | 0.472 | 0.75 | 0.73 |
| 1990 | nor | 3 | 7 | 0.429 | 5 | 9 | 0.556 | 0.472 | 0.75 | 0.16 |
| 2002 | atl | 4 | 7 | 0.571 | 5.5 | 9 | 0.611 | 0.528 | 0.75 | -0.16 |
| 2016 | clt | 3 | 7 | 0.429 | 5 | 9 | 0.556 | 0.472 | 0.75 | -0.25 |
| 2008 | htx | 3 | 7 | 0.429 | 5 | 9 | 0.556 | 0.472 | 0.75 | -0.59 |
| 2004 | sfo | 0 | 11 | 0.000 | 2 | 5 | 0.400 | 0.250 | 0.75 | 1.68 |
| 1999 | cle | 0 | 11 | 0.000 | 2 | 5 | 0.400 | 0.250 | 0.75 | 0.71 |
| 2012 | kan | 0 | 11 | 0.000 | 2 | 5 | 0.400 | 0.250 | 0.75 | -0.86 |
| 2006 | crd | 1 | 7 | 0.143 | 4 | 9 | 0.444 | 0.361 | 0.75 | -0.84 |
| 2007 | rav | 1 | 7 | 0.143 | 4 | 9 | 0.444 | 0.361 | 0.75 | -1.70 |
| 2005 | tam | 5 | 7 | 0.714 | 6 | 9 | 0.667 | 0.583 | 0.75 | 1.14 |
| 2011 | sfo | 7 | 8 | 0.875 | 6 | 8 | 0.750 | 0.658 | 0.74 | -0.02 |
| 2005 | sea | 7 | 8 | 0.875 | 6 | 8 | 0.750 | 0.658 | 0.74 | -0.42 |
| 1996 | den | 7 | 8 | 0.875 | 6 | 8 | 0.750 | 0.658 | 0.74 | -0.70 |
| 1999 | clt | 7 | 8 | 0.875 | 6 | 8 | 0.750 | 0.658 | 0.74 | -1.38 |
| 2003 | sdg | 1 | 9 | 0.111 | 3 | 7 | 0.429 | 0.325 | 0.73 | 0.25 |
| 1997 | chi | 1 | 9 | 0.111 | 3 | 7 | 0.429 | 0.325 | 0.73 | -0.25 |
| 2007 | kan | 1 | 9 | 0.111 | 3 | 7 | 0.429 | 0.325 | 0.73 | -1.74 |
| 2010 | kan | 6 | 10 | 0.600 | 4 | 6 | 0.667 | 0.548 | 0.71 | 2.18 |
| 2005 | kan | 6 | 10 | 0.600 | 4 | 6 | 0.667 | 0.548 | 0.71 | 1.00 |
| 2000 | nor | 6 | 10 | 0.600 | 4 | 6 | 0.667 | 0.548 | 0.71 | 0.29 |
| 1990 | was | 6 | 10 | 0.600 | 4 | 6 | 0.667 | 0.548 | 0.71 | -0.07 |
| 2004 | gnb | 6 | 10 | 0.600 | 4 | 6 | 0.667 | 0.548 | 0.71 | -2.41 |
| 2000 | cle | 2 | 15 | 0.133 | 1 | 1 | 1.000 | 0.288 | 0.71 | -1.00 |
| 2008 | oti | 9 | 11 | 0.818 | 4 | 5 | 0.800 | 0.659 | 0.70 | 1.42 |
| 2011 | nor | 9 | 11 | 0.818 | 4 | 5 | 0.800 | 0.659 | 0.70 | 1.03 |
| 1990 | buf | 9 | 11 | 0.818 | 4 | 5 | 0.800 | 0.659 | 0.70 | 0.28 |
| 1997 | sfo | 9 | 11 | 0.818 | 4 | 5 | 0.800 | 0.659 | 0.70 | 0.14 |
| 2007 | dal | 9 | 11 | 0.818 | 4 | 5 | 0.800 | 0.659 | 0.70 | -0.29 |
| 2006 | chi | 9 | 11 | 0.818 | 4 | 5 | 0.800 | 0.659 | 0.70 | -0.33 |
| 2015 | crd | 9 | 11 | 0.818 | 4 | 5 | 0.800 | 0.659 | 0.70 | -1.92 |
| 1999 | cin | 2 | 12 | 0.167 | 2 | 4 | 0.500 | 0.326 | 0.70 | 0.32 |
| 1998 | phi | 0 | 8 | 0.000 | 3 | 8 | 0.375 | 0.289 | 0.68 | 0.18 |
| 2009 | nyg | 4 | 9 | 0.444 | 4 | 7 | 0.571 | 0.475 | 0.68 | 0.83 |
| 2011 | chi | 4 | 9 | 0.444 | 4 | 7 | 0.571 | 0.475 | 0.68 | -0.57 |
| 1992 | den | 4 | 9 | 0.444 | 4 | 7 | 0.571 | 0.475 | 0.68 | -3.26 |
| 1992 | sdg | 8 | 12 | 0.667 | 3 | 4 | 0.750 | 0.587 | 0.65 | -0.75 |
| 2013 | car | 7 | 9 | 0.778 | 5 | 7 | 0.714 | 0.625 | 0.63 | 1.53 |
| 2006 | nwe | 7 | 9 | 0.778 | 5 | 7 | 0.714 | 0.625 | 0.63 | 0.96 |
| 2003 | oti | 7 | 9 | 0.778 | 5 | 7 | 0.714 | 0.625 | 0.63 | 0.86 |
| 2010 | pit | 7 | 9 | 0.778 | 5 | 7 | 0.714 | 0.625 | 0.63 | 0.63 |
| 1994 | pit | 7 | 9 | 0.778 | 5 | 7 | 0.714 | 0.625 | 0.63 | -0.07 |
| 2011 | pit | 7 | 9 | 0.778 | 5 | 7 | 0.714 | 0.625 | 0.63 | -0.84 |
| 1998 | nyg | 5 | 11 | 0.455 | 3 | 5 | 0.600 | 0.477 | 0.61 | 2.86 |
| 2006 | gnb | 5 | 11 | 0.455 | 3 | 5 | 0.600 | 0.477 | 0.61 | 1.14 |
| 1995 | den | 5 | 11 | 0.455 | 3 | 5 | 0.600 | 0.477 | 0.61 | 0.74 |
| 2011 | nyj | 5 | 11 | 0.455 | 3 | 5 | 0.600 | 0.477 | 0.61 | 0.57 |
| 2009 | den | 5 | 11 | 0.455 | 3 | 5 | 0.600 | 0.477 | 0.61 | -0.63 |
| 2006 | pit | 5 | 11 | 0.455 | 3 | 5 | 0.600 | 0.477 | 0.61 | -2.73 |
| 2015 | rav | 0 | 4 | 0.000 | 5 | 12 | 0.417 | 0.367 | 0.60 | 0.84 |
| 2015 | rai | 2 | 6 | 0.333 | 5 | 10 | 0.500 | 0.441 | 0.59 | 3.25 |
| 2002 | rav | 2 | 6 | 0.333 | 5 | 10 | 0.500 | 0.441 | 0.59 | 0.16 |
| 2016 | gnb | 5 | 8 | 0.625 | 5 | 8 | 0.625 | 0.553 | 0.58 | 2.38 |
| 2013 | crd | 5 | 8 | 0.625 | 5 | 8 | 0.625 | 0.553 | 0.58 | 1.16 |
| 1997 | nwe | 5 | 8 | 0.625 | 5 | 8 | 0.625 | 0.553 | 0.58 | 1.00 |
| 2012 | cin | 5 | 8 | 0.625 | 5 | 8 | 0.625 | 0.553 | 0.58 | 0.16 |
| 2006 | nyj | 5 | 8 | 0.625 | 5 | 8 | 0.625 | 0.553 | 0.58 | -0.82 |
| 1995 | det | 5 | 8 | 0.625 | 5 | 8 | 0.625 | 0.553 | 0.58 | -0.98 |
| 2011 | det | 5 | 8 | 0.625 | 5 | 8 | 0.625 | 0.553 | 0.58 | -1.47 |
| 2015 | mia | 3 | 10 | 0.300 | 3 | 6 | 0.500 | 0.405 | 0.57 | 3.59 |
| 2012 | nyj | 3 | 10 | 0.300 | 3 | 6 | 0.500 | 0.405 | 0.57 | 2.57 |
| 1994 | tam | 3 | 10 | 0.300 | 3 | 6 | 0.500 | 0.405 | 0.57 | 2.38 |
| 1994 | nyj | 3 | 10 | 0.300 | 3 | 6 | 0.500 | 0.405 | 0.57 | -0.28 |
| 1992 | atl | 3 | 10 | 0.300 | 3 | 6 | 0.500 | 0.405 | 0.57 | -0.58 |
| 2011 | gnb | 10 | 10 | 1.000 | 5 | 6 | 0.833 | 0.738 | 0.57 | -0.86 |
| 1996 | ram | 3 | 10 | 0.300 | 3 | 6 | 0.500 | 0.405 | 0.57 | -0.98 |
| 1990 | tam | 3 | 10 | 0.300 | 3 | 6 | 0.500 | 0.405 | 0.57 | -1.63 |
| 2009 | car | 6 | 13 | 0.462 | 2 | 3 | 0.667 | 0.479 | 0.56 | 1.04 |
| 1999 | chi | 1 | 5 | 0.200 | 5 | 11 | 0.455 | 0.406 | 0.53 | 1.76 |
| 2015 | chi | 1 | 5 | 0.200 | 5 | 11 | 0.455 | 0.406 | 0.53 | -1.63 |
| 2000 | crd | 1 | 11 | 0.091 | 2 | 5 | 0.400 | 0.295 | 0.52 | 1.25 |
| 1993 | ram | 3 | 12 | 0.250 | 2 | 4 | 0.500 | 0.370 | 0.52 | -0.25 |
| 2009 | min | 9 | 12 | 0.750 | 3 | 4 | 0.750 | 0.630 | 0.48 | 0.02 |
| 2014 | nwe | 9 | 12 | 0.750 | 3 | 4 | 0.750 | 0.630 | 0.48 | -0.26 |
| 1993 | oti | 9 | 12 | 0.750 | 3 | 4 | 0.750 | 0.630 | 0.48 | -1.74 |
| 2016 | nwe | 10 | 11 | 0.909 | 4 | 5 | 0.800 | 0.705 | 0.48 | -0.14 |
| 1999 | jax | 10 | 11 | 0.909 | 4 | 5 | 0.800 | 0.705 | 0.48 | -1.68 |
| 1997 | nyg | 6 | 9 | 0.667 | 4.5 | 7 | 0.643 | 0.575 | 0.48 | 0.61 |
| 2014 | clt | 7 | 10 | 0.700 | 4 | 6 | 0.667 | 0.595 | 0.43 | 2.53 |
| 2016 | pit | 7 | 10 | 0.700 | 4 | 6 | 0.667 | 0.595 | 0.43 | 1.82 |
| 2017 | ram | 7 | 10 | 0.700 | 4 | 6 | 0.667 | 0.595 | 0.43 | 1.63 |
| 1992 | buf | 7 | 10 | 0.700 | 4 | 6 | 0.667 | 0.595 | 0.43 | 1.43 |
| 1999 | buf | 7 | 10 | 0.700 | 4 | 6 | 0.667 | 0.595 | 0.43 | 1.42 |
| 2002 | oti | 7 | 10 | 0.700 | 4 | 6 | 0.667 | 0.595 | 0.43 | 0.63 |
| 2007 | jax | 7 | 10 | 0.700 | 4 | 6 | 0.667 | 0.595 | 0.43 | 0.18 |
| 1991 | dal | 7 | 10 | 0.700 | 4 | 6 | 0.667 | 0.595 | 0.43 | -0.14 |
| 2009 | phi | 7 | 10 | 0.700 | 4 | 6 | 0.667 | 0.595 | 0.43 | -0.25 |
| 1993 | kan | 7 | 10 | 0.700 | 4 | 6 | 0.667 | 0.595 | 0.43 | -0.29 |
| 1992 | sea | 0 | 10 | 0.000 | 2 | 6 | 0.333 | 0.262 | 0.43 | -0.71 |
| 2015 | min | 7 | 10 | 0.700 | 4 | 6 | 0.667 | 0.595 | 0.43 | -1.29 |
| 2002 | car | 3 | 8 | 0.375 | 4 | 8 | 0.500 | 0.447 | 0.42 | 3.00 |
| 2001 | nyg | 3 | 8 | 0.375 | 4 | 8 | 0.500 | 0.447 | 0.42 | 2.00 |
| 2015 | det | 3 | 8 | 0.375 | 4 | 8 | 0.500 | 0.447 | 0.42 | 1.96 |
| 2015 | ram | 3 | 8 | 0.375 | 4 | 8 | 0.500 | 0.447 | 0.42 | 1.25 |
| 2014 | min | 3 | 8 | 0.375 | 4 | 8 | 0.500 | 0.447 | 0.42 | 0.43 |
| 2002 | sea | 3 | 8 | 0.375 | 4 | 8 | 0.500 | 0.447 | 0.42 | -0.25 |
| 1995 | car | 3 | 8 | 0.375 | 4 | 8 | 0.500 | 0.447 | 0.42 | -0.30 |
| 2017 | cin | 3 | 8 | 0.375 | 4 | 8 | 0.500 | 0.447 | 0.42 | -0.71 |
| 2014 | cle | 3 | 8 | 0.375 | 4 | 8 | 0.500 | 0.447 | 0.42 | -1.14 |
| 2010 | mia | 3 | 8 | 0.375 | 4 | 8 | 0.500 | 0.447 | 0.42 | -1.33 |
| 2017 | atl | 4 | 6 | 0.667 | 6 | 10 | 0.600 | 0.559 | 0.41 | 0.42 |
| 2012 | rav | 4 | 6 | 0.667 | 6 | 10 | 0.600 | 0.559 | 0.41 | 0.00 |
| 1991 | kan | 4 | 6 | 0.667 | 6 | 10 | 0.600 | 0.559 | 0.41 | -0.57 |
| 2010 | rav | 4 | 4 | 1.000 | 8 | 12 | 0.667 | 0.633 | 0.40 | 0.14 |
| 2009 | atl | 6 | 11 | 0.545 | 3 | 5 | 0.600 | 0.523 | 0.39 | 1.25 |
| 2008 | crd | 6 | 11 | 0.545 | 3 | 5 | 0.600 | 0.523 | 0.39 | 0.16 |
| 1994 | chi | 6 | 11 | 0.545 | 3 | 5 | 0.600 | 0.523 | 0.39 | -1.53 |
| 2012 | crd | 2 | 9 | 0.222 | 3 | 7 | 0.429 | 0.375 | 0.38 | 0.58 |
| 1999 | atl | 2 | 9 | 0.222 | 3 | 7 | 0.429 | 0.375 | 0.38 | 0.30 |
| 2016 | nyj | 2 | 9 | 0.222 | 3 | 7 | 0.429 | 0.375 | 0.38 | -0.16 |
| 1996 | nyg | 4 | 12 | 0.333 | 2 | 4 | 0.500 | 0.413 | 0.35 | 0.48 |
| 2015 | was | 5 | 9 | 0.556 | 4 | 7 | 0.571 | 0.525 | 0.33 | 1.25 |
| 2007 | tam | 5 | 9 | 0.556 | 4 | 7 | 0.571 | 0.525 | 0.33 | -1.25 |
| 2000 | cin | 3 | 14 | 0.214 | 1 | 2 | 0.500 | 0.340 | 0.32 | 1.38 |
| 1996 | pit | 8 | 13 | 0.615 | 2 | 3 | 0.667 | 0.563 | 0.31 | 0.98 |
| 2000 | atl | 2 | 11 | 0.182 | 2 | 5 | 0.400 | 0.341 | 0.30 | 1.84 |
| 2012 | rai | 2 | 11 | 0.182 | 2 | 5 | 0.400 | 0.341 | 0.30 | -0.14 |
| 2003 | nyg | 2 | 11 | 0.182 | 2 | 5 | 0.400 | 0.341 | 0.30 | -0.58 |
| 1999 | sfo | 2 | 11 | 0.182 | 2 | 5 | 0.400 | 0.341 | 0.30 | -0.83 |
| 2002 | was | 4 | 10 | 0.400 | 3 | 6 | 0.500 | 0.452 | 0.29 | -0.47 |
| 2008 | buf | 4 | 10 | 0.400 | 3 | 6 | 0.500 | 0.452 | 0.29 | -1.33 |
| 2013 | nyg | 4 | 10 | 0.400 | 3 | 6 | 0.500 | 0.452 | 0.29 | -1.44 |
| 2001 | nor | 4 | 10 | 0.400 | 3 | 6 | 0.500 | 0.452 | 0.29 | -2.18 |
| 2001 | pit | 8 | 9 | 0.889 | 5 | 7 | 0.714 | 0.675 | 0.28 | 1.21 |
| 1991 | buf | 8 | 9 | 0.889 | 5 | 7 | 0.714 | 0.675 | 0.28 | 0.43 |
| 1990 | nyg | 8 | 9 | 0.889 | 5 | 7 | 0.714 | 0.675 | 0.28 | 0.00 |
| 2007 | atl | 1 | 8 | 0.125 | 3 | 8 | 0.375 | 0.342 | 0.26 | 1.58 |
| 1995 | jax | 1 | 8 | 0.125 | 3 | 8 | 0.375 | 0.342 | 0.26 | 1.00 |
| 2010 | buf | 1 | 8 | 0.125 | 3 | 8 | 0.375 | 0.342 | 0.26 | -0.58 |
| 2011 | oti | 4 | 7 | 0.571 | 5 | 9 | 0.556 | 0.528 | 0.25 | 1.38 |
| 1997 | nyj | 4 | 7 | 0.571 | 5 | 9 | 0.556 | 0.528 | 0.25 | 0.14 |
| 2016 | sea | 5 | 7 | 0.714 | 5.5 | 9 | 0.611 | 0.583 | 0.25 | -1.25 |
| 2004 | sdg | 6 | 7 | 0.857 | 6 | 9 | 0.667 | 0.639 | 0.25 | -2.38 |
| 2016 | kan | 6 | 7 | 0.857 | 6 | 9 | 0.667 | 0.639 | 0.25 | -2.73 |
| 2005 | cle | 2 | 7 | 0.286 | 4 | 9 | 0.444 | 0.417 | 0.25 | 1.68 |
| 2001 | buf | 0 | 7 | 0.000 | 3 | 9 | 0.333 | 0.306 | 0.25 | 1.42 |
| 2001 | kan | 2 | 7 | 0.286 | 4 | 9 | 0.444 | 0.417 | 0.25 | -2.53 |
| 2003 | jax | 1 | 6 | 0.167 | 4 | 10 | 0.400 | 0.382 | 0.18 | 3.53 |
| 2008 | jax | 1 | 6 | 0.167 | 4 | 10 | 0.400 | 0.382 | 0.18 | 2.18 |
| 2002 | dal | 1 | 6 | 0.167 | 4 | 10 | 0.400 | 0.382 | 0.18 | 2.00 |
| 2004 | rai | 1 | 6 | 0.167 | 4 | 10 | 0.400 | 0.382 | 0.18 | -0.14 |
| 1999 | phi | 1 | 6 | 0.167 | 4 | 10 | 0.400 | 0.382 | 0.18 | -0.38 |
| 2015 | jax | 1 | 6 | 0.167 | 4 | 10 | 0.400 | 0.382 | 0.18 | -1.82 |
| 2006 | was | 1 | 6 | 0.167 | 4 | 10 | 0.400 | 0.382 | 0.18 | -1.84 |
| 1992 | rai | 5 | 12 | 0.417 | 2 | 4 | 0.500 | 0.457 | 0.17 | 3.80 |
| 2007 | nor | 5 | 12 | 0.417 | 2 | 4 | 0.500 | 0.457 | 0.17 | -2.25 |
| 1997 | car | 5 | 12 | 0.417 | 2 | 4 | 0.500 | 0.457 | 0.17 | -3.16 |
| 2009 | crd | 7 | 11 | 0.636 | 3 | 5 | 0.600 | 0.568 | 0.16 | 0.86 |
| 2003 | rav | 7 | 11 | 0.636 | 3 | 5 | 0.600 | 0.568 | 0.16 | -0.29 |
| 2003 | den | 7 | 11 | 0.636 | 3 | 5 | 0.600 | 0.568 | 0.16 | -0.57 |
| 1992 | min | 6 | 8 | 0.750 | 5 | 8 | 0.625 | 0.605 | 0.16 | 2.42 |
| 2013 | cin | 6 | 8 | 0.750 | 5 | 8 | 0.625 | 0.605 | 0.16 | 1.33 |
| 2010 | nyj | 6 | 8 | 0.750 | 5 | 8 | 0.625 | 0.605 | 0.16 | 0.61 |
| 1991 | nor | 6 | 8 | 0.750 | 5 | 8 | 0.625 | 0.605 | 0.16 | -1.68 |
| 1999 | tam | 6 | 8 | 0.750 | 5 | 8 | 0.625 | 0.605 | 0.16 | -1.75 |
| 2005 | dal | 3 | 5 | 0.600 | 6 | 11 | 0.545 | 0.531 | 0.16 | -0.17 |
| 1990 | cle | 1 | 10 | 0.100 | 2 | 6 | 0.333 | 0.310 | 0.14 | -1.16 |
| 2000 | rav | 8 | 10 | 0.800 | 4 | 6 | 0.667 | 0.643 | 0.14 | 2.00 |
| 2008 | nyg | 8 | 10 | 0.800 | 4 | 6 | 0.667 | 0.643 | 0.14 | 0.68 |
| 2011 | rav | 8 | 10 | 0.800 | 4 | 6 | 0.667 | 0.643 | 0.14 | 0.41 |
| 1998 | sfo | 8 | 10 | 0.800 | 4 | 6 | 0.667 | 0.643 | 0.14 | 0.30 |
| 1998 | nyj | 8 | 10 | 0.800 | 4 | 6 | 0.667 | 0.643 | 0.14 | -0.75 |
| 1993 | dal | 8 | 10 | 0.800 | 4 | 6 | 0.667 | 0.643 | 0.14 | -2.08 |
| 2004 | nwe | 11 | 12 | 0.917 | 3 | 4 | 0.750 | 0.717 | 0.13 | 2.00 |
| 2012 | jax | 0 | 9 | 0.000 | 2 | 7 | 0.286 | 0.275 | 0.07 | 2.43 |
| 2008 | rai | 3 | 11 | 0.273 | 2 | 5 | 0.400 | 0.386 | 0.07 | 3.08 |
| 2017 | den | 3 | 11 | 0.273 | 2 | 5 | 0.400 | 0.386 | 0.07 | -0.41 |
| 2014 | jax | 2 | 13 | 0.154 | 1 | 3 | 0.333 | 0.313 | 0.06 | 0.18 |
| 1991 | clt | 0 | 12 | 0.000 | 1 | 4 | 0.250 | 0.239 | 0.04 | 3.03 |
| 2014 | ram | 3 | 9 | 0.333 | 3 | 7 | 0.429 | 0.425 | 0.02 | 0.42 |
| 2006 | htx | 3 | 9 | 0.333 | 3 | 7 | 0.429 | 0.425 | 0.02 | 0.00 |
| 2005 | rav | 3 | 9 | 0.333 | 3 | 7 | 0.429 | 0.425 | 0.02 | -0.14 |
| 1990 | nyj | 3 | 9 | 0.333 | 3 | 7 | 0.429 | 0.425 | 0.02 | -0.84 |
| 2006 | mia | 3 | 9 | 0.333 | 3 | 7 | 0.429 | 0.425 | 0.02 | -0.93 |
| 2010 | min | 3 | 9 | 0.333 | 3 | 7 | 0.429 | 0.425 | 0.02 | -2.47 |
| 1996 | cin | 4 | 8 | 0.500 | 4 | 8 | 0.500 | 0.500 | 0.00 | 2.38 |
| 2006 | nyg | 5 | 10 | 0.500 | 3 | 6 | 0.500 | 0.500 | 0.00 | 2.00 |
| 1999 | det | 5 | 10 | 0.500 | 3 | 6 | 0.500 | 0.500 | 0.00 | 1.75 |
| 2004 | min | 3 | 6 | 0.500 | 5 | 10 | 0.500 | 0.500 | 0.00 | 1.61 |
| 1994 | crd | 3 | 6 | 0.500 | 5 | 10 | 0.500 | 0.500 | 0.00 | 1.25 |
| 2004 | cin | 4 | 8 | 0.500 | 4 | 8 | 0.500 | 0.500 | 0.00 | 1.16 |
| 1995 | sea | 4 | 8 | 0.500 | 4 | 8 | 0.500 | 0.500 | 0.00 | 1.03 |
| 1999 | gnb | 5 | 10 | 0.500 | 3 | 6 | 0.500 | 0.500 | 0.00 | 1.00 |
| 2013 | dal | 3 | 6 | 0.500 | 5 | 10 | 0.500 | 0.500 | 0.00 | 0.93 |
| 2006 | car | 4 | 8 | 0.500 | 4 | 8 | 0.500 | 0.500 | 0.00 | 0.84 |
| 2007 | htx | 6 | 12 | 0.500 | 2 | 4 | 0.500 | 0.500 | 0.00 | 0.75 |
| 2001 | was | 5 | 10 | 0.500 | 3 | 6 | 0.500 | 0.500 | 0.00 | 0.29 |
| 1991 | min | 4 | 8 | 0.500 | 4 | 8 | 0.500 | 0.500 | 0.00 | 0.16 |
| 1991 | nyg | 2 | 4 | 0.500 | 6 | 12 | 0.500 | 0.500 | 0.00 | -0.92 |
| 1999 | nwe | 3 | 6 | 0.500 | 5 | 10 | 0.500 | 0.500 | 0.00 | -1.41 |
| 2013 | rav | 3 | 6 | 0.500 | 5 | 10 | 0.500 | 0.500 | 0.00 | -1.86 |
| 1999 | car | 5 | 10 | 0.500 | 3 | 6 | 0.500 | 0.500 | 0.00 | -2.29 |
| 2015 | buf | 5 | 10 | 0.500 | 3 | 6 | 0.500 | 0.500 | 0.00 | -2.42 |
| 2012 | sfo | 9 | 12 | 0.750 | 2.5 | 4 | 0.625 | 0.630 | -0.02 | -0.30 |
| 2011 | atl | 6 | 9 | 0.667 | 4 | 7 | 0.571 | 0.575 | -0.02 | 1.25 |
| 2006 | nor | 6 | 9 | 0.667 | 4 | 7 | 0.571 | 0.575 | -0.02 | 0.17 |
| 1997 | tam | 6 | 9 | 0.667 | 4 | 7 | 0.571 | 0.575 | -0.02 | -0.68 |
| 1999 | was | 6 | 9 | 0.667 | 4 | 7 | 0.571 | 0.575 | -0.02 | -1.59 |
| 1998 | min | 12 | 12 | 1.000 | 3 | 4 | 0.750 | 0.761 | -0.04 | -1.60 |
| 1996 | gnb | 11 | 13 | 0.846 | 2 | 3 | 0.667 | 0.688 | -0.06 | -0.14 |
| 1995 | pit | 8 | 11 | 0.727 | 3 | 5 | 0.600 | 0.614 | -0.07 | 0.31 |
| 2001 | phi | 8 | 11 | 0.727 | 3 | 5 | 0.600 | 0.614 | -0.07 | -1.14 |
| 2008 | nwe | 8 | 11 | 0.727 | 3 | 5 | 0.600 | 0.614 | -0.07 | -2.26 |
| 1991 | was | 9 | 9 | 1.000 | 5 | 7 | 0.714 | 0.725 | -0.07 | 1.00 |
| 2006 | sdg | 9 | 9 | 1.000 | 5 | 7 | 0.714 | 0.725 | -0.07 | -0.52 |
| 2001 | ram | 9 | 9 | 1.000 | 5 | 7 | 0.714 | 0.725 | -0.07 | -1.00 |
| 1990 | pit | 8 | 14 | 0.571 | 1 | 2 | 0.500 | 0.540 | -0.08 | 1.03 |
| 2002 | htx | 2 | 10 | 0.200 | 2 | 6 | 0.333 | 0.357 | -0.14 | 1.76 |
| 2008 | cle | 2 | 10 | 0.200 | 2 | 6 | 0.333 | 0.357 | -0.14 | 1.73 |
| 2006 | rav | 9 | 10 | 0.900 | 4 | 6 | 0.667 | 0.690 | -0.14 | 0.75 |
| 2005 | nyj | 2 | 10 | 0.200 | 2 | 6 | 0.333 | 0.357 | -0.14 | 0.58 |
| 2013 | cle | 2 | 10 | 0.200 | 2 | 6 | 0.333 | 0.357 | -0.14 | 0.42 |
| 1992 | dal | 9 | 10 | 0.900 | 4 | 6 | 0.667 | 0.690 | -0.14 | 0.14 |
| 2017 | nwe | 9 | 10 | 0.900 | 4 | 6 | 0.667 | 0.690 | -0.14 | -0.07 |
| 2013 | rai | 2 | 10 | 0.200 | 2 | 6 | 0.333 | 0.357 | -0.14 | -0.28 |
| 2005 | den | 9 | 10 | 0.900 | 4 | 6 | 0.667 | 0.690 | -0.14 | -0.29 |
| 1997 | gnb | 9 | 10 | 0.900 | 4 | 6 | 0.667 | 0.690 | -0.14 | -0.38 |
| 2005 | rai | 2 | 10 | 0.200 | 2 | 6 | 0.333 | 0.357 | -0.14 | -0.48 |
| 2017 | phi | 9 | 10 | 0.900 | 4 | 6 | 0.667 | 0.690 | -0.14 | -0.80 |
| 2011 | nwe | 9 | 10 | 0.900 | 4 | 6 | 0.667 | 0.690 | -0.14 | -1.68 |
| 2013 | tam | 2 | 10 | 0.200 | 2 | 6 | 0.333 | 0.357 | -0.14 | -2.25 |
| 2003 | atl | 2 | 8 | 0.250 | 3 | 8 | 0.375 | 0.395 | -0.16 | 1.58 |
| 1992 | tam | 2 | 8 | 0.250 | 3 | 8 | 0.375 | 0.395 | -0.16 | 0.86 |
| 2011 | jax | 2 | 8 | 0.250 | 3 | 8 | 0.375 | 0.395 | -0.16 | 0.07 |
| 1998 | det | 2 | 8 | 0.250 | 3 | 8 | 0.375 | 0.395 | -0.16 | 0.00 |
| 2012 | cle | 2 | 8 | 0.250 | 3 | 8 | 0.375 | 0.395 | -0.16 | -0.14 |
| 2011 | was | 2 | 8 | 0.250 | 3 | 8 | 0.375 | 0.395 | -0.16 | -0.25 |
| 2017 | nyj | 2 | 8 | 0.250 | 3 | 8 | 0.375 | 0.395 | -0.16 | -1.43 |
| 1995 | nwe | 4 | 11 | 0.364 | 2 | 5 | 0.400 | 0.432 | -0.16 | -0.38 |
| 1990 | gnb | 4 | 11 | 0.364 | 2 | 5 | 0.400 | 0.432 | -0.16 | -1.16 |
| 2017 | dal | 7 | 12 | 0.583 | 2 | 4 | 0.500 | 0.543 | -0.17 | 3.59 |
| 2006 | dal | 7 | 12 | 0.583 | 2 | 4 | 0.500 | 0.543 | -0.17 | 0.70 |
| 2009 | sea | 4 | 13 | 0.308 | 1 | 3 | 0.333 | 0.396 | -0.19 | 1.16 |
| 2003 | nyj | 1 | 4 | 0.250 | 5 | 12 | 0.417 | 0.433 | -0.20 | -0.84 |
| 2013 | nwe | 5 | 5 | 1.000 | 7 | 11 | 0.636 | 0.656 | -0.22 | 0.48 |
| 1994 | cin | 0 | 6 | 0.000 | 3 | 10 | 0.300 | 0.324 | -0.24 | 1.53 |
| 2002 | det | 0 | 6 | 0.000 | 3 | 10 | 0.300 | 0.324 | -0.24 | -1.16 |
| 1990 | nwe | 0 | 11 | 0.000 | 1 | 5 | 0.200 | 0.250 | -0.25 | 2.26 |
| 2009 | ram | 0 | 11 | 0.000 | 1 | 5 | 0.200 | 0.250 | -0.25 | -1.00 |
| 1994 | ram | 1 | 7 | 0.143 | 3 | 9 | 0.333 | 0.361 | -0.25 | 2.86 |
| 1997 | crd | 1 | 7 | 0.143 | 3 | 9 | 0.333 | 0.361 | -0.25 | 2.59 |
| 2003 | sea | 5 | 7 | 0.714 | 5 | 9 | 0.556 | 0.583 | -0.25 | 2.42 |
| 2013 | gnb | 4 | 7 | 0.571 | 4.5 | 9 | 0.500 | 0.528 | -0.25 | 2.16 |
| 2010 | tam | 5 | 7 | 0.714 | 5 | 9 | 0.556 | 0.583 | -0.25 | 2.08 |
| 2004 | mia | 1 | 7 | 0.143 | 3 | 9 | 0.333 | 0.361 | -0.25 | 1.00 |
| 1998 | chi | 1 | 7 | 0.143 | 3 | 9 | 0.333 | 0.361 | -0.25 | 0.53 |
| 2000 | kan | 3 | 7 | 0.429 | 4 | 9 | 0.444 | 0.472 | -0.25 | 0.25 |
| 2017 | clt | 1 | 7 | 0.143 | 3 | 9 | 0.333 | 0.361 | -0.25 | -0.02 |
| 2007 | cle | 5 | 7 | 0.714 | 5 | 9 | 0.556 | 0.583 | -0.25 | -0.14 |
| 2011 | cle | 1 | 7 | 0.143 | 3 | 9 | 0.333 | 0.361 | -0.25 | -0.16 |
| 1996 | rav | 1 | 7 | 0.143 | 3 | 9 | 0.333 | 0.361 | -0.25 | -0.66 |
| 2012 | was | 5 | 7 | 0.714 | 5 | 9 | 0.556 | 0.583 | -0.25 | -0.74 |
| 2010 | clt | 5 | 7 | 0.714 | 5 | 9 | 0.556 | 0.583 | -0.25 | -0.86 |
| 1994 | mia | 5 | 7 | 0.714 | 5 | 9 | 0.556 | 0.583 | -0.25 | -1.03 |
| 2014 | nyj | 1 | 7 | 0.143 | 3 | 9 | 0.333 | 0.361 | -0.25 | -1.75 |
| 2010 | phi | 5 | 7 | 0.714 | 5 | 9 | 0.556 | 0.583 | -0.25 | -2.03 |
| 2001 | sfo | 7 | 8 | 0.875 | 5 | 8 | 0.625 | 0.658 | -0.26 | 2.75 |
| 2015 | nwe | 7 | 8 | 0.875 | 5 | 8 | 0.625 | 0.658 | -0.26 | 0.48 |
| 2000 | rai | 7 | 8 | 0.875 | 5 | 8 | 0.625 | 0.658 | -0.26 | -2.22 |
| 2014 | rai | 1 | 9 | 0.111 | 2 | 7 | 0.286 | 0.325 | -0.28 | 0.59 |
| 2005 | nor | 1 | 9 | 0.111 | 2 | 7 | 0.286 | 0.325 | -0.28 | -0.02 |
| 1993 | cin | 1 | 9 | 0.111 | 2 | 7 | 0.286 | 0.325 | -0.28 | -0.24 |
| 1995 | nyj | 1 | 9 | 0.111 | 2 | 7 | 0.286 | 0.325 | -0.28 | -2.28 |
| 2015 | htx | 6 | 10 | 0.600 | 3 | 6 | 0.500 | 0.548 | -0.29 | 4.18 |
| 1994 | kan | 6 | 10 | 0.600 | 3 | 6 | 0.500 | 0.548 | -0.29 | 2.16 |
| 2006 | den | 6 | 10 | 0.600 | 3 | 6 | 0.500 | 0.548 | -0.29 | 1.57 |
| 2004 | rav | 6 | 10 | 0.600 | 3 | 6 | 0.500 | 0.548 | -0.29 | 0.02 |
| 1999 | sea | 6 | 10 | 0.600 | 3 | 6 | 0.500 | 0.548 | -0.29 | -0.58 |
| 2008 | dal | 6 | 10 | 0.600 | 3 | 6 | 0.500 | 0.548 | -0.29 | -1.26 |
| 2013 | sfo | 9 | 11 | 0.818 | 3 | 5 | 0.600 | 0.659 | -0.30 | 2.84 |
| 2004 | clt | 9 | 11 | 0.818 | 3 | 5 | 0.600 | 0.659 | -0.30 | 0.94 |
| 1996 | car | 9 | 11 | 0.818 | 3 | 5 | 0.600 | 0.659 | -0.30 | 0.17 |
| 2007 | cin | 4 | 9 | 0.444 | 3 | 7 | 0.429 | 0.475 | -0.33 | 0.80 |
| 2003 | chi | 4 | 9 | 0.444 | 3 | 7 | 0.429 | 0.475 | -0.33 | -0.43 |
| 2007 | chi | 4 | 9 | 0.444 | 3 | 7 | 0.429 | 0.475 | -0.33 | -0.59 |
| 1993 | nyg | 7 | 9 | 0.778 | 4 | 7 | 0.571 | 0.625 | -0.38 | 1.96 |
| 2001 | nwe | 7 | 9 | 0.778 | 4 | 7 | 0.571 | 0.625 | -0.38 | 1.00 |
| 1996 | nwe | 7 | 9 | 0.778 | 4 | 7 | 0.571 | 0.625 | -0.38 | 0.58 |
| 1990 | kan | 7 | 9 | 0.778 | 4 | 7 | 0.571 | 0.625 | -0.38 | 0.41 |
| 2015 | kan | 7 | 9 | 0.778 | 4 | 7 | 0.571 | 0.625 | -0.38 | 0.25 |
| 2005 | car | 7 | 9 | 0.778 | 4 | 7 | 0.571 | 0.625 | -0.38 | 0.00 |
| 1998 | gnb | 7 | 9 | 0.778 | 4 | 7 | 0.571 | 0.625 | -0.38 | 0.00 |
| 2000 | phi | 7 | 9 | 0.778 | 4 | 7 | 0.571 | 0.625 | -0.38 | -0.07 |
| 1994 | cle | 7 | 9 | 0.778 | 4 | 7 | 0.571 | 0.625 | -0.38 | -0.43 |
| 2014 | pit | 7 | 9 | 0.778 | 4 | 7 | 0.571 | 0.625 | -0.38 | -0.84 |
| 2013 | nor | 7 | 9 | 0.778 | 4 | 7 | 0.571 | 0.625 | -0.38 | -1.00 |
| 2006 | atl | 5 | 11 | 0.455 | 2 | 5 | 0.400 | 0.477 | -0.39 | 0.26 |
| 2010 | det | 2 | 6 | 0.333 | 4 | 10 | 0.400 | 0.441 | -0.41 | 0.58 |
| 1995 | was | 2 | 6 | 0.333 | 4 | 10 | 0.400 | 0.441 | -0.41 | -0.42 |
| 2002 | den | 5 | 8 | 0.625 | 4 | 8 | 0.500 | 0.553 | -0.42 | 0.16 |
| 1999 | kan | 5 | 8 | 0.625 | 4 | 8 | 0.500 | 0.553 | -0.42 | -0.25 |
| 1993 | gnb | 5 | 8 | 0.625 | 4 | 8 | 0.500 | 0.553 | -0.42 | -0.42 |
| 2006 | sea | 5 | 8 | 0.625 | 4 | 8 | 0.500 | 0.553 | -0.42 | -0.84 |
| 1994 | gnb | 5 | 8 | 0.625 | 4 | 8 | 0.500 | 0.553 | -0.42 | -0.86 |
| 1996 | was | 5 | 8 | 0.625 | 4 | 8 | 0.500 | 0.553 | -0.42 | -0.92 |
| 2004 | chi | 3 | 10 | 0.300 | 2 | 6 | 0.333 | 0.405 | -0.43 | 1.71 |
| 1995 | cle | 3 | 10 | 0.300 | 2 | 6 | 0.333 | 0.405 | -0.43 | -0.25 |
| 1992 | cin | 3 | 10 | 0.300 | 2 | 6 | 0.333 | 0.405 | -0.43 | -0.28 |
| 1990 | crd | 3 | 10 | 0.300 | 2 | 6 | 0.333 | 0.405 | -0.43 | -0.93 |
| 2001 | min | 3 | 10 | 0.300 | 2 | 6 | 0.333 | 0.405 | -0.43 | -1.16 |
| 2001 | dal | 1 | 5 | 0.200 | 4 | 11 | 0.364 | 0.406 | -0.47 | 0.18 |
| 2003 | was | 1 | 5 | 0.200 | 4 | 11 | 0.364 | 0.406 | -0.47 | -1.16 |
| 2002 | cin | 1 | 11 | 0.091 | 1 | 5 | 0.200 | 0.295 | -0.48 | 2.53 |
| 2014 | oti | 1 | 11 | 0.091 | 1 | 5 | 0.200 | 0.295 | -0.48 | -0.74 |
| 2006 | rai | 1 | 11 | 0.091 | 1 | 5 | 0.200 | 0.295 | -0.48 | -1.16 |
| 2007 | sdg | 9 | 12 | 0.750 | 2 | 4 | 0.500 | 0.630 | -0.52 | -3.75 |
| 2009 | nor | 10 | 11 | 0.909 | 3 | 5 | 0.600 | 0.705 | -0.52 | 1.58 |
| 2017 | min | 10 | 11 | 0.909 | 3 | 5 | 0.600 | 0.705 | -0.52 | -0.11 |
| 1994 | sfo | 10 | 11 | 0.909 | 3 | 5 | 0.600 | 0.705 | -0.52 | -3.08 |
| 2008 | min | 4 | 5 | 0.800 | 6 | 11 | 0.545 | 0.594 | -0.53 | 0.48 |
| 1994 | nwe | 4 | 5 | 0.800 | 6 | 11 | 0.545 | 0.594 | -0.53 | -0.16 |
| 2014 | phi | 7 | 10 | 0.700 | 3 | 6 | 0.500 | 0.595 | -0.57 | 1.84 |
| 2012 | chi | 7 | 10 | 0.700 | 3 | 6 | 0.500 | 0.595 | -0.57 | 1.59 |
| 1992 | kan | 7 | 10 | 0.700 | 3 | 6 | 0.500 | 0.595 | -0.57 | 0.43 |
| 2000 | ram | 7 | 10 | 0.700 | 3 | 6 | 0.500 | 0.595 | -0.57 | -0.07 |
| 2004 | den | 7 | 10 | 0.700 | 3 | 6 | 0.500 | 0.595 | -0.57 | -0.14 |
| 1998 | dal | 7 | 10 | 0.700 | 3 | 6 | 0.500 | 0.595 | -0.57 | -3.38 |
| 2016 | cle | 0 | 10 | 0.000 | 1 | 6 | 0.167 | 0.262 | -0.57 | -1.57 |
| 2000 | sea | 3 | 8 | 0.375 | 3 | 8 | 0.375 | 0.447 | -0.58 | 2.42 |
| 1990 | det | 3 | 8 | 0.375 | 3 | 8 | 0.375 | 0.447 | -0.58 | 1.65 |
| 1993 | atl | 3 | 8 | 0.375 | 3 | 8 | 0.375 | 0.447 | -0.58 | 1.25 |
| 1994 | sea | 3 | 8 | 0.375 | 3 | 8 | 0.375 | 0.447 | -0.58 | 0.00 |
| 2011 | buf | 3 | 8 | 0.375 | 3 | 8 | 0.375 | 0.447 | -0.58 | -0.71 |
| 2010 | htx | 3 | 8 | 0.375 | 3 | 8 | 0.375 | 0.447 | -0.58 | -0.84 |
| 2004 | nyg | 3 | 8 | 0.375 | 3 | 8 | 0.375 | 0.447 | -0.58 | -0.86 |
| 2004 | crd | 3 | 8 | 0.375 | 3 | 8 | 0.375 | 0.447 | -0.58 | -0.98 |
| 2011 | cin | 4 | 6 | 0.667 | 5 | 10 | 0.500 | 0.559 | -0.59 | 0.58 |
| 2009 | htx | 4 | 6 | 0.667 | 5 | 10 | 0.500 | 0.559 | -0.59 | -0.58 |
| 1995 | atl | 4 | 6 | 0.667 | 5 | 10 | 0.500 | 0.559 | -0.59 | -0.74 |
| 2008 | chi | 4 | 6 | 0.667 | 5 | 10 | 0.500 | 0.559 | -0.59 | -1.00 |
| 1997 | mia | 4 | 6 | 0.667 | 5 | 10 | 0.500 | 0.559 | -0.59 | -1.38 |
| 1990 | sea | 4 | 6 | 0.667 | 5 | 10 | 0.500 | 0.559 | -0.59 | -1.75 |
| 2014 | mia | 6 | 11 | 0.545 | 2 | 5 | 0.400 | 0.523 | -0.61 | 0.57 |
| 2001 | den | 6 | 11 | 0.545 | 2 | 5 | 0.400 | 0.523 | -0.61 | -0.42 |
| 1997 | rai | 2 | 9 | 0.222 | 2 | 7 | 0.286 | 0.375 | -0.63 | 2.84 |
| 2010 | den | 2 | 9 | 0.222 | 2 | 7 | 0.286 | 0.375 | -0.63 | 2.53 |
| 1992 | nyj | 2 | 9 | 0.222 | 2 | 7 | 0.286 | 0.375 | -0.63 | -0.75 |
| 1992 | chi | 4 | 12 | 0.333 | 1 | 4 | 0.250 | 0.413 | -0.65 | -1.00 |
| 1997 | rav | 2 | 5 | 0.400 | 4.5 | 11 | 0.409 | 0.469 | -0.66 | 0.84 |
| 1991 | mia | 5 | 9 | 0.556 | 3 | 7 | 0.429 | 0.525 | -0.68 | 2.33 |
| 1998 | oti | 5 | 9 | 0.556 | 3 | 7 | 0.429 | 0.525 | -0.68 | 2.16 |
| 1998 | tam | 5 | 9 | 0.556 | 3 | 7 | 0.429 | 0.525 | -0.68 | 0.16 |
| 2005 | atl | 5 | 9 | 0.556 | 3 | 7 | 0.429 | 0.525 | -0.68 | -0.39 |
| 1996 | mia | 5 | 9 | 0.556 | 3 | 7 | 0.429 | 0.525 | -0.68 | -0.59 |
| 2007 | clt | 8 | 8 | 1.000 | 5 | 8 | 0.625 | 0.711 | -0.68 | 3.25 |
| 2000 | oti | 8 | 8 | 1.000 | 5 | 8 | 0.625 | 0.711 | -0.68 | 1.25 |
| 2013 | sea | 8 | 8 | 1.000 | 5 | 8 | 0.625 | 0.711 | -0.68 | -1.14 |
| 1997 | den | 10 | 12 | 0.833 | 2 | 4 | 0.500 | 0.674 | -0.70 | 0.86 |
| 2002 | tam | 10 | 12 | 0.833 | 2 | 4 | 0.500 | 0.674 | -0.70 | -3.25 |
| 2009 | tam | 2 | 11 | 0.182 | 1 | 5 | 0.200 | 0.341 | -0.70 | -0.25 |
| 2007 | ram | 2 | 11 | 0.182 | 1 | 5 | 0.200 | 0.341 | -0.70 | -0.86 |
| 2014 | atl | 4 | 10 | 0.400 | 2 | 6 | 0.333 | 0.452 | -0.71 | 0.84 |
| 2012 | buf | 4 | 10 | 0.400 | 2 | 6 | 0.333 | 0.452 | -0.71 | 0.84 |
| 1992 | ram | 4 | 10 | 0.400 | 2 | 6 | 0.333 | 0.452 | -0.71 | 0.52 |
| 1993 | sea | 4 | 10 | 0.400 | 2 | 6 | 0.333 | 0.452 | -0.71 | -0.58 |
| 1996 | sfo | 8 | 9 | 0.889 | 4 | 7 | 0.571 | 0.675 | -0.73 | 0.70 |
| 2015 | cin | 8 | 9 | 0.889 | 4 | 7 | 0.571 | 0.675 | -0.73 | -2.18 |
| 2015 | oti | 1 | 8 | 0.125 | 2 | 8 | 0.250 | 0.342 | -0.74 | 1.75 |
| 1996 | nor | 1 | 8 | 0.125 | 2 | 8 | 0.250 | 0.342 | -0.74 | 1.38 |
| 1996 | atl | 1 | 8 | 0.125 | 2 | 8 | 0.250 | 0.342 | -0.74 | 1.25 |
| 2013 | was | 1 | 8 | 0.125 | 2 | 8 | 0.250 | 0.342 | -0.74 | 1.14 |
| 1991 | cin | 1 | 8 | 0.125 | 2 | 8 | 0.250 | 0.342 | -0.74 | -0.43 |
| 1991 | oti | 6 | 7 | 0.857 | 5 | 9 | 0.556 | 0.639 | -0.75 | -1.75 |
| 2011 | dal | 4 | 7 | 0.571 | 4 | 9 | 0.444 | 0.528 | -0.75 | 1.80 |
| 1999 | nyj | 4 | 7 | 0.571 | 4 | 9 | 0.444 | 0.528 | -0.75 | 1.00 |
| 1993 | nyj | 4 | 7 | 0.571 | 4 | 9 | 0.444 | 0.528 | -0.75 | 0.57 |
| 1995 | nyg | 2 | 7 | 0.286 | 3 | 9 | 0.333 | 0.417 | -0.75 | 0.35 |
| 1999 | rav | 4 | 7 | 0.571 | 4 | 9 | 0.444 | 0.528 | -0.75 | 0.14 |
| 1993 | sdg | 4 | 7 | 0.571 | 4 | 9 | 0.444 | 0.528 | -0.75 | -1.26 |
| 1995 | clt | 3 | 4 | 0.750 | 6 | 12 | 0.500 | 0.567 | -0.80 | 2.59 |
| 2001 | tam | 3 | 4 | 0.750 | 6 | 12 | 0.500 | 0.567 | -0.80 | -0.70 |
| 2007 | nyj | 1 | 6 | 0.167 | 3 | 10 | 0.300 | 0.382 | -0.82 | 1.00 |
| 2013 | atl | 1 | 6 | 0.167 | 3 | 10 | 0.300 | 0.382 | -0.82 | -0.71 |
| 2001 | clt | 5 | 12 | 0.417 | 1 | 4 | 0.250 | 0.457 | -0.83 | 2.68 |
| 2000 | sfo | 5 | 12 | 0.417 | 1 | 4 | 0.250 | 0.457 | -0.83 | -0.26 |
| 2016 | den | 7 | 11 | 0.636 | 2 | 5 | 0.400 | 0.568 | -0.84 | 0.07 |
| 1997 | det | 7 | 11 | 0.636 | 2 | 5 | 0.400 | 0.568 | -0.84 | -0.16 |
| 2002 | mia | 7 | 11 | 0.636 | 2 | 5 | 0.400 | 0.568 | -0.84 | -1.38 |
| 1996 | phi | 6 | 8 | 0.750 | 4 | 8 | 0.500 | 0.605 | -0.84 | 2.25 |
| 2011 | htx | 6 | 8 | 0.750 | 4 | 8 | 0.500 | 0.605 | -0.84 | 2.16 |
| 2015 | pit | 6 | 8 | 0.750 | 4 | 8 | 0.500 | 0.605 | -0.84 | 0.43 |
| 2004 | nyj | 6 | 8 | 0.750 | 4 | 8 | 0.500 | 0.605 | -0.84 | -0.14 |
| 2007 | sea | 6 | 8 | 0.750 | 4 | 8 | 0.500 | 0.605 | -0.84 | -1.43 |
| 2007 | crd | 3 | 5 | 0.600 | 5 | 11 | 0.455 | 0.531 | -0.84 | 0.39 |
| 1991 | nyj | 3 | 5 | 0.600 | 5 | 11 | 0.455 | 0.531 | -0.84 | -0.63 |
| 2012 | pit | 3 | 5 | 0.600 | 5 | 11 | 0.455 | 0.531 | -0.84 | -2.03 |
| 2011 | clt | 1 | 10 | 0.100 | 1 | 6 | 0.167 | 0.310 | -0.86 | 4.59 |
| 2011 | ram | 1 | 10 | 0.100 | 1 | 6 | 0.167 | 0.310 | -0.86 | 0.92 |
| 2008 | ram | 1 | 10 | 0.100 | 1 | 6 | 0.167 | 0.310 | -0.86 | -0.25 |
| 1992 | nwe | 1 | 10 | 0.100 | 1 | 6 | 0.167 | 0.310 | -0.86 | -1.20 |
| 2016 | sfo | 1 | 10 | 0.100 | 1 | 6 | 0.167 | 0.310 | -0.86 | -1.33 |
| 2005 | nyg | 8 | 10 | 0.800 | 3 | 6 | 0.500 | 0.643 | -0.86 | 0.00 |
| 1995 | gnb | 8 | 10 | 0.800 | 3 | 6 | 0.500 | 0.643 | -0.86 | -0.06 |
| 2012 | gnb | 8 | 10 | 0.800 | 3 | 6 | 0.500 | 0.643 | -0.86 | -0.25 |
| 2013 | kan | 8 | 10 | 0.800 | 3 | 6 | 0.500 | 0.643 | -0.86 | -1.03 |
| 2009 | gnb | 8 | 10 | 0.800 | 3 | 6 | 0.500 | 0.643 | -0.86 | -2.76 |
| 1992 | nyg | 6 | 14 | 0.429 | 0 | 2 | 0.000 | 0.460 | -0.92 | -0.38 |
| 1997 | was | 5 | 8 | 0.625 | 3.5 | 8 | 0.438 | 0.553 | -0.92 | 0.84 |
| 2007 | mia | 0 | 9 | 0.000 | 1 | 7 | 0.143 | 0.275 | -0.93 | 2.25 |
| 2000 | sdg | 0 | 9 | 0.000 | 1 | 7 | 0.143 | 0.275 | -0.93 | -3.75 |
| 2005 | oti | 3 | 11 | 0.273 | 1 | 5 | 0.200 | 0.386 | -0.93 | 2.53 |
| 1997 | sdg | 3 | 11 | 0.273 | 1 | 5 | 0.200 | 0.386 | -0.93 | 1.22 |
| 2004 | cle | 3 | 11 | 0.273 | 1 | 5 | 0.200 | 0.386 | -0.93 | 0.25 |
| 1991 | crd | 3 | 11 | 0.273 | 1 | 5 | 0.200 | 0.386 | -0.93 | -1.16 |
| 2017 | htx | 3 | 11 | 0.273 | 1 | 5 | 0.200 | 0.386 | -0.93 | -1.22 |
| 2008 | det | 0 | 12 | 0.000 | 0 | 4 | 0.000 | 0.239 | -0.96 | 1.04 |
| 2005 | crd | 3 | 9 | 0.333 | 2 | 7 | 0.286 | 0.425 | -0.98 | 0.75 |
| 2000 | dal | 3 | 9 | 0.333 | 2 | 7 | 0.286 | 0.425 | -0.98 | -0.47 |
| 2017 | chi | 3 | 9 | 0.333 | 2 | 7 | 0.286 | 0.425 | -0.98 | -0.76 |
| 1996 | det | 3 | 9 | 0.333 | 2 | 7 | 0.286 | 0.425 | -0.98 | -0.84 |
| 1997 | ram | 3 | 9 | 0.333 | 2 | 7 | 0.286 | 0.425 | -0.98 | -1.98 |
| 2005 | det | 3 | 9 | 0.333 | 2 | 7 | 0.286 | 0.425 | -0.98 | -2.75 |
| 1993 | chi | 3 | 6 | 0.500 | 4 | 10 | 0.400 | 0.500 | -1.00 | 0.39 |
| 2016 | nor | 2 | 4 | 0.500 | 5 | 12 | 0.417 | 0.500 | -1.00 | -1.70 |
| 1994 | buf | 5 | 10 | 0.500 | 2 | 6 | 0.333 | 0.500 | -1.00 | 4.03 |
| 1994 | phi | 4 | 8 | 0.500 | 3 | 8 | 0.375 | 0.500 | -1.00 | 2.00 |
| 2012 | mia | 4 | 8 | 0.500 | 3 | 8 | 0.375 | 0.500 | -1.00 | 1.59 |
| 2006 | buf | 4 | 8 | 0.500 | 3 | 8 | 0.375 | 0.500 | -1.00 | 1.57 |
| 2002 | ram | 4 | 8 | 0.500 | 3 | 8 | 0.375 | 0.500 | -1.00 | 1.43 |
| 2009 | chi | 4 | 8 | 0.500 | 3 | 8 | 0.375 | 0.500 | -1.00 | 1.41 |
| 2014 | nor | 4 | 8 | 0.500 | 3 | 8 | 0.375 | 0.500 | -1.00 | 1.25 |
| 1996 | chi | 4 | 8 | 0.500 | 3 | 8 | 0.375 | 0.500 | -1.00 | 0.73 |
| 2013 | ram | 6 | 12 | 0.500 | 1 | 4 | 0.250 | 0.500 | -1.00 | 0.02 |
| 1993 | cle | 4 | 8 | 0.500 | 3 | 8 | 0.375 | 0.500 | -1.00 | -0.38 |
| 1998 | kan | 4 | 8 | 0.500 | 3 | 8 | 0.375 | 0.500 | -1.00 | -0.42 |
| 1995 | nor | 4 | 8 | 0.500 | 3 | 8 | 0.375 | 0.500 | -1.00 | -0.74 |
| 2010 | ram | 5 | 10 | 0.500 | 2 | 6 | 0.333 | 0.500 | -1.00 | -0.86 |
| 2004 | htx | 6 | 12 | 0.500 | 1 | 4 | 0.250 | 0.500 | -1.00 | -1.28 |
| 2001 | cle | 5 | 10 | 0.500 | 2 | 6 | 0.333 | 0.500 | -1.00 | -1.53 |
| 2017 | sdg | 6 | 9 | 0.667 | 3 | 7 | 0.429 | 0.575 | -1.03 | 1.43 |
| 2012 | nyg | 6 | 9 | 0.667 | 3 | 7 | 0.429 | 0.575 | -1.03 | 0.29 |
| 2014 | buf | 6 | 9 | 0.667 | 3 | 7 | 0.429 | 0.575 | -1.03 | 0.00 |
| 2002 | nyj | 6 | 9 | 0.667 | 3 | 7 | 0.429 | 0.575 | -1.03 | -0.20 |
| 2014 | kan | 6 | 9 | 0.667 | 3 | 7 | 0.429 | 0.575 | -1.03 | -0.38 |
| 1995 | mia | 6 | 9 | 0.667 | 3 | 7 | 0.429 | 0.575 | -1.03 | -0.68 |
| 2017 | det | 6 | 9 | 0.667 | 3 | 7 | 0.429 | 0.575 | -1.03 | -1.39 |
| 2015 | gnb | 8 | 11 | 0.727 | 2 | 5 | 0.400 | 0.614 | -1.07 | 0.58 |
| 2017 | jax | 8 | 11 | 0.727 | 2 | 5 | 0.400 | 0.614 | -1.07 | -1.58 |
| 2001 | gnb | 9 | 10 | 0.900 | 3 | 6 | 0.500 | 0.690 | -1.14 | 2.16 |
| 2002 | phi | 9 | 10 | 0.900 | 3 | 6 | 0.500 | 0.690 | -1.14 | 1.16 |
| 2014 | sea | 9 | 10 | 0.900 | 3 | 6 | 0.500 | 0.690 | -1.14 | -2.73 |
| 1999 | nor | 2 | 10 | 0.200 | 1 | 6 | 0.167 | 0.357 | -1.14 | 0.71 |
| 2015 | cle | 2 | 10 | 0.200 | 1 | 6 | 0.167 | 0.357 | -1.14 | -0.57 |
| 2017 | nyg | 2 | 10 | 0.200 | 1 | 6 | 0.167 | 0.357 | -1.14 | -1.20 |
| 2004 | was | 2 | 5 | 0.400 | 4 | 11 | 0.364 | 0.469 | -1.16 | -1.18 |
| 2002 | min | 2 | 5 | 0.400 | 4 | 11 | 0.364 | 0.469 | -1.16 | -1.35 |
| 1991 | cle | 2 | 5 | 0.400 | 4 | 11 | 0.364 | 0.469 | -1.16 | -1.61 |
| 1991 | gnb | 2 | 8 | 0.250 | 2 | 8 | 0.250 | 0.395 | -1.16 | 1.61 |
| 2015 | dal | 2 | 8 | 0.250 | 2 | 8 | 0.250 | 0.395 | -1.16 | 1.25 |
| 2009 | kan | 2 | 8 | 0.250 | 2 | 8 | 0.250 | 0.395 | -1.16 | 0.71 |
| 2007 | rai | 2 | 8 | 0.250 | 2 | 8 | 0.250 | 0.395 | -1.16 | 0.07 |
| 1992 | crd | 2 | 8 | 0.250 | 2 | 8 | 0.250 | 0.395 | -1.16 | -4.18 |
| 2005 | buf | 4 | 11 | 0.364 | 1 | 5 | 0.200 | 0.432 | -1.16 | -1.00 |
| 2003 | det | 4 | 11 | 0.364 | 1 | 5 | 0.200 | 0.432 | -1.16 | -1.25 |
| 1998 | buf | 5 | 6 | 0.833 | 5 | 10 | 0.500 | 0.618 | -1.18 | 0.43 |
| 2005 | was | 5 | 6 | 0.833 | 5 | 10 | 0.500 | 0.618 | -1.18 | 0.18 |
| 2012 | den | 12 | 13 | 0.923 | 1 | 3 | 0.333 | 0.729 | -1.19 | -1.75 |
| 1993 | nwe | 1 | 4 | 0.250 | 4 | 12 | 0.333 | 0.433 | -1.20 | -0.53 |
| 2001 | det | 0 | 6 | 0.000 | 2 | 10 | 0.200 | 0.324 | -1.24 | -0.24 |
| 1998 | clt | 1 | 7 | 0.143 | 2 | 9 | 0.222 | 0.361 | -1.25 | 0.74 |
| 1997 | dal | 3 | 7 | 0.429 | 3 | 9 | 0.333 | 0.472 | -1.25 | -0.57 |
| 2004 | det | 3 | 7 | 0.429 | 3 | 9 | 0.333 | 0.472 | -1.25 | -0.98 |
| 2006 | min | 3 | 7 | 0.429 | 3 | 9 | 0.333 | 0.472 | -1.25 | -1.42 |
| 2001 | jax | 3 | 7 | 0.429 | 3 | 9 | 0.333 | 0.472 | -1.25 | -2.84 |
| 2013 | sdg | 5 | 7 | 0.714 | 4 | 9 | 0.444 | 0.583 | -1.25 | 1.68 |
| 2008 | tam | 5 | 7 | 0.714 | 4 | 9 | 0.444 | 0.583 | -1.25 | -0.70 |
| 2017 | sea | 5 | 7 | 0.714 | 4 | 9 | 0.444 | 0.583 | -1.25 | -1.18 |
| 1994 | sdg | 7 | 8 | 0.875 | 4 | 8 | 0.500 | 0.658 | -1.26 | 1.68 |
| 1992 | phi | 7 | 8 | 0.875 | 4 | 8 | 0.500 | 0.658 | -1.26 | 1.59 |
| 1997 | jax | 7 | 8 | 0.875 | 4 | 8 | 0.500 | 0.658 | -1.26 | 0.98 |
| 2016 | atl | 7 | 8 | 0.875 | 4 | 8 | 0.500 | 0.658 | -1.26 | 0.41 |
| 2009 | dal | 7 | 8 | 0.875 | 4 | 8 | 0.500 | 0.658 | -1.26 | -2.84 |
| 2005 | htx | 1 | 9 | 0.111 | 1 | 7 | 0.143 | 0.325 | -1.28 | 0.02 |
| 2010 | rai | 6 | 10 | 0.600 | 2 | 6 | 0.333 | 0.548 | -1.29 | 3.75 |
| 2016 | min | 6 | 10 | 0.600 | 2 | 6 | 0.333 | 0.548 | -1.29 | -0.52 |
| 1997 | oti | 6 | 10 | 0.600 | 2 | 6 | 0.333 | 0.548 | -1.29 | -0.68 |
| 1995 | rai | 6 | 10 | 0.600 | 2 | 6 | 0.333 | 0.548 | -1.29 | -4.75 |
| 2002 | rai | 9 | 11 | 0.818 | 2 | 5 | 0.400 | 0.659 | -1.30 | -1.75 |
| 2003 | pit | 4 | 9 | 0.444 | 2 | 7 | 0.286 | 0.475 | -1.33 | 1.86 |
| 2017 | sfo | 4 | 9 | 0.444 | 2 | 7 | 0.286 | 0.475 | -1.33 | 0.26 |
| 2009 | buf | 4 | 9 | 0.444 | 2 | 7 | 0.286 | 0.475 | -1.33 | 0.26 |
| 1996 | tam | 4 | 9 | 0.444 | 2 | 7 | 0.286 | 0.475 | -1.33 | -0.02 |
| 2011 | mia | 4 | 9 | 0.444 | 2 | 7 | 0.286 | 0.475 | -1.33 | -1.00 |
| 1999 | pit | 4 | 9 | 0.444 | 2 | 7 | 0.286 | 0.475 | -1.33 | -1.57 |
| 2003 | min | 8 | 12 | 0.667 | 1 | 4 | 0.250 | 0.587 | -1.35 | 0.00 |
| 1998 | mia | 7 | 9 | 0.778 | 3 | 7 | 0.429 | 0.625 | -1.38 | 1.75 |
| 2003 | mia | 7 | 9 | 0.778 | 3 | 7 | 0.429 | 0.625 | -1.38 | -0.25 |
| 2000 | clt | 7 | 9 | 0.778 | 3 | 7 | 0.429 | 0.625 | -1.38 | -0.83 |
| 2006 | phi | 7 | 9 | 0.778 | 3 | 7 | 0.429 | 0.625 | -1.38 | -1.42 |
| 2010 | sfo | 5 | 11 | 0.455 | 1 | 5 | 0.200 | 0.477 | -1.39 | 0.74 |
| 2010 | oti | 5 | 11 | 0.455 | 1 | 5 | 0.200 | 0.477 | -1.39 | 0.25 |
| 2003 | buf | 5 | 11 | 0.455 | 1 | 5 | 0.200 | 0.477 | -1.39 | -1.57 |
| 2010 | cle | 2 | 6 | 0.333 | 3 | 10 | 0.300 | 0.441 | -1.41 | -0.25 |
| 2000 | nwe | 2 | 6 | 0.333 | 3 | 10 | 0.300 | 0.441 | -1.41 | -0.38 |
| 2017 | tam | 2 | 6 | 0.333 | 3 | 10 | 0.300 | 0.441 | -1.41 | -0.75 |
| 1995 | min | 5 | 8 | 0.625 | 3 | 8 | 0.375 | 0.553 | -1.42 | 1.75 |
| 1998 | sea | 5 | 8 | 0.625 | 3 | 8 | 0.375 | 0.553 | -1.42 | -0.29 |
| 2007 | min | 5 | 8 | 0.625 | 3 | 8 | 0.375 | 0.553 | -1.42 | -0.53 |
| 1996 | oti | 5 | 8 | 0.625 | 3 | 8 | 0.375 | 0.553 | -1.42 | -1.29 |
| 2011 | sdg | 5 | 8 | 0.625 | 3 | 8 | 0.375 | 0.553 | -1.42 | -2.29 |
| 2007 | phi | 5 | 8 | 0.625 | 3 | 8 | 0.375 | 0.553 | -1.42 | -3.23 |
| 2008 | sea | 3 | 10 | 0.300 | 1 | 6 | 0.167 | 0.405 | -1.43 | -0.19 |
| 2014 | nyg | 6 | 13 | 0.462 | 0 | 3 | 0.000 | 0.479 | -1.44 | -2.84 |
| 2012 | det | 1 | 5 | 0.200 | 3 | 11 | 0.273 | 0.406 | -1.47 | -1.75 |
| 2015 | sdg | 1 | 5 | 0.200 | 3 | 11 | 0.273 | 0.406 | -1.47 | -3.75 |
| 1995 | dal | 10 | 11 | 0.909 | 2 | 5 | 0.400 | 0.705 | -1.52 | 1.33 |
| 1995 | chi | 4 | 5 | 0.800 | 5 | 11 | 0.455 | 0.594 | -1.53 | -1.00 |
| 2002 | cle | 4 | 5 | 0.800 | 5 | 11 | 0.455 | 0.594 | -1.53 | -2.25 |
| 2000 | pit | 7 | 10 | 0.700 | 2 | 6 | 0.333 | 0.595 | -1.57 | 0.28 |
| 2017 | cle | 0 | 10 | 0.000 | 0 | 6 | 0.000 | 0.262 | -1.57 | 0.25 |
| 2014 | htx | 7 | 10 | 0.700 | 2 | 6 | 0.333 | 0.595 | -1.57 | -0.29 |
| 2004 | buf | 7 | 10 | 0.700 | 2 | 6 | 0.333 | 0.595 | -1.57 | -1.16 |
| 2010 | sdg | 7 | 10 | 0.700 | 2 | 6 | 0.333 | 0.595 | -1.57 | -1.42 |
| 2017 | rav | 7 | 10 | 0.700 | 2 | 6 | 0.333 | 0.595 | -1.57 | -1.86 |
| 2000 | was | 4 | 6 | 0.667 | 4 | 10 | 0.400 | 0.559 | -1.59 | 0.00 |
| 1997 | sea | 4 | 6 | 0.667 | 4 | 10 | 0.400 | 0.559 | -1.59 | -1.42 |
| 1999 | min | 4 | 4 | 1.000 | 6 | 12 | 0.500 | 0.633 | -1.60 | 1.58 |
| 1992 | cle | 6 | 11 | 0.545 | 1 | 5 | 0.200 | 0.523 | -1.61 | -1.00 |
| 1991 | tam | 2 | 9 | 0.222 | 1 | 7 | 0.143 | 0.375 | -1.63 | -0.16 |
| 2016 | chi | 2 | 9 | 0.222 | 1 | 7 | 0.143 | 0.375 | -1.63 | -0.98 |
| 2000 | jax | 5 | 9 | 0.556 | 2 | 7 | 0.286 | 0.525 | -1.68 | -1.25 |
| 2011 | sea | 5 | 9 | 0.556 | 2 | 7 | 0.286 | 0.525 | -1.68 | -1.76 |
| 1992 | nor | 8 | 8 | 1.000 | 4 | 8 | 0.500 | 0.711 | -1.68 | 1.42 |
| 2012 | nwe | 8 | 8 | 1.000 | 4 | 8 | 0.500 | 0.711 | -1.68 | -0.22 |
| 2017 | nor | 10 | 12 | 0.833 | 1 | 4 | 0.250 | 0.674 | -1.70 | 1.14 |
| 2008 | rav | 10 | 12 | 0.833 | 1 | 4 | 0.250 | 0.674 | -1.70 | -2.38 |
| 2000 | mia | 8 | 9 | 0.889 | 3 | 7 | 0.429 | 0.675 | -1.73 | 0.98 |
| 2008 | kan | 1 | 8 | 0.125 | 1 | 8 | 0.125 | 0.342 | -1.74 | -1.16 |
| 1994 | oti | 1 | 8 | 0.125 | 1 | 8 | 0.125 | 0.342 | -1.74 | -3.84 |
| 1992 | oti | 6 | 7 | 0.857 | 4 | 9 | 0.444 | 0.639 | -1.75 | 0.48 |
| 2015 | nyj | 6 | 7 | 0.857 | 4 | 9 | 0.444 | 0.639 | -1.75 | 0.38 |
| 2000 | tam | 6 | 7 | 0.857 | 4 | 9 | 0.444 | 0.639 | -1.75 | -0.80 |
| 2013 | den | 11 | 11 | 1.000 | 2 | 5 | 0.400 | 0.750 | -1.75 | 0.93 |
| 2013 | det | 4 | 7 | 0.571 | 3 | 9 | 0.333 | 0.528 | -1.75 | 2.33 |
| 2009 | was | 2 | 7 | 0.286 | 2 | 9 | 0.222 | 0.417 | -1.75 | 1.60 |
| 2004 | kan | 4 | 7 | 0.571 | 3 | 9 | 0.333 | 0.528 | -1.75 | 0.71 |
| 1991 | sea | 4 | 7 | 0.571 | 3 | 9 | 0.333 | 0.528 | -1.75 | 0.43 |
| 2003 | rai | 2 | 7 | 0.286 | 2 | 9 | 0.222 | 0.417 | -1.75 | 0.18 |
| 2012 | tam | 4 | 7 | 0.571 | 3 | 9 | 0.333 | 0.528 | -1.75 | -0.14 |
| 2010 | cin | 2 | 7 | 0.286 | 2 | 9 | 0.222 | 0.417 | -1.75 | -0.59 |
| 1993 | was | 2 | 7 | 0.286 | 2 | 9 | 0.222 | 0.417 | -1.75 | -2.75 |
| 2012 | sea | 6 | 6 | 1.000 | 5 | 10 | 0.500 | 0.676 | -1.76 | -0.68 |
| 2013 | htx | 0 | 5 | 0.000 | 2 | 11 | 0.182 | 0.344 | -1.78 | -1.57 |
| 2016 | jax | 1 | 6 | 0.167 | 2 | 10 | 0.200 | 0.382 | -1.82 | -1.07 |
| 2014 | chi | 5 | 12 | 0.417 | 0 | 4 | 0.000 | 0.457 | -1.83 | 0.53 |
| 2007 | was | 6 | 8 | 0.750 | 3 | 8 | 0.375 | 0.605 | -1.84 | 2.53 |
| 2009 | nyj | 6 | 8 | 0.750 | 3 | 8 | 0.375 | 0.605 | -1.84 | 0.16 |
| 2003 | gnb | 8 | 10 | 0.800 | 2 | 6 | 0.333 | 0.643 | -1.86 | 0.71 |
| 2014 | rav | 8 | 10 | 0.800 | 2 | 6 | 0.333 | 0.643 | -1.86 | 0.60 |
| 2016 | crd | 5 | 8 | 0.625 | 2.5 | 8 | 0.313 | 0.553 | -1.92 | 2.84 |
| 1998 | ram | 3 | 9 | 0.333 | 1 | 7 | 0.143 | 0.425 | -1.98 | -2.31 |
| 2016 | car | 4 | 8 | 0.500 | 2 | 8 | 0.250 | 0.500 | -2.00 | 3.00 |
| 1999 | den | 3 | 6 | 0.500 | 3 | 10 | 0.300 | 0.500 | -2.00 | 0.98 |
| 1990 | min | 4 | 8 | 0.500 | 2 | 8 | 0.250 | 0.500 | -2.00 | 0.00 |
| 2011 | car | 5 | 10 | 0.500 | 1 | 6 | 0.167 | 0.500 | -2.00 | -3.84 |
| 2011 | phi | 6 | 9 | 0.667 | 2 | 7 | 0.286 | 0.575 | -2.03 | 1.68 |
| 2006 | cin | 6 | 9 | 0.667 | 2 | 7 | 0.286 | 0.575 | -2.03 | -0.33 |
| 2013 | pit | 6 | 9 | 0.667 | 2 | 7 | 0.286 | 0.575 | -2.03 | -0.38 |
| 1990 | oti | 8 | 11 | 0.727 | 1 | 5 | 0.200 | 0.614 | -2.07 | -0.75 |
| 1994 | dal | 9 | 9 | 1.000 | 3 | 7 | 0.429 | 0.725 | -2.08 | -1.52 |
| 2005 | pit | 9 | 10 | 0.900 | 2 | 6 | 0.333 | 0.690 | -2.14 | 0.61 |
| 1997 | clt | 2 | 8 | 0.250 | 1 | 8 | 0.125 | 0.395 | -2.16 | -1.25 |
| 2016 | cin | 5 | 9 | 0.556 | 1.5 | 7 | 0.214 | 0.525 | -2.18 | 0.42 |
| 2002 | nor | 5 | 6 | 0.833 | 4 | 10 | 0.400 | 0.618 | -2.18 | 0.75 |
| 2001 | rai | 5 | 5 | 1.000 | 5 | 11 | 0.455 | 0.656 | -2.22 | -1.30 |
| 2014 | tam | 1 | 7 | 0.143 | 1 | 9 | 0.111 | 0.361 | -2.25 | 2.26 |
| 1990 | den | 3 | 7 | 0.429 | 2 | 9 | 0.222 | 0.472 | -2.25 | 1.47 |
| 1990 | atl | 3 | 7 | 0.429 | 2 | 9 | 0.222 | 0.472 | -2.25 | 1.25 |
| 2003 | cle | 3 | 7 | 0.429 | 2 | 9 | 0.222 | 0.472 | -2.25 | -0.93 |
| 2008 | nor | 5 | 7 | 0.714 | 3 | 9 | 0.333 | 0.583 | -2.25 | -0.52 |
| 2009 | nwe | 7 | 8 | 0.875 | 3 | 8 | 0.375 | 0.658 | -2.26 | 1.30 |
| 1996 | nyj | 1 | 9 | 0.111 | 0 | 7 | 0.000 | 0.325 | -2.28 | 0.25 |
| 2004 | car | 6 | 10 | 0.600 | 1 | 6 | 0.167 | 0.548 | -2.29 | -0.38 |
| 2012 | sdg | 6 | 10 | 0.600 | 1 | 6 | 0.167 | 0.548 | -2.29 | -1.25 |
| 2000 | car | 6 | 10 | 0.600 | 1 | 6 | 0.167 | 0.548 | -2.29 | -2.74 |
| 1993 | sfo | 9 | 11 | 0.818 | 1 | 5 | 0.200 | 0.659 | -2.30 | -0.52 |
| 1999 | ram | 13 | 13 | 1.000 | 0 | 3 | 0.000 | 0.771 | -2.31 | -0.57 |
| 1992 | det | 4 | 9 | 0.444 | 1 | 7 | 0.143 | 0.475 | -2.33 | 2.68 |
| 1990 | ram | 4 | 9 | 0.444 | 1 | 7 | 0.143 | 0.475 | -2.33 | 1.08 |
| 2009 | rav | 7 | 9 | 0.778 | 2 | 7 | 0.286 | 0.625 | -2.38 | 0.40 |
| 2005 | sdg | 7 | 9 | 0.778 | 2 | 7 | 0.286 | 0.625 | -2.38 | -0.07 |
| 1991 | sdg | 2 | 6 | 0.333 | 2 | 10 | 0.200 | 0.441 | -2.41 | 0.65 |
| 2005 | gnb | 2 | 6 | 0.333 | 2 | 10 | 0.200 | 0.441 | -2.41 | 0.61 |
| 2016 | buf | 5 | 8 | 0.625 | 2 | 8 | 0.250 | 0.553 | -2.42 | 1.68 |
| 2003 | sfo | 5 | 8 | 0.625 | 2 | 8 | 0.250 | 0.553 | -2.42 | 0.75 |
| 2011 | min | 1 | 5 | 0.200 | 2 | 11 | 0.182 | 0.406 | -2.47 | 2.00 |
| 2002 | kan | 4 | 5 | 0.800 | 4 | 11 | 0.364 | 0.594 | -2.53 | 1.63 |
| 1990 | sdg | 6 | 11 | 0.545 | 0 | 5 | 0.000 | 0.523 | -2.61 | -2.41 |
| 2007 | pit | 8 | 9 | 0.889 | 2 | 7 | 0.286 | 0.675 | -2.73 | 1.16 |
| 2015 | sea | 8 | 9 | 0.889 | 2 | 7 | 0.286 | 0.675 | -2.73 | 0.25 |
| 2017 | kan | 8 | 9 | 0.889 | 2 | 7 | 0.286 | 0.675 | -2.73 | -1.25 |
| 2001 | car | 1 | 8 | 0.125 | 0 | 8 | 0.000 | 0.342 | -2.74 | 0.42 |
| 2006 | det | 2 | 7 | 0.286 | 1 | 9 | 0.111 | 0.417 | -2.75 | 0.84 |
| 1994 | was | 2 | 7 | 0.286 | 1 | 9 | 0.111 | 0.417 | -2.75 | -0.41 |
| 1990 | phi | 6 | 6 | 1.000 | 4 | 10 | 0.400 | 0.676 | -2.76 | 1.33 |
| 2010 | gnb | 6 | 6 | 1.000 | 4 | 10 | 0.400 | 0.676 | -2.76 | 0.57 |
| 2009 | sfo | 6 | 8 | 0.750 | 2 | 8 | 0.250 | 0.605 | -2.84 | -1.39 |
| 2015 | nyg | 3 | 5 | 0.600 | 3 | 11 | 0.273 | 0.531 | -2.84 | 2.16 |
| 2002 | jax | 3 | 5 | 0.600 | 3 | 11 | 0.273 | 0.531 | -2.84 | 0.18 |
| 2010 | dal | 3 | 5 | 0.600 | 3 | 11 | 0.273 | 0.531 | -2.84 | -0.75 |
| 1999 | rai | 3 | 3 | 1.000 | 5 | 13 | 0.385 | 0.607 | -2.89 | -0.26 |
| 2004 | tam | 3 | 6 | 0.500 | 2 | 10 | 0.200 | 0.500 | -3.00 | 0.75 |
| 2016 | phi | 6 | 9 | 0.667 | 1 | 7 | 0.143 | 0.575 | -3.03 | -0.14 |
| 1995 | sfo | 9 | 9 | 1.000 | 2 | 7 | 0.286 | 0.725 | -3.08 | -0.73 |
| 1998 | car | 2 | 5 | 0.400 | 2 | 11 | 0.182 | 0.469 | -3.16 | 0.00 |
| 2009 | pit | 5 | 5 | 1.000 | 4 | 11 | 0.364 | 0.656 | -3.22 | 0.63 |
| 2008 | phi | 8 | 9 | 0.889 | 1.5 | 7 | 0.214 | 0.675 | -3.23 | 0.43 |
| 2003 | tam | 5 | 7 | 0.714 | 2 | 9 | 0.222 | 0.583 | -3.25 | -3.00 |
| 1993 | den | 7 | 8 | 0.875 | 2 | 8 | 0.250 | 0.658 | -3.26 | 0.80 |
| 1999 | dal | 7 | 9 | 0.778 | 1 | 7 | 0.143 | 0.625 | -3.38 | -0.98 |
| 2008 | gnb | 5 | 8 | 0.625 | 1 | 8 | 0.125 | 0.553 | -3.42 | -0.86 |
| 1991 | sfo | 8 | 8 | 1.000 | 2 | 8 | 0.250 | 0.711 | -3.68 | 1.28 |
| 2008 | sdg | 6 | 7 | 0.857 | 2 | 9 | 0.222 | 0.639 | -3.75 | 1.63 |
| 2006 | jax | 6 | 7 | 0.857 | 2 | 9 | 0.222 | 0.639 | -3.75 | 0.43 |
| 2001 | sdg | 4 | 7 | 0.571 | 1 | 9 | 0.111 | 0.528 | -3.75 | 0.75 |
| 2016 | sdg | 4 | 7 | 0.571 | 1 | 9 | 0.111 | 0.528 | -3.75 | -1.03 |
| 2012 | car | 6 | 8 | 0.750 | 1 | 8 | 0.125 | 0.605 | -3.84 | 0.63 |
| 1995 | oti | 6 | 8 | 0.750 | 1 | 8 | 0.125 | 0.605 | -3.84 | -1.42 |
| 1993 | crd | 5 | 6 | 0.833 | 2 | 10 | 0.200 | 0.618 | -4.18 | 0.00 |
| 1996 | rai | 6 | 7 | 0.857 | 1 | 9 | 0.111 | 0.639 | -4.75 | -0.63 |
Finally, here is the 2018 data: The Cowboys had 2 non-close wins last year in 6 games, for a 0.333 winning percentage in non-close games. But in close games, Dallas won 8 out of 10 games, a 0.800 winning percentage. We would have expected Dallas to win about 44.1% of their non-close games, so by going 8-2, Dallas finished 3.59 wins above expectation, most in the league last year.
| Year | Team | NCG Wins | NCG | NCG W% | CG Wins | CG | CG W% | Exp CG W% | Diff |
|---|---|---|---|---|---|---|---|---|---|
| 2018 | dal | 2 | 6 | 0.333 | 8 | 10 | 0.800 | 0.441 | 3.59 |
| 2018 | mia | 2 | 10 | 0.200 | 5 | 6 | 0.833 | 0.357 | 2.86 |
| 2018 | was | 3 | 11 | 0.273 | 4 | 5 | 0.800 | 0.386 | 2.07 |
| 2018 | ram | 7 | 9 | 0.778 | 6 | 7 | 0.857 | 0.625 | 1.63 |
| 2018 | rai | 1 | 11 | 0.091 | 3 | 5 | 0.600 | 0.295 | 1.52 |
| 2018 | sdg | 7 | 10 | 0.700 | 5 | 6 | 0.833 | 0.595 | 1.43 |
| 2018 | nor | 8 | 10 | 0.800 | 5 | 6 | 0.833 | 0.643 | 1.14 |
| 2018 | buf | 3 | 10 | 0.300 | 3 | 6 | 0.500 | 0.405 | 0.57 |
| 2018 | atl | 3 | 8 | 0.375 | 4 | 8 | 0.500 | 0.447 | 0.42 |
| 2018 | oti | 5 | 9 | 0.556 | 4 | 7 | 0.571 | 0.525 | 0.33 |
| 2018 | sfo | 1 | 8 | 0.125 | 3 | 8 | 0.375 | 0.342 | 0.26 |
| 2018 | cle | 3 | 7 | 0.429 | 4.5 | 9 | 0.500 | 0.472 | 0.25 |
| 2018 | crd | 1 | 10 | 0.100 | 2 | 6 | 0.333 | 0.310 | 0.14 |
| 2018 | clt | 6 | 9 | 0.667 | 4 | 7 | 0.571 | 0.575 | -0.02 |
| 2018 | nwe | 8 | 11 | 0.727 | 3 | 5 | 0.600 | 0.614 | -0.07 |
| 2018 | min | 6 | 11 | 0.545 | 2.5 | 5 | 0.500 | 0.523 | -0.11 |
| 2018 | pit | 3 | 4 | 0.750 | 6.5 | 12 | 0.542 | 0.567 | -0.30 |
| 2018 | den | 2 | 6 | 0.333 | 4 | 10 | 0.400 | 0.441 | -0.41 |
| 2018 | cin | 4 | 10 | 0.400 | 2 | 6 | 0.333 | 0.452 | -0.71 |
| 2018 | gnb | 3 | 7 | 0.429 | 3.5 | 9 | 0.389 | 0.472 | -0.75 |
| 2018 | tam | 2 | 7 | 0.286 | 3 | 9 | 0.333 | 0.417 | -0.75 |
| 2018 | chi | 6 | 6 | 1.000 | 6 | 10 | 0.600 | 0.676 | -0.76 |
| 2018 | phi | 3 | 4 | 0.750 | 6 | 12 | 0.500 | 0.567 | -0.80 |
| 2018 | sea | 5 | 6 | 0.833 | 5 | 10 | 0.500 | 0.618 | -1.18 |
| 2018 | nyg | 1 | 4 | 0.250 | 4 | 12 | 0.333 | 0.433 | -1.20 |
| 2018 | htx | 5 | 5 | 1.000 | 6 | 11 | 0.545 | 0.656 | -1.22 |
| 2018 | kan | 7 | 7 | 1.000 | 5 | 9 | 0.556 | 0.694 | -1.25 |
| 2018 | det | 5 | 11 | 0.455 | 1 | 5 | 0.200 | 0.477 | -1.39 |
| 2018 | nyj | 3 | 10 | 0.300 | 1 | 6 | 0.167 | 0.405 | -1.43 |
| 2018 | jax | 3 | 8 | 0.375 | 2 | 8 | 0.250 | 0.447 | -1.58 |
| 2018 | rav | 8 | 10 | 0.800 | 2 | 6 | 0.333 | 0.643 | -1.86 |
| 2018 | car | 5 | 7 | 0.714 | 2 | 9 | 0.222 | 0.583 | -3.25 |