
You may recall that last year, I looked at which college conferences dominate the NFL draft. Today, I want to look at which teams have dominated the draft since 1990. And while there are no surprises, it’s fun to put numbers to what we all can sense. Here’s what I did:
1) Using these draft values, assign a value to every pick in every draft from 1990 to 2014.
2) Calculate the amount of draft capital assigned to each college team by summing the values from each draft pick for each player from that college.
3) Create a heat map of the results, where red = more draft value and blue = less draft value.
Below are the top 75 schools in draft value created over the last 25 years. You won’t be shocked to see that Florida State ranks 1st, with its players being worth 1,165 points of draft value over that span. And with Jameis Winston headlining a host of Seminoles expected to be drafted this year, Florida State can probably comfortably settle into that top spot for the foreseeable future.
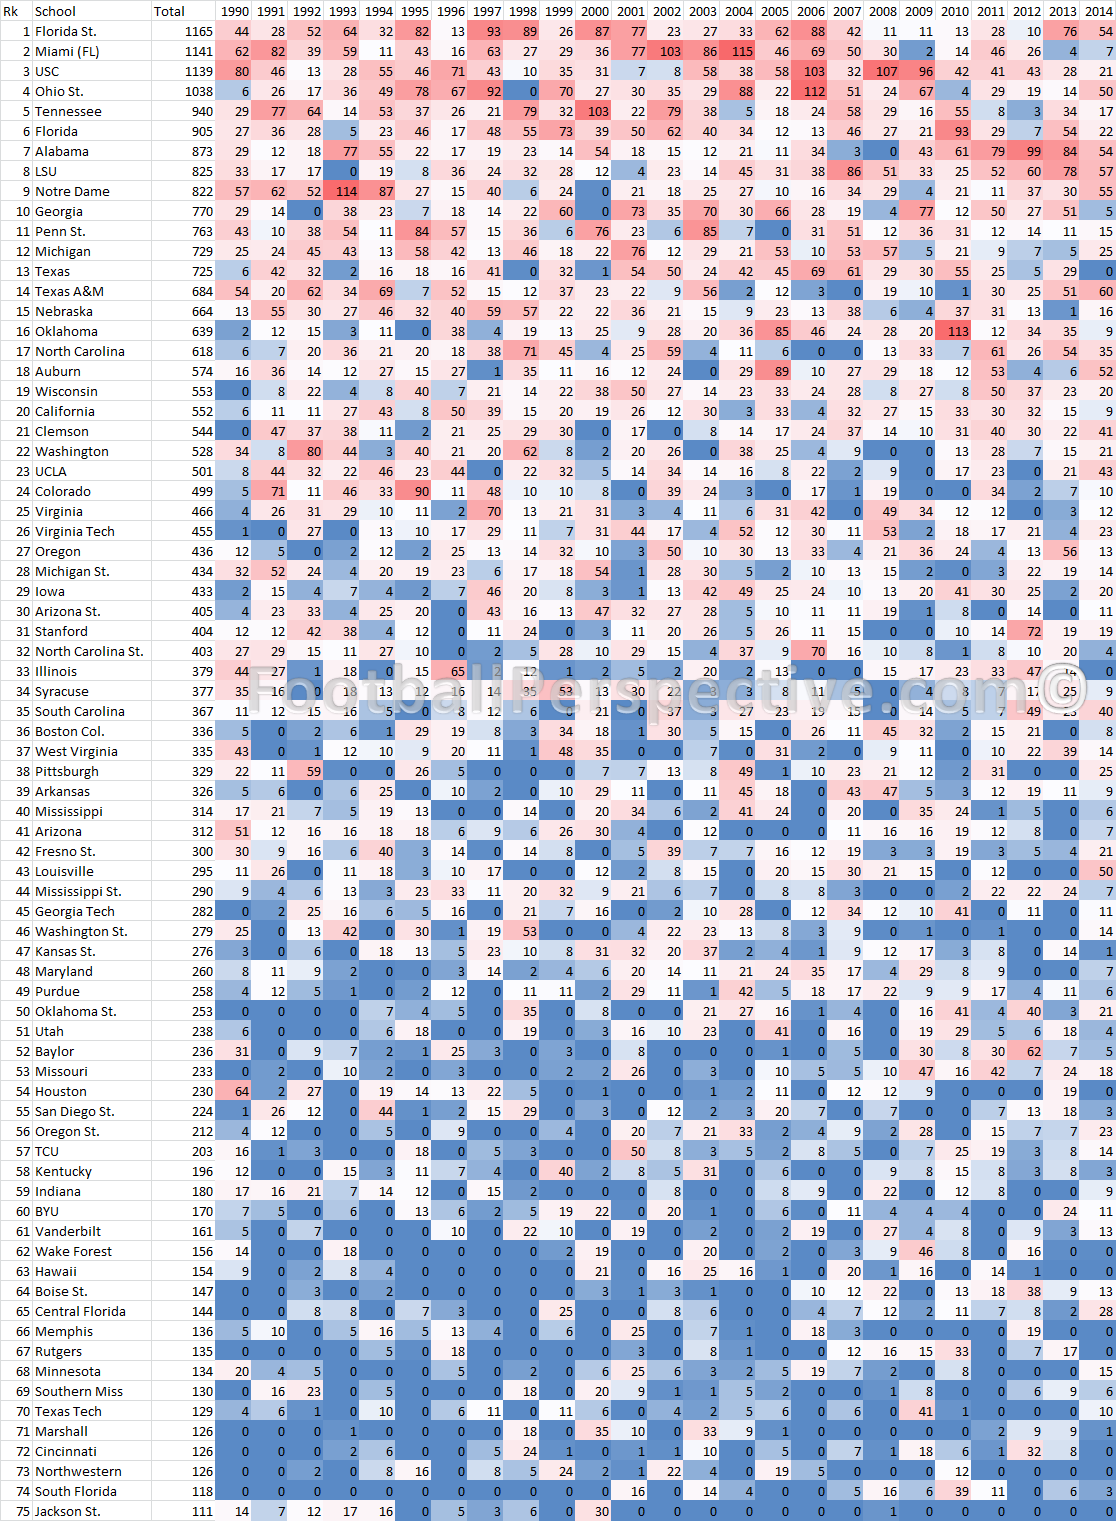
I know the numbers may not mean much in the abstract to some of you, so here’s the same information but with each school’s rank among these teams in each year. For ties, I have given an average of the ranks.
Miami had a four-year run as the top school from 2001 to 2004, while Alabama matched that feat for three straight years (2011-2013). Alabama’s line is pretty interesting: after miserable draft classes in ’07 and ’08, the Crimson Tide have ranked in the top six in six straight years. There are lots of fun lines to look at here — compare Texas and Texas A&M (conveniently located next to each other!), or the big bumps teams like Marshall and TCU achieved in certain years. Baylor had a long stretch of blue before turning red, and then bright red in 2012. Houston has 1990 and not much else.

I’ll leave the rest of the commentary to you guys. Enjoy!