
Over the last three days, I have been writing about the fact that points scored isn’t linearly correlated with winning percentage. In fact, there are a few bumps, and it relates to field goals vs. touchdowns. As we’ve learned:
- Not only is scoring 13 points better than scoring 14 points, but scoring 9 points is better than 14 points.
- This works for increments on 7, too: 16 is better than 21, 23 is better than 28, and 30 is better than 35, too.
What I thought was the next natural question: do yards and yards allowed follow a similar pattern?
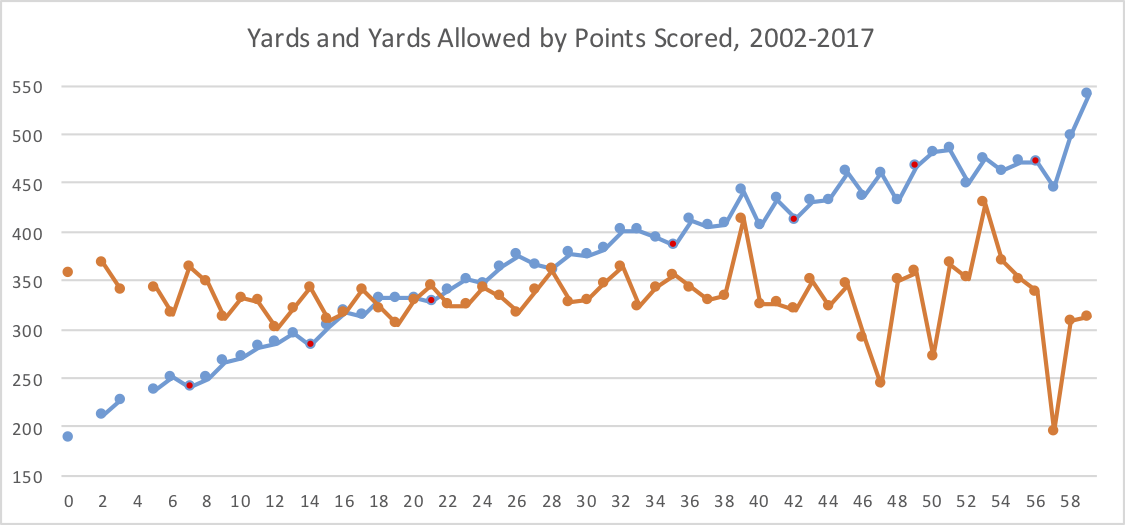
The graph below shows, in blue, the average number of yards gained for teams based on their points scored (on the X-Axis). In addition, in orange, I’ve shown the average number of yards allowed. As before, I put a red dot (on the blue line) for 7, 14, 21, 28, 35, 42, 48, and 56 points. And wouldn’t you know: there is, in fact, a small dip in yards gained at these levels: teams that score 13 points gain more yards than teams that score 14 points, and that holds true at 20/21, 27/28, 34/35, and 41/42.
That chart above is a little cluttered, so let’s just look at yards differential at each level (with the Y-Axis going from -200 to 200 yards, even if it cuts off at the top):
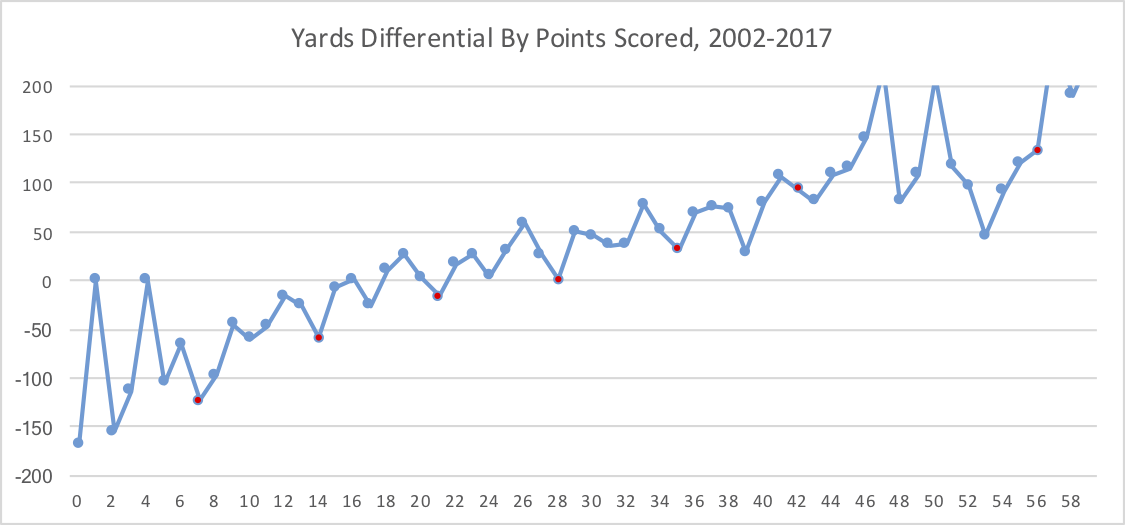
Here, 9 points (-45 yards) is better than 14 (-58), 16 points (+1) is better than 21 (-17), 23 points (+27) is better than 28 (+1), and so on.
Who would have guessed that, on average, teams that score 16 points and teams that score 28 points both have the same yardage differential? At 16 points, the average (since 2002) is 318 yards and 217 yards allowed; at 28 points, those averages are 361 yards and 360 yards.
Football is neat.