
Over the last two days, I’ve looked at the football oddity that teams that score 13 points had a better winning percentage than teams that scored 14 points. Today, let’s look at the winning percentage for all points scored.
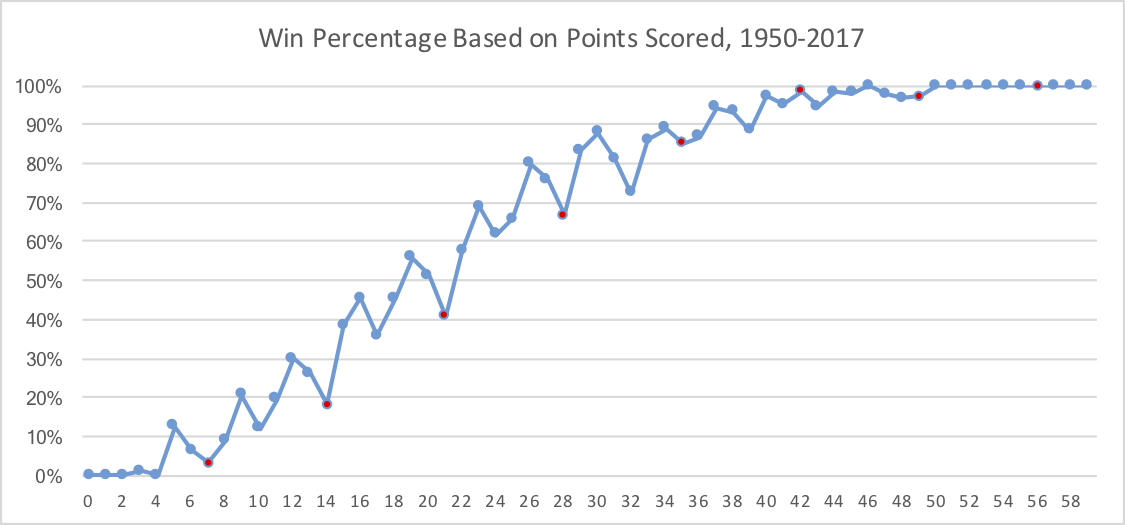
That’s what the graph below shows: the winning percentage, based on points scored, for all points scored totals from zero to sixty. To make it a little easier to follow, I’ve colored in red the multiples of 7; as you can see, those numbers (7, 14, 21, and 28) also represent dips in the graph. What’s interesting is that three field goals is better than two touchdowns across a number of multiples. For example, scoring 9 points is better than scoring 14 points, scoring 16 points is better than 21 points, scoring 23 points is even better than scoring 28 points, and scoring 30 points is better than 35 points. Take a look:
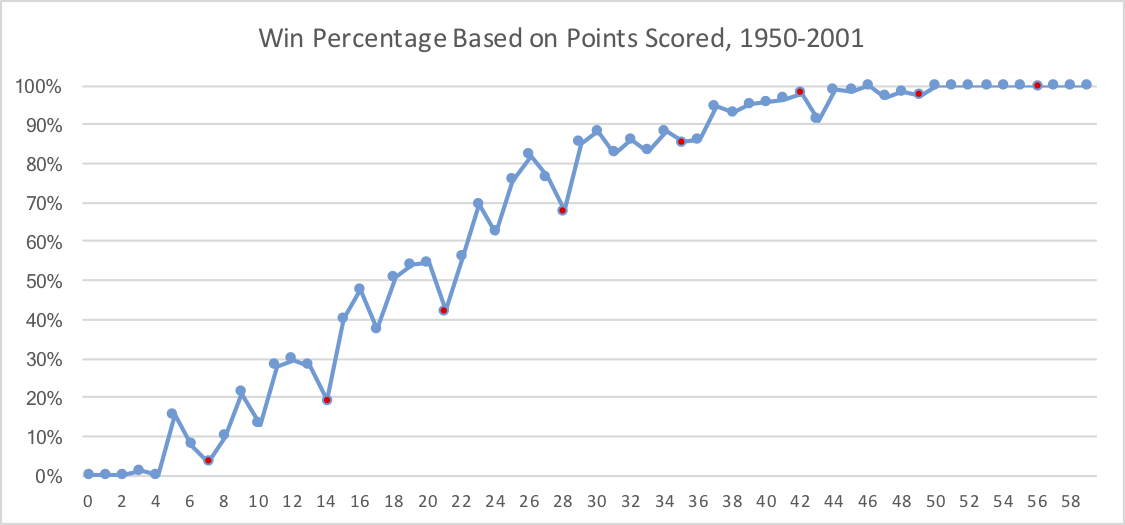
We can also break that data down into pre-2002 and post-2002: in general, as you’d suspect, winning percentages are lower across the board in the post-2002 world, but I’m not sure if there are too many other trends to decipher:
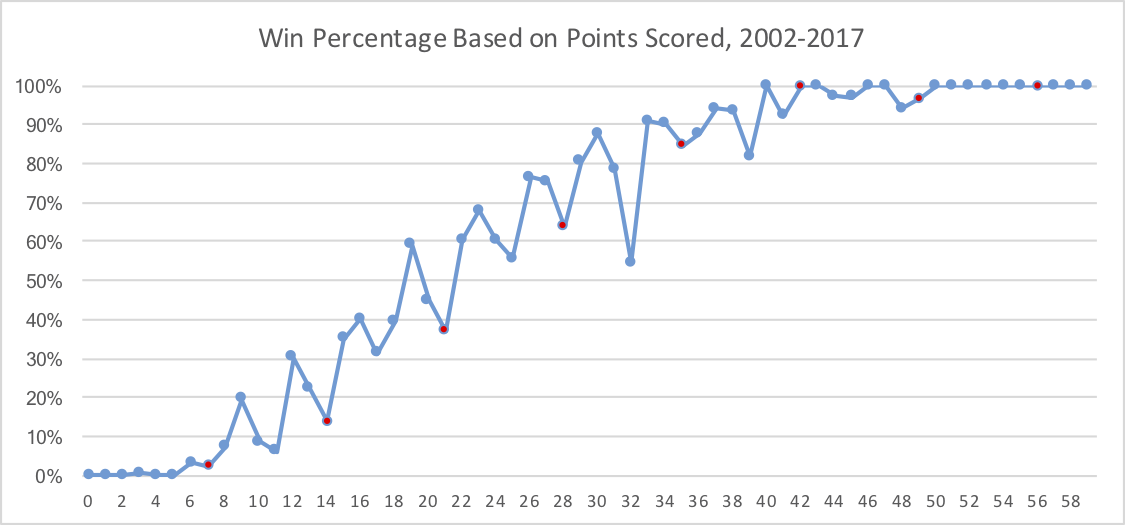
And post-2002:
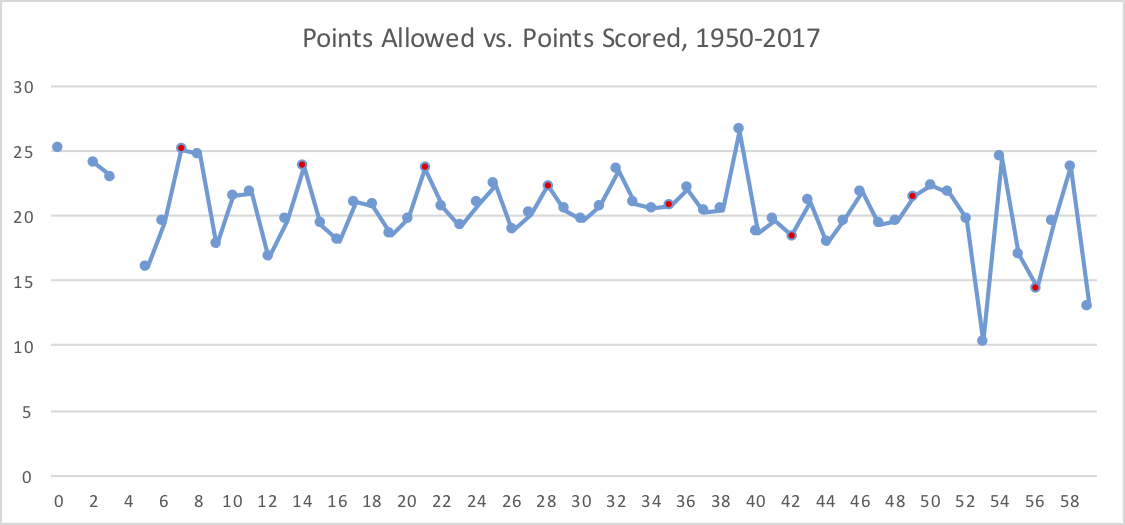
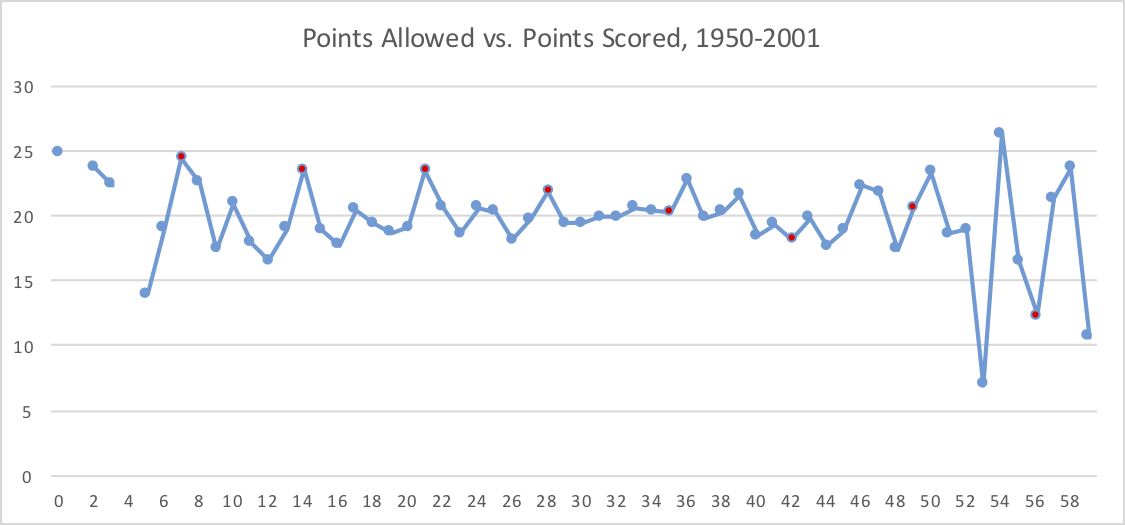
What’s also interesting is seeing the number of points allowed for each level of points scored. The ratio might not be what you think: in general, from 1950 to 2017, opponents scored around 20 points regardless of how many points each team scored.
And here’s the 1950-2001 data:
And 2002-2017:
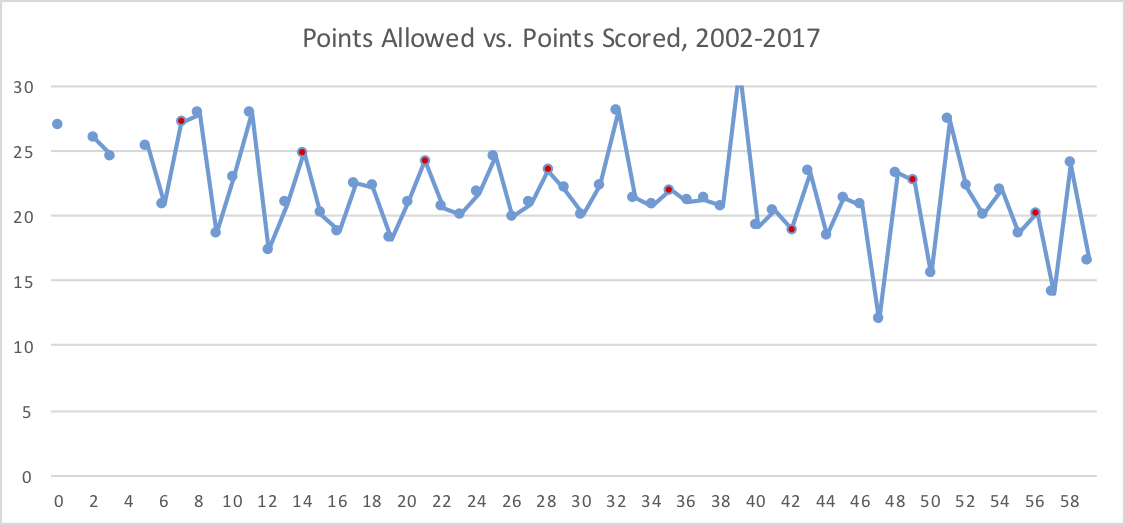
In fact, the general trend (especially in recent years) is that teams that score more points allow fewer points.
What stands out to you?