
I highly recommend the Bill Barnwell podcast, and this week’s episode previewing the NFC South was a good one. When hearing about the Saints terrible defense last year, Barnwell noted that it seemed like the Saints defense was always allowing big touchdowns.
Well, that’s true: New Orleans gave up a whopping ten touchdown passes of 40+ yards last season; Washington was second with 7 such touchdowns, and that included three touchdowns of exactly 40 yards. By contrast, the Saints allowed six touchdown passes of 50+ yards! The last pass defense to allow 10 touchdowns of 40+ yards was the 1989 Houston Oilers, a 9-7 team that made the playoffs.
The most long (i.e., 40+ yards) passing touchdowns allowed in a season? That sad place in history belongs to another Oilers team. In 1966, Houston allowed 15 such touchdowns in a 14-game season. The 1961 Bills allowed 14 touchdown passes of 40+ yards, the 1950 Rams allowed 12 such scores, and the ’83 Cowboys, ’68 Dolphins, ’65 Browns, and ’52 Texans allowed 11 long touchdowns.
Last year’s Saints allowed, on average, 7.9 yards on every opposing dropback last year. That’s the largest average gain since the 1981 Colts defense (8.2), and it was obviously inflated by all those long touchdowns. But the good news for Saints fans is that regression to the mean has to help New Orleans… right?
I looked at the 20-year period from 1995 to 2014, and calculated the average NY/A allowed by each defense in each year, and then that team’s average gain allowed the following season. The best-fit formula, using a linear regression, to project a defense’s NY/A average in Year N+1 if you know the team’s NY/A allowed in Year N is:
Year N+1 NY/A = 4.06 + 0.33 * Year N NY/A
That means regression to the mean is an enormous force : only 1/3 of a defense’s rating in Year N+1 is based on the team’s rating in Year N. Thought of another way, regression to the mean brings about 2/3s of each defense’s rating back to the mean each year. If you’re a visual learner, take a look at the graph below. The X-Axis shows each defense’s NY/A rating allowed in Year N; the Y-Axis shows the rating for that team in Year N+1.
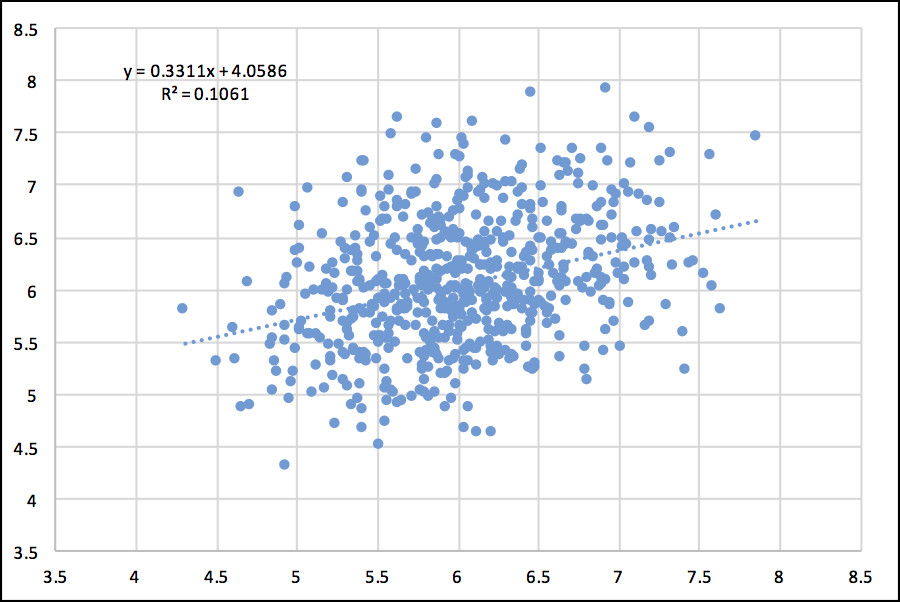
There’s a correlation, of course, but it’s not nearly as strong as you might think. If bad defenses stayed bad, and great defenses stayed great, the slope of that dotted line would be more vertical and less flat. Teams like the 2010 Texans made enormous improvements, jumping from 7.4 NY/A to 5.2 in 2011, though the addition of two Hall of Fame talents is not exactly a repeatable strategy. But the ’07 Ravens went from 6.8 NY/A allowed to 5.1, the ’01 Panthers went from 6.8 to 5.2, the ’06 Bucs went from 6.5 to 5.2, the ’98 Ravens from 6.2 to 4.6, the’08 Jets from 6.1 to 4.6, and so on. There are dozens of examples of bad defenses becoming at least average, which is why the year-to-year correlation is so low. In 2014, the Falcons were last in NY/A allowed at 7.6, but improved to 6.7 last year.
The Saints should benefit from regression to the mean, especially given how many long touchdowns the pass defense allowed last year. Perhaps that can provide some comfort to Saints fans getting ready for this season.