
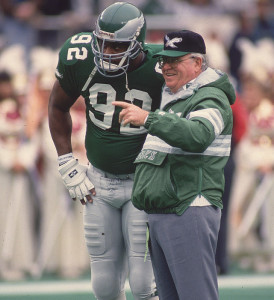
White and Ryan helped lead a dominant Eagles pass rush
The football community is in mourning this week, after the passing of Buddy Ryan. Remembered as one of the most celebrated and color defensive coaches in history, Ryan’s most famous accomplishment was guiding the ’85 Bears to a Super Bowl — on the backs of one of the greatest defenses in NFL history. But Ryan’s defenses weren’t just known for being great: they were known for being great at attacking the opposition. Some defenses, like the 2009 Jets, were great defenses but were not all that aggressive: those Jets ranked 1st in points, yards, first downs, and yards per attempt, but were 11th in interception rate and below-average in sack rate.
Ryan’s defenses were known for their big plays — sacks, fumbles, interceptions, and scoring plays. So I decided to create a formula using some gut and fuzzy math to create a Ryan Index of aggressiveness. Here’s the formula:
- 2 points for every sack
- 4 points for every interception
- 3 points for every forced fumble, 1 point for every fumble recovery
- 6 points for every interception return (on top of the 4 points for the interception)
- 6 points for every fumble return touchdown (on top of the 4 points for forcing and recovering the fumble)
- 5 points for every safety
- Finally, here are the points awarded based on the points allowed in the game:
- 0 points: +15 points
- 1-3 points: +12 points
- 4-7 points: +10 points
- 8-10: +8
- 11-14: +6
- 15-16: +4
- 17-21: +2
- 22-23: 0
- 24-27: -2
- 28-30: -4
- 31-34: -7
- 35+ points: -10
Let’s take some games from the ’85 Bears as examples.
- In a 44-0 thrashing against the Cowboys, the Bears get +15 for the shutout, +12 for recording 6 sacks, +16 for four interceptions, +3 for a forced fumble, +1 for a fumble recovery, and +12 for the two pick sixes. That totals 59 points, the best game by the Bears all season.
- In Super Bowl XX, Chicago scored a +57. How? New England scored 10 points (+8), and committed six turnovers (+24). Chicago had 7 sacks (+14), a safety (+5), and a return touchdown (+6).
This system isn’t perfect, and I am sure you can quibble with the values. But I think this does a good enough job of identifying the most aggressive and successful defenses.
After calculating the score for each defense in each game (including playoffs), I then summed those results to get a team grade for each team season. Then, I calculated the Z-Score for every team in NFL history using those team grades to measure how many standard deviations above/below average each team was in each year. So why is this called the Ryan Index? Because Buddy or Rex Ryan was the defensive coordinator for the first and third teams using this methodology.
Here’s how to read the table below, using the ’85 Bears as an example. That Chicago team ranked 3rd all-time by this methodology. The Bears defense produced 658 points over 19 games, or 25.3 points per game. The league average defense scored 14.2 points per game using this methodology, while the standard deviation of all defenses in 1985 was 4.08. As a result, the Bears were 2.88 standard deviations better than average that season.
| Rk | Tm | Year | Pts | G | Pts/G | Lg Avg | Lg StDv | Z-Score |
|---|---|---|---|---|---|---|---|---|
| 1 | BAL | 2006 | 487 | 17 | 28.6 | 16.1 | 4.07 | 3.09 |
| 2 | TAM | 2002 | 551 | 19 | 29.0 | 15.6 | 4.57 | 2.93 |
| 3 | CHI | 1985 | 658 | 19 | 34.6 | 20.1 | 5.04 | 2.88 |
| 4 | SEA | 2013 | 481 | 19 | 25.3 | 14.2 | 4.08 | 2.72 |
| 5 | CHI | 2012 | 410 | 16 | 25.6 | 13.8 | 4.48 | 2.64 |
| 6 | MIN | 1988 | 495 | 18 | 27.5 | 18.3 | 3.51 | 2.61 |
| 7 | SDG | 1961 | 560 | 15 | 37.3 | 21.1 | 6.30 | 2.58 |
| 8 | SFO | 2011 | 412 | 18 | 22.9 | 14.3 | 3.38 | 2.54 |
| 9 | MIN | 1970 | 481 | 15 | 32.1 | 20.1 | 4.78 | 2.51 |
| 10 | NYG | 1938 | 367 | 12 | 30.6 | 11.1 | 8.10 | 2.41 |
| 11 | KAN | 1995 | 400 | 17 | 23.5 | 16.1 | 3.12 | 2.37 |
| 12 | NYG | 1937 | 295 | 11 | 26.8 | 11.6 | 6.46 | 2.36 |
| 13 | NWE | 2003 | 489 | 19 | 25.7 | 16.0 | 4.12 | 2.36 |
| 14 | PIT | 1974 | 508 | 17 | 29.9 | 20.5 | 4.03 | 2.32 |
| 15 | BAL | 2000 | 596 | 20 | 29.8 | 17.1 | 5.49 | 2.32 |
| 16 | SEA | 1998 | 411 | 16 | 25.7 | 16.4 | 4.01 | 2.32 |
| 17 | DET | 1962 | 457 | 14 | 32.6 | 20.5 | 5.30 | 2.30 |
| 18 | CHI | 1942 | 428 | 12 | 35.7 | 20.8 | 6.61 | 2.26 |
| 19 | ATL | 1977 | 453 | 14 | 32.4 | 22.3 | 4.55 | 2.22 |
| 20 | NYG | 1997 | 443 | 17 | 26.1 | 17.2 | 4.07 | 2.18 |
| 21 | PHI | 1991 | 466 | 16 | 29.1 | 18.2 | 5.00 | 2.18 |
| 22 | BAL | 2008 | 456 | 19 | 24.0 | 14.1 | 4.53 | 2.18 |
| 23 | NYG | 1935 | 263 | 13 | 20.2 | 10.6 | 4.45 | 2.16 |
| 24 | KAN | 1997 | 441 | 17 | 25.9 | 17.2 | 4.07 | 2.15 |
| 25 | PHI | 2002 | 458 | 18 | 25.4 | 15.6 | 4.57 | 2.15 |
| 26 | JAX | 1999 | 499 | 18 | 27.7 | 17.6 | 4.72 | 2.14 |
| 27 | CHI | 1986 | 495 | 17 | 29.1 | 19.8 | 4.41 | 2.12 |
| 28 | CHI | 1963 | 515 | 15 | 34.3 | 20.6 | 6.51 | 2.12 |
| 29 | OAK | 1980 | 565 | 20 | 28.3 | 19.2 | 4.31 | 2.10 |
| 30 | CAR | 2015 | 432 | 19 | 22.7 | 13.7 | 4.31 | 2.09 |
| 31 | DEN | 1984 | 534 | 17 | 31.4 | 19.9 | 5.54 | 2.08 |
| 32 | GNB | 1966 | 482 | 16 | 30.1 | 19.8 | 4.96 | 2.08 |
| 33 | GNB | 2010 | 462 | 20 | 23.1 | 14.7 | 4.07 | 2.07 |
| 34 | PHI | 1989 | 496 | 17 | 29.2 | 18.8 | 5.03 | 2.07 |
| 35 | HOU | 1993 | 441 | 17 | 25.9 | 18.1 | 3.81 | 2.05 |
| 36 | RAM | 1966 | 420 | 14 | 30.0 | 19.8 | 4.96 | 2.05 |
| 37 | SEA | 1984 | 562 | 18 | 31.2 | 19.9 | 5.54 | 2.05 |
| 38 | NYG | 1951 | 449 | 12 | 37.4 | 21.0 | 8.04 | 2.04 |
| 39 | KAN | 1969 | 533 | 17 | 31.4 | 19.7 | 5.70 | 2.04 |
| 40 | WAS | 1964 | 406 | 14 | 29.0 | 21.3 | 3.80 | 2.02 |
| 41 | DAL | 1981 | 527 | 18 | 29.3 | 19.6 | 4.80 | 2.02 |
| 42 | KAN | 1990 | 435 | 17 | 25.6 | 17.8 | 3.88 | 2.01 |
| 43 | BAL | 1968 | 518 | 17 | 30.5 | 19.3 | 5.58 | 2.00 |
| 44 | PHI | 1949 | 395 | 13 | 30.4 | 17.5 | 6.48 | 1.98 |
| 45 | PIT | 2008 | 439 | 19 | 23.1 | 14.1 | 4.53 | 1.98 |
| 46 | GNB | 1996 | 479 | 19 | 25.2 | 17.0 | 4.17 | 1.97 |
| 47 | BAL | 2011 | 376 | 18 | 20.9 | 14.3 | 3.38 | 1.95 |
| 48 | SDG | 2007 | 431 | 19 | 22.7 | 15.6 | 3.65 | 1.94 |
| 49 | OAK | 1967 | 487 | 16 | 30.4 | 19.8 | 5.49 | 1.93 |
| 50 | PIT | 1994 | 416 | 18 | 23.1 | 16.2 | 3.60 | 1.92 |
| 51 | GNB | 1947 | 324 | 12 | 27.0 | 16.3 | 5.69 | 1.88 |
| 52 | CAR | 1996 | 446 | 18 | 24.8 | 17.0 | 4.17 | 1.86 |
| 53 | NYG | 1939 | 350 | 12 | 29.2 | 16.5 | 6.82 | 1.86 |
| 54 | CHI | 2005 | 396 | 17 | 23.3 | 16.2 | 3.84 | 1.84 |
| 55 | DEN | 2015 | 411 | 19 | 21.6 | 13.7 | 4.31 | 1.84 |
| 56 | NYG | 1944 | 394 | 11 | 35.8 | 19.9 | 8.71 | 1.82 |
| 57 | SFO | 1995 | 371 | 17 | 21.8 | 16.1 | 3.12 | 1.82 |
| 58 | CHI | 2001 | 437 | 17 | 25.7 | 17.6 | 4.47 | 1.82 |
| 59 | GNB | 1962 | 451 | 15 | 30.1 | 20.5 | 5.30 | 1.81 |
| 60 | WAS | 1991 | 518 | 19 | 27.3 | 18.2 | 5.00 | 1.81 |
| 61 | NOR | 1991 | 463 | 17 | 27.2 | 18.2 | 5.00 | 1.80 |
| 62 | PIT | 1972 | 474 | 16 | 29.6 | 19.5 | 5.62 | 1.80 |
| 63 | NOR | 1992 | 454 | 17 | 26.7 | 19.5 | 4.06 | 1.78 |
| 64 | PIT | 2010 | 415 | 19 | 21.8 | 14.7 | 4.07 | 1.77 |
| 65 | CHI | 1948 | 326 | 12 | 27.2 | 16.5 | 6.10 | 1.75 |
| 66 | GNB | 1943 | 291 | 10 | 29.1 | 19.9 | 5.28 | 1.75 |
| 67 | NYG | 1950 | 433 | 13 | 33.3 | 22.5 | 6.20 | 1.75 |
| 68 | NWE | 2004 | 445 | 19 | 23.4 | 15.9 | 4.32 | 1.74 |
| 69 | GNB | 1965 | 447 | 16 | 27.9 | 19.9 | 4.62 | 1.74 |
| 70 | TEN | 2000 | 452 | 17 | 26.6 | 17.1 | 5.49 | 1.73 |
| 71 | NYG | 1986 | 521 | 19 | 27.4 | 19.8 | 4.41 | 1.73 |
| 72 | CAR | 2013 | 362 | 17 | 21.3 | 14.2 | 4.08 | 1.73 |
| 73 | BUF | 1965 | 418 | 15 | 27.9 | 19.9 | 4.62 | 1.72 |
| 74 | MIA | 1982 | 384 | 13 | 29.5 | 20.7 | 5.17 | 1.71 |
| 75 | DAL | 1971 | 485 | 17 | 28.5 | 20.9 | 4.47 | 1.71 |
| 76 | BAL | 2003 | 392 | 17 | 23.1 | 16.0 | 4.12 | 1.71 |
| 77 | WAS | 1973 | 457 | 15 | 30.5 | 20.7 | 5.74 | 1.70 |
| 78 | PIT | 1973 | 457 | 15 | 30.5 | 20.7 | 5.74 | 1.70 |
| 79 | MIN | 1971 | 427 | 15 | 28.5 | 20.9 | 4.47 | 1.70 |
| 80 | STL | 1999 | 487 | 19 | 25.6 | 17.6 | 4.72 | 1.70 |
| 81 | PIT | 1978 | 526 | 19 | 27.7 | 21.4 | 3.71 | 1.70 |
| 82 | CLE | 1946 | 461 | 15 | 30.7 | 19.7 | 6.54 | 1.69 |
| 83 | CHI | 2006 | 435 | 19 | 22.9 | 16.1 | 4.07 | 1.68 |
| 84 | MIN | 1969 | 497 | 17 | 29.2 | 19.7 | 5.70 | 1.67 |
| 85 | TEN | 2008 | 368 | 17 | 21.6 | 14.1 | 4.53 | 1.66 |
| 86 | SFO | 2009 | 334 | 16 | 20.9 | 15.0 | 3.55 | 1.64 |
| 87 | DTX | 1960 | 405 | 14 | 28.9 | 20.9 | 4.88 | 1.64 |
| 88 | NYG | 1941 | 331 | 12 | 27.6 | 17.5 | 6.15 | 1.64 |
| 89 | BAL | 1971 | 451 | 16 | 28.2 | 20.9 | 4.47 | 1.64 |
| 90 | NYG | 1954 | 395 | 12 | 32.9 | 22.9 | 6.15 | 1.63 |
| 91 | BUF | 2014 | 308 | 16 | 19.3 | 13.9 | 3.29 | 1.63 |
| 92 | CHI | 1959 | 344 | 12 | 28.7 | 20.1 | 5.25 | 1.63 |
| 93 | NYG | 1936 | 230 | 12 | 19.2 | 12.2 | 4.26 | 1.63 |
| 94 | NYG | 1961 | 469 | 15 | 31.3 | 21.1 | 6.30 | 1.62 |
| 95 | WAS | 1983 | 513 | 19 | 27.0 | 20.3 | 4.17 | 1.62 |
| 96 | HOU | 2014 | 307 | 16 | 19.2 | 13.9 | 3.29 | 1.61 |
| 97 | BUF | 2004 | 365 | 16 | 22.8 | 15.9 | 4.32 | 1.60 |
| 98 | RAM | 1952 | 422 | 13 | 32.5 | 25.2 | 4.57 | 1.60 |
| 99 | MIA | 2003 | 361 | 16 | 22.6 | 16.0 | 4.12 | 1.59 |
| 100 | KAN | 2015 | 370 | 18 | 20.6 | 13.7 | 4.31 | 1.59 |
And here is how Buddy’s teams ranked in each season:
| Yr Rk | Tm | Year | Pos | Pts | G | Pts/G | Lg Avg | Lg StDv | Z-Score |
|---|---|---|---|---|---|---|---|---|---|
| 12 | MIN | 1976 | DC | 382 | 17 | 22.5 | 21.4 | 5.57 | 0.19 |
| 21 | MIN | 1977 | DC | 310 | 16 | 19.4 | 22.3 | 4.55 | -0.63 |
| 19 | CHI | 1978 | DC | 323 | 16 | 20.2 | 21.4 | 3.71 | -0.32 |
| 2 | CHI | 1979 | DC | 409 | 17 | 24.1 | 19.5 | 3.22 | 1.42 |
| 10 | CHI | 1980 | DC | 345 | 16 | 21.6 | 19.2 | 4.31 | 0.55 |
| 18 | CHI | 1981 | DC | 300 | 16 | 18.8 | 19.6 | 4.80 | -0.17 |
| 12 | CHI | 1982 | DC | 204 | 9 | 22.7 | 20.7 | 5.17 | 0.39 |
| 6 | CHI | 1983 | DC | 370 | 16 | 23.1 | 20.3 | 4.17 | 0.69 |
| 4 | CHI | 1984 | DC | 461 | 18 | 25.6 | 19.9 | 5.54 | 1.03 |
| 1 | CHI | 1985 | DC | 658 | 19 | 34.6 | 20.1 | 5.04 | 2.88 |
| 10 | PHI | 1986 | HC | 336 | 16 | 21.0 | 19.8 | 4.41 | 0.28 |
| 6 | PHI | 1987 | HC | 336 | 15 | 22.4 | 19.5 | 4.09 | 0.72 |
| 5 | PHI | 1988 | HC | 368 | 17 | 21.6 | 18.3 | 3.51 | 0.95 |
| 1 | PHI | 1989 | HC | 496 | 17 | 29.2 | 18.8 | 5.03 | 2.07 |
| 6 | PHI | 1990 | HC | 353 | 17 | 20.8 | 17.8 | 3.88 | 0.77 |
| 1 | HOU | 1993 | DC | 441 | 17 | 25.9 | 18.1 | 3.81 | 2.05 |
| 4 | ARI | 1994 | HC | 323 | 16 | 20.2 | 16.2 | 3.60 | 1.11 |
| 12 | ARI | 1995 | HC | 268 | 16 | 16.8 | 16.1 | 3.12 | 0.19 |
Ryan coached three different franchises to a 1st-place ranking in the Ryan index. In an interesting twist, two defenses — the ’86 Bears and ’91 Eagles — had historically great seasons and led the league in the Ryan Index in the year after Ryan left. His imprint was on a host of great defenses over a 20-year career. Rest in peace, Buddy.