
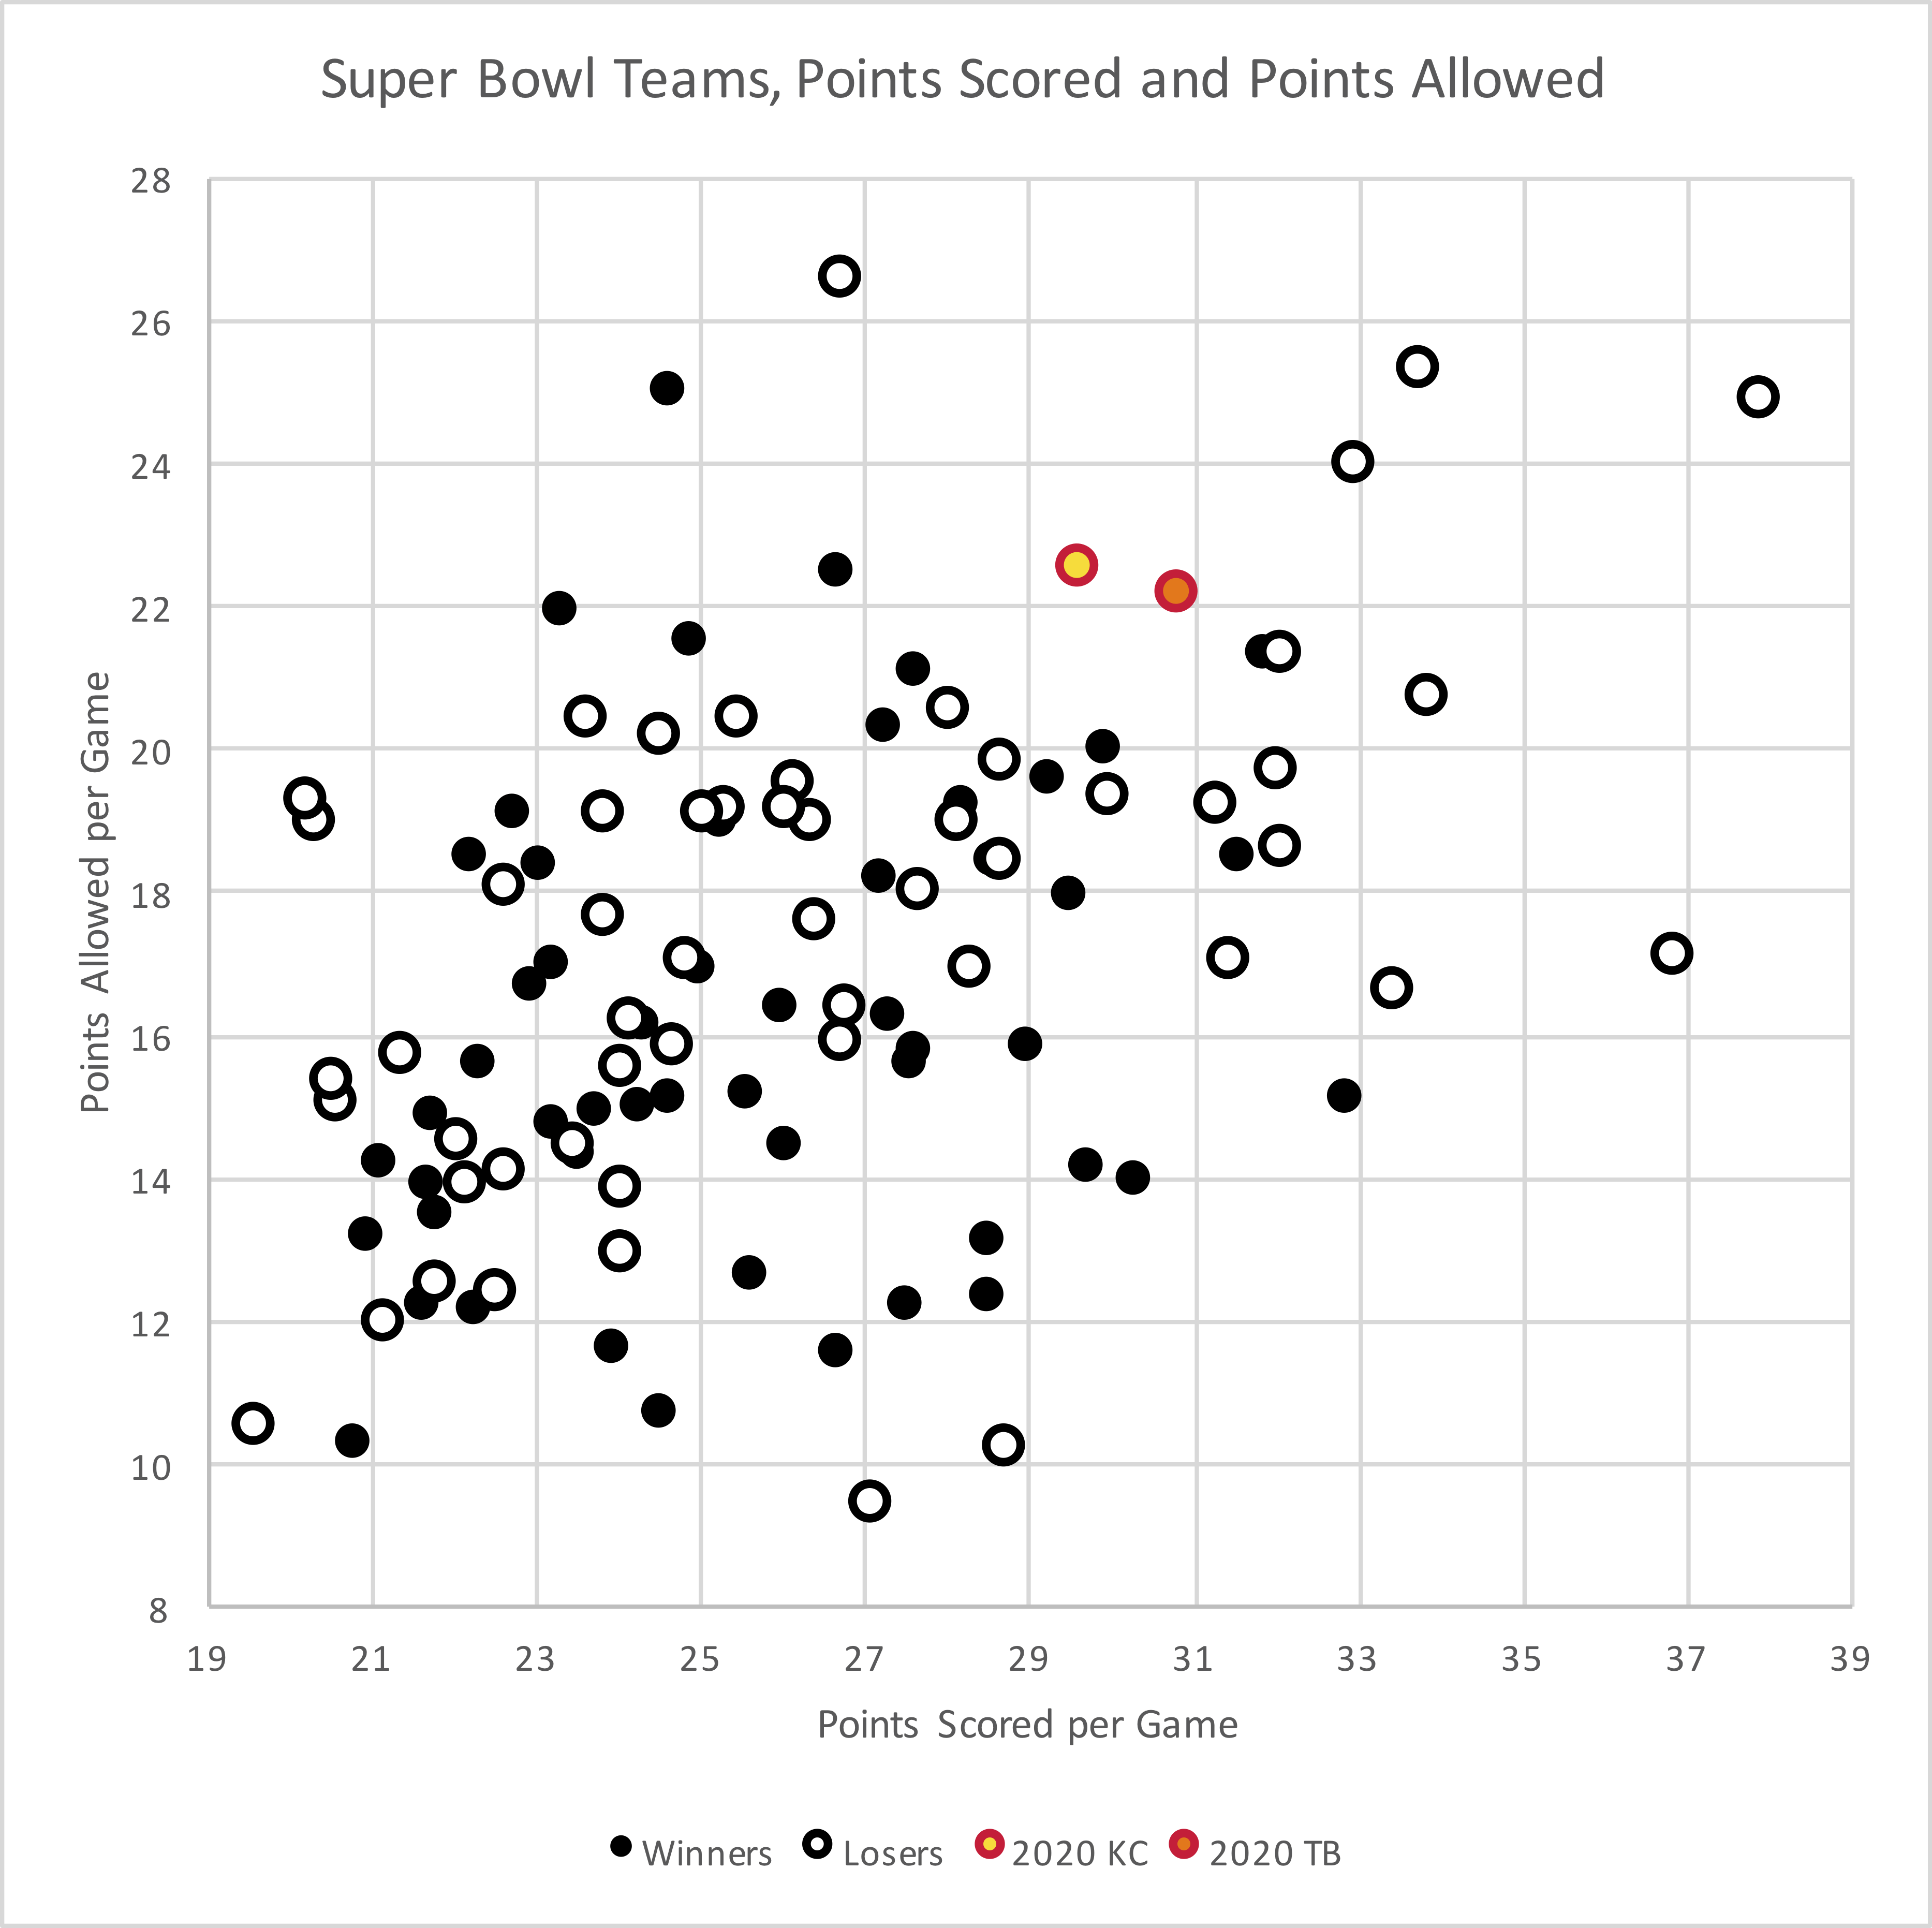
How do Kansas City and Tampa Bay compare to previous Super Bowl participants when it comes to scoring and preventing points? Without any adjustments for era, these two teams look like awful defensive teams and very good (but not historically great) offensive teams.
In the graph below, the X-Axis shows points scored per game, while the Y-Axis shows points allowed per game. The best teams would be in the lower right, at least according to this metric. The Bucs and Chiefs are color-coded, with Super Bowl winners in black circles and losers in white circles. The ’99 Rams are in the lower right corner at 33 points per game and 15 points allowed per game; the ’13 Broncos are the team at the far upper right, while the ’11 Giants, of course, are in the upper left: they are the only Super Bowl team to allow more points than they scored.
In addition, I wanted to look at how these teams compared to their Pythagenpat winning percentages. That’s because Kansas City and Tampa Bay are both pretty interesting in that regard. The Bucs were better than the average 11-5 team; Tampa Bay actually had a Pythagenpat winning percentage of 71%, compared to an actual winning percentage of 69%. But the Chiefs are the big outlier: Kansas City went 14-2 (88%) but with a 67% Pythagenpat winning percentage. As you can see from the chart above, Tampa Bay actually scored more points than Kansas City (30.8 PPG to 29.6) and allowed fewer points (22.2 compared to 22.6). So the Bucs had the better Pythagenpat winning percentage but a significantly worse record.
But don’t forget that the Chiefs rested starters and lost in week 17. If we exclude that game — which we probably should — the Chiefs have a 71% Pythagenpat winning percentage and a 93% actual winning percentage! The graph below shows the expected (X-Axis) and actual (Y-Axis) winning percentage of each Super Bowl team.

The Chiefs are tied with the ’76 Raiders for the most extreme overachiever award. Oakland went 13-1 that season with an 73% expected winning percentage; the ’99 Titans (62% expected, 81% actual) and ’09 Colts (69%, 88%) are the other big overachievers. The ’09 Colts, along with the ’76 Raiders, are probably the best comparison to these Chiefs. In 2009, Indianapolis actual started 14-0 before benching starters; through 14 games, Indianapolis had a 100% winning percentage but an expected winning percentage of just 77%.
Here is the same data in table form.
| Team | Year | PF/G | PA/G | Won SB? | Act. Win% | PythagW% | Diff |
|---|---|---|---|---|---|---|---|
| kan | 2020 | 29.6 | 22.6 | 0.875 | 0.674 | -0.201 | |
| tam | 2020 | 30.8 | 22.2 | 0.688 | 0.708 | 0.021 | |
| sfo | 2019 | 29.9 | 19.4 | Lost | 0.813 | 0.761 | -0.052 |
| kan | 2019 | 28.2 | 19.3 | Won | 0.75 | 0.732 | -0.018 |
| ram | 2018 | 32.9 | 24 | Lost | 0.813 | 0.705 | -0.107 |
| nwe | 2018 | 27.3 | 20.3 | Won | 0.688 | 0.685 | -0.003 |
| nwe | 2017 | 28.6 | 18.5 | Lost | 0.813 | 0.759 | -0.053 |
| phi | 2017 | 28.6 | 18.4 | Won | 0.813 | 0.76 | -0.053 |
| nwe | 2016 | 27.6 | 15.6 | Won | 0.875 | 0.812 | -0.063 |
| atl | 2016 | 33.8 | 25.4 | Lost | 0.688 | 0.689 | 0.001 |
| car | 2015 | 31.3 | 19.3 | Lost | 0.938 | 0.785 | -0.152 |
| den | 2015 | 22.2 | 18.5 | Won | 0.75 | 0.613 | -0.137 |
| nwe | 2014 | 29.3 | 19.6 | Won | 0.75 | 0.744 | -0.006 |
| sea | 2014 | 24.6 | 15.9 | Lost | 0.75 | 0.752 | 0.002 |
| den | 2013 | 37.9 | 24.9 | Lost | 0.813 | 0.765 | -0.047 |
| sea | 2013 | 26.1 | 14.4 | Won | 0.813 | 0.817 | 0.004 |
| rav | 2012 | 24.9 | 21.5 | Won | 0.625 | 0.594 | -0.031 |
| sfo | 2012 | 24.8 | 17.1 | Lost | 0.719 | 0.722 | 0.004 |
| nyg | 2011 | 24.6 | 25 | Won | 0.563 | 0.49 | -0.073 |
| nwe | 2011 | 32.1 | 21.4 | Lost | 0.813 | 0.75 | -0.062 |
| pit | 2010 | 23.4 | 14.5 | Lost | 0.75 | 0.768 | 0.018 |
| gnb | 2010 | 24.3 | 15 | Won | 0.625 | 0.77 | 0.145 |
| clt | 2009 | 26 | 19.2 | Lost | 0.875 | 0.688 | -0.187 |
| nor | 2009 | 31.9 | 21.3 | Won | 0.813 | 0.749 | -0.064 |
| crd | 2008 | 26.7 | 26.6 | Lost | 0.563 | 0.502 | -0.061 |
| pit | 2008 | 21.7 | 13.9 | Won | 0.75 | 0.747 | -0.003 |
| nwe | 2007 | 36.8 | 17.1 | Lost | 1 | 0.889 | -0.111 |
| nyg | 2007 | 23.3 | 21.9 | Won | 0.625 | 0.539 | -0.086 |
| clt | 2006 | 26.7 | 22.5 | Won | 0.75 | 0.612 | -0.138 |
| chi | 2006 | 26.7 | 15.9 | Lost | 0.813 | 0.79 | -0.023 |
| sea | 2005 | 28.3 | 16.9 | Lost | 0.813 | 0.791 | -0.021 |
| pit | 2005 | 24.3 | 16.1 | Won | 0.688 | 0.739 | 0.051 |
| nwe | 2004 | 27.3 | 16.3 | Won | 0.875 | 0.792 | -0.083 |
| phi | 2004 | 24.1 | 16.3 | Lost | 0.813 | 0.731 | -0.081 |
| nwe | 2003 | 21.8 | 14.9 | Won | 0.875 | 0.719 | -0.156 |
| car | 2003 | 20.3 | 19 | Lost | 0.688 | 0.542 | -0.146 |
| tam | 2002 | 21.6 | 12.3 | Won | 0.75 | 0.798 | 0.048 |
| rai | 2002 | 28.1 | 19 | Lost | 0.688 | 0.737 | 0.05 |
| ram | 2001 | 31.4 | 17.1 | Lost | 0.875 | 0.835 | -0.04 |
| nwe | 2001 | 23.2 | 17 | Won | 0.688 | 0.687 | -0.001 |
| nyg | 2000 | 20.5 | 15.4 | Lost | 0.75 | 0.67 | -0.08 |
| rav | 2000 | 20.8 | 10.3 | Won | 0.75 | 0.841 | 0.091 |
| oti | 1999 | 24.5 | 20.3 | Lost | 0.813 | 0.621 | -0.191 |
| ram | 1999 | 32.9 | 15.1 | Won | 0.813 | 0.886 | 0.074 |
| atl | 1998 | 27.6 | 18.1 | Lost | 0.875 | 0.752 | -0.123 |
| den | 1998 | 31.3 | 19.3 | Won | 0.875 | 0.785 | -0.09 |
| gnb | 1997 | 26.4 | 17.6 | Lost | 0.813 | 0.739 | -0.073 |
| den | 1997 | 29.5 | 17.9 | Won | 0.75 | 0.788 | 0.038 |
| nwe | 1996 | 26.1 | 19.6 | Lost | 0.688 | 0.68 | -0.007 |
| gnb | 1996 | 28.5 | 13.1 | Won | 0.813 | 0.878 | 0.066 |
| pit | 1995 | 25.4 | 20.4 | Lost | 0.688 | 0.639 | -0.048 |
| dal | 1995 | 27.2 | 18.2 | Won | 0.75 | 0.74 | -0.01 |
| sdg | 1994 | 23.8 | 19.1 | Lost | 0.688 | 0.637 | -0.05 |
| sfo | 1994 | 31.6 | 18.5 | Won | 0.813 | 0.806 | -0.006 |
| buf | 1993 | 20.6 | 15.1 | Lost | 0.75 | 0.68 | -0.07 |
| dal | 1993 | 23.5 | 14.3 | Won | 0.75 | 0.775 | 0.025 |
| dal | 1992 | 25.6 | 15.2 | Won | 0.813 | 0.789 | -0.023 |
| buf | 1992 | 23.8 | 17.7 | Lost | 0.688 | 0.681 | -0.007 |
| buf | 1991 | 28.6 | 19.9 | Lost | 0.813 | 0.724 | -0.088 |
| was | 1991 | 30.3 | 14 | Won | 0.875 | 0.881 | 0.006 |
| nyg | 1990 | 20.9 | 13.2 | Won | 0.813 | 0.754 | -0.058 |
| buf | 1990 | 26.8 | 16.4 | Lost | 0.813 | 0.778 | -0.035 |
| sfo | 1989 | 27.6 | 15.8 | Won | 0.875 | 0.808 | -0.067 |
| den | 1989 | 22.6 | 14.1 | Lost | 0.688 | 0.762 | 0.075 |
| cin | 1988 | 28 | 20.6 | Lost | 0.75 | 0.694 | -0.056 |
| sfo | 1988 | 23.1 | 18.4 | Won | 0.625 | 0.641 | 0.016 |
| was | 1987 | 25.3 | 19 | Won | 0.733 | 0.677 | -0.057 |
| den | 1987 | 25.3 | 19.2 | Lost | 0.7 | 0.671 | -0.029 |
| nyg | 1986 | 23.2 | 14.8 | Won | 0.875 | 0.755 | -0.12 |
| den | 1986 | 23.6 | 20.4 | Lost | 0.688 | 0.593 | -0.095 |
| nwe | 1985 | 22.6 | 18.1 | Lost | 0.688 | 0.637 | -0.05 |
| chi | 1985 | 28.5 | 12.4 | Won | 0.938 | 0.893 | -0.045 |
| sfo | 1984 | 29.7 | 14.2 | Won | 0.938 | 0.871 | -0.067 |
| mia | 1984 | 32.1 | 18.6 | Lost | 0.875 | 0.811 | -0.064 |
| was | 1983 | 33.8 | 20.8 | Lost | 0.875 | 0.791 | -0.084 |
| rai | 1983 | 27.6 | 21.1 | Won | 0.75 | 0.671 | -0.079 |
| was | 1982 | 21.1 | 14.2 | Won | 0.889 | 0.724 | -0.164 |
| mia | 1982 | 22 | 14.6 | Lost | 0.778 | 0.735 | -0.043 |
| sfo | 1981 | 22.3 | 15.6 | Won | 0.813 | 0.708 | -0.104 |
| cin | 1981 | 26.3 | 19 | Lost | 0.75 | 0.7 | -0.05 |
| rai | 1980 | 22.8 | 19.1 | Won | 0.688 | 0.609 | -0.078 |
| phi | 1980 | 24 | 13.9 | Lost | 0.75 | 0.796 | 0.046 |
| ram | 1979 | 20.2 | 19.3 | Lost | 0.563 | 0.528 | -0.035 |
| pit | 1979 | 26 | 16.4 | Won | 0.75 | 0.766 | 0.016 |
| pit | 1978 | 22.3 | 12.2 | Won | 0.875 | 0.812 | -0.063 |
| dal | 1978 | 24 | 13 | Lost | 0.75 | 0.82 | 0.07 |
| dal | 1977 | 24.6 | 15.1 | Won | 0.857 | 0.773 | -0.084 |
| den | 1977 | 19.6 | 10.6 | Lost | 0.857 | 0.81 | -0.047 |
| rai | 1976 | 25 | 16.9 | Won | 0.929 | 0.73 | -0.198 |
| min | 1976 | 21.8 | 12.6 | Lost | 0.821 | 0.792 | -0.03 |
| dal | 1975 | 25 | 19.1 | Lost | 0.714 | 0.666 | -0.048 |
| pit | 1975 | 26.6 | 11.6 | Won | 0.857 | 0.889 | 0.032 |
| pit | 1974 | 21.8 | 13.5 | Won | 0.75 | 0.763 | 0.013 |
| min | 1974 | 22.1 | 13.9 | Lost | 0.714 | 0.758 | 0.043 |
| min | 1973 | 21.1 | 12 | Lost | 0.857 | 0.796 | -0.061 |
| mia | 1973 | 24.5 | 10.7 | Won | 0.857 | 0.883 | 0.026 |
| mia | 1972 | 27.5 | 12.2 | Won | 1 | 0.885 | -0.115 |
| was | 1972 | 24 | 15.6 | Lost | 0.786 | 0.748 | -0.038 |
| dal | 1971 | 29 | 15.9 | Won | 0.786 | 0.828 | 0.042 |
| mia | 1971 | 22.5 | 12.4 | Lost | 0.75 | 0.81 | 0.06 |
| clt | 1970 | 22.9 | 16.7 | Won | 0.821 | 0.689 | -0.132 |
| dal | 1970 | 21.4 | 15.8 | Lost | 0.714 | 0.679 | -0.035 |
| kan | 1969 | 25.6 | 12.6 | Won | 0.786 | 0.854 | 0.068 |
| min | 1969 | 27.1 | 9.5 | Lost | 0.857 | 0.93 | 0.073 |
| nyj | 1968 | 29.9 | 20 | Won | 0.786 | 0.746 | -0.04 |
| clt | 1968 | 28.7 | 10.3 | Lost | 0.929 | 0.929 | 0.001 |
| rai | 1967 | 33.4 | 16.6 | Lost | 0.929 | 0.866 | -0.063 |
| gnb | 1967 | 23.7 | 14.9 | Won | 0.679 | 0.761 | 0.082 |
| kan | 1966 | 32 | 19.7 | Lost | 0.821 | 0.787 | -0.035 |
| gnb | 1966 | 23.9 | 11.6 | Won | 0.857 | 0.854 | -0.003 |
What stands out to you?