
It has now been seven years since I created the Football Perspective Draft Value Chart (longtime readers know that at Pro-Football-Reference, I created something similar 11 years ago).
You can see all the values for the Football Perspective Draft Value Chart here and there’s a link on the home page to those same values embedded in the FP Draft Value Calculator. The FP chart was derived from analyzing drafts from 1970 to 2007, and by looking at the marginal Approximate Value produced by players in each of their first five seasons. In short, I gave players credit for all AV produced above 2 points of AV each year. If a player had AV scores of 0, 4, 1, 7, and 10, that translates to 15 marginal points. To create the Draft Value Chart, I simply calculated the average number of marginal points produced by each draft pick from ’70 to ’07 and smoothed out the results.
But now, with 7 more years of data, we can look at the drafts from 2008 through 2014, and see how those players have faced in their first 5 seasons. How has the FP Chart done since then?
When analyzing results over a small period, there will obviously be outliers. One out of every 7 players taken with the 75th pick doesn’t turn into Russell Wilson, one out of every 7 players taken with the 154th pick doesn’t turn into Richard Sherman, and so on. The 92nd pick, with T.Y. Hilton, Trai Turner, Cliff Avril, Joe Barksdale, Shawn Lauvao, and Jerraud Powers was extremely good at getting consistent starters (Stedman Bailey being the exception).
And even the number one picks have been very good over this stint: Jake Long, Matthew Stafford, Sam Bradford, Cam Newton, Andrew Luck, Eric Fisher, and Jadeveon Clowney is a pretty good stretch; JaMarcus Russell just missed the cut. Here are the average results from these 7 drafts in terms of marginal AV produced by these players in their first five years:

Now, how does that compare to the Football Perspective Drat Values? And what would the results from ’08 to ’14 look like if we smoothed the results? I’m glad you asked! I’ve reprinted the results below, but added the FP Draft Value Chart line in red, and a smoothed, best-fit line of the ’08 to ’14 results in blue.
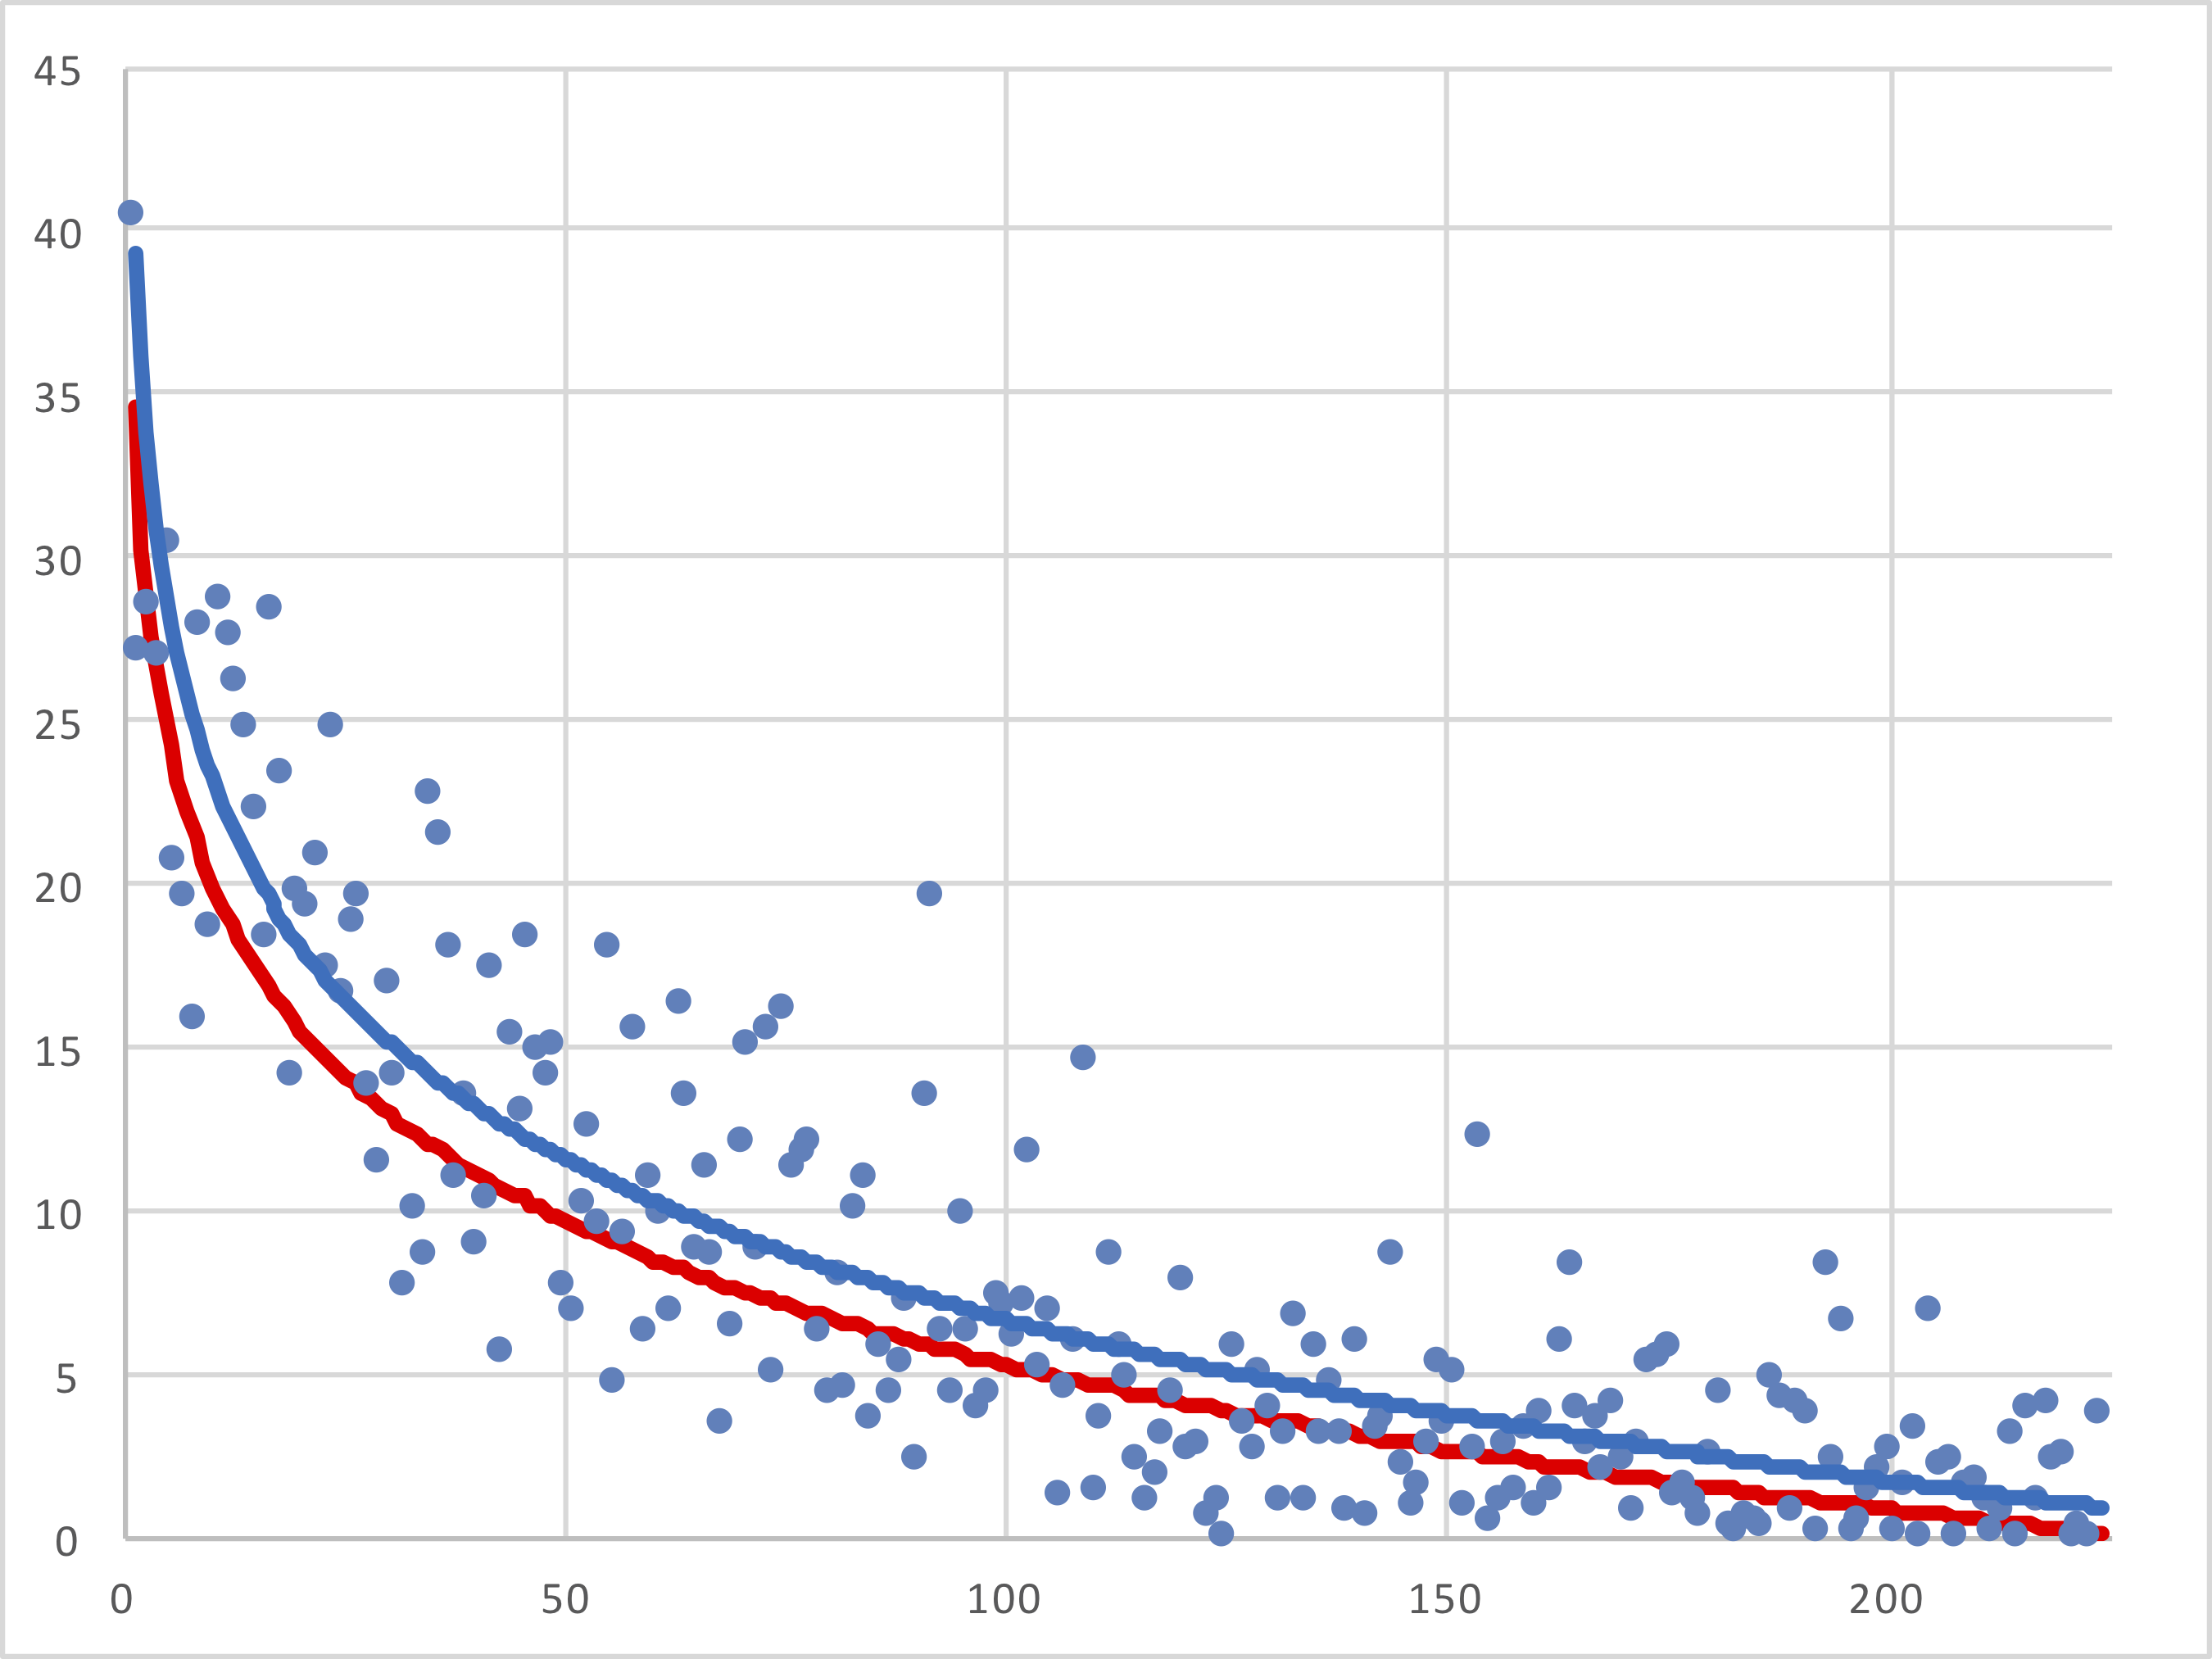
On first glance, I have two immediate takeaways.
One, the FP Draft Value Chart looks pretty good: it’s directionally correct, and holds up over time and a small sample. It doesn’t have the super steep decline of the JJ Draft Value Chart, which has the 3rd pick worth twice as much as the 11th pick, and the 11th pick worth twice as much as 35th pick.
The other takeaway is that almost all the picks are more valuable, and that is not a function of small sample size: it’s a function of the rookie wage scale. Players taken in the 3rd, 4th, and 5th rounds are now expected to contribute, because the bar has been lower. If a 4th round pick costs a fraction of what a veteran costs, teams will be more willing to give that player a chance to produce even if he isn’t very good. This artificially inflates AV, since AV is tied to metrics like starts and games played. Teams are giving more starts and snaps to players on rookie contracts because of the rookie salary cap, and that leads to more AV — and distorts the draft value chart a bit.
My overall suspicion is the success of first overall picks from ’08 to ’14 distorts the steepness of the graph — it doesn’t appear like the 2nd and 3rd picks are doing any better than they used to — and that is likely due to small sample size (although the first overall picks since ’14 also seem pretty good so far, too!). And on a relative basis, I am not sure much has changed in the draft value chart world. But I do think it’s fair to acknowledge that draft picks are more valuable than they used to be and my Draft Value Chart implies, and that’s worth thinking about when teams trade multiple picks for one pick.
As always, please leave your thoughts in the comments.