
Four years ago, I wrote an article about the — at the time — young and improving Seattle pass defense. It’s hard to compare modern defenses to what we saw in the ’70s, as the game has changed significantly in the favor of more impressive passing numbers.
But what we can do is compare each pass defense in each season to each other pass defense. In 2013, the Seahawks allowed 3.19 Adjusted Net Yards per Attempt, while the league average was 5.98. That’s a difference of 2.79 ANY/A, and the standard deviation among the 32 pass defenses was 0.95 ANY/A. In other words, the Seahawks were 2.93 standard deviations better than average (2.79 divided by 0.95).
This year, the Jaguars are allowing 3.52 ANY/A, and the league average is an almost identical 6.01. So Jacksonville is 2.49 ANY/A better than average, and given the standard deviation of 0.94, it means the Jaguars pass defense has a Z-Score of 2.65.
That would rank as the 6th best since 1950, behind the ’02 Bucs, ’88 Vikings, ’70 VIkings, ’13 Seahawks, and ’82 Dolphins. The 3.52 ANY/A average is the lowest since the 2013 Seahawks, and the second lowest since the 2009 Jets (who played in a less friendly passing environment; the league average was 5.74 ANY/A).
If you look at the NFL passing statistics through 13 games (well, 12 for the Dolphins and Patriots), it’s easy to see why the Jaguars pass defense is so good. It’s because they’re great at literally everything. The table below shows the team’s rank in every major category: top-5 finishes are in pink, and #1 finishes are in red with white font.
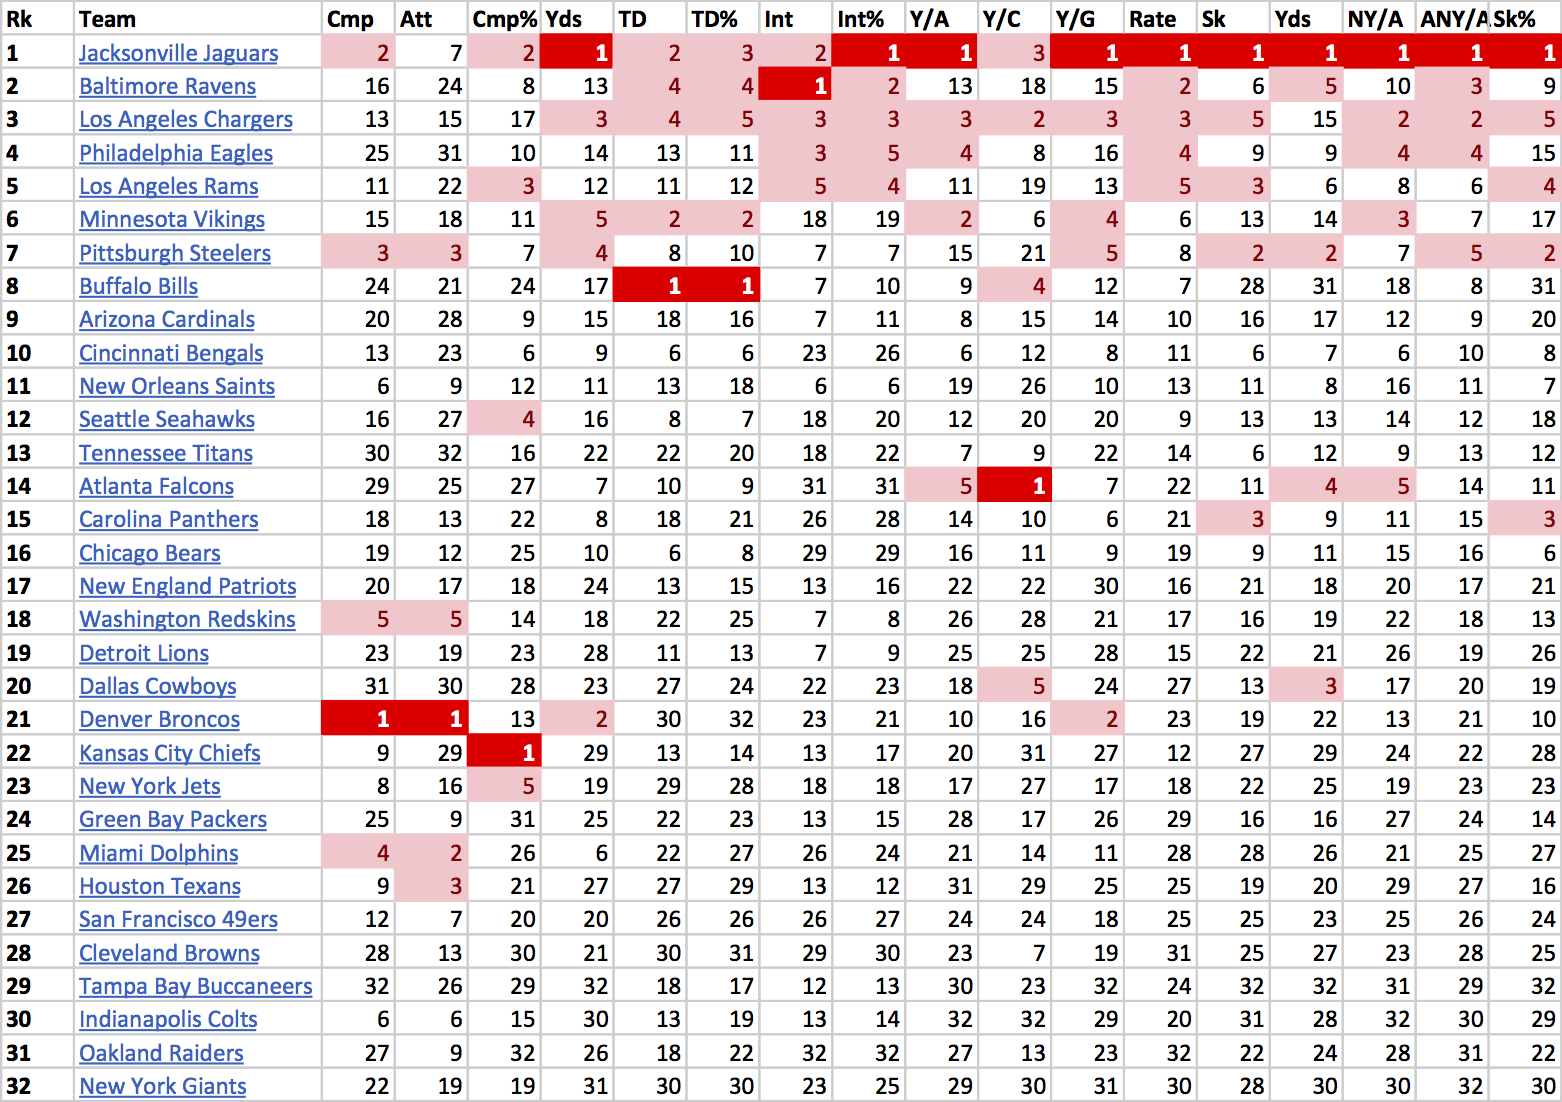
Jacksonville has a great pass rush: the defense ranks 1st in sacks, sack yards, and sack rate, with the Steelers second in all three categories. Jacksonville leads 47-41, 305-294, and 9.9% to 9.0%. The Jaguars have the best sack rate in the NFL since the 2008 Cowboys.
But when the Jaguars aren’t getting to the quarterback, they’re still doing really well. Jacksonville ranks in the top three in both completion percentage and yards per completion, two metrics that often have inverse relationships. The Chiefs rank 1st in completion percentage but 31st in yards per completion; the Rams are 3rd in completion percentage and 19th in yards per completion. The Chargers are 2nd in yards per completion but 17th in completion percentage. And the Falcons are 1st in yards per completion but 27th in completion percentage. Opposing offenses usually pick one method of moving the ball down the field (lots of short passes) or another (hitting on a number of big gains). It’s rare for a defense to stop both, but that’s what the Jaguars have done. The Eagles are the only other defense to rank in the top 10 in both categories (8th in completion percentage, 10th in yards per completion), making Jacksonville’s top-3 rankings even more remarkable.
By being so good at stopping passes from being completed and at stopping completed passes for going for big gains, of course the Jaguars are first in the product of those two metrics: yards per attempt. And given the team’s prowess at rushing the passer, the Jaguars are 0.7 net yards per attempt better than the next best team, San Diego (4.78 to 5.48).
And on top of that, the Jaguars rank 1st in passing yards, 2nd in passing touchdowns, and 2nd in interceptions. Add it all up, and the Jaguars lead the league by a mile in ANY/A. Jacksonville is at 3.52 ANY/A, over a full yard better than the 2nd-place Chargers (4.56).