
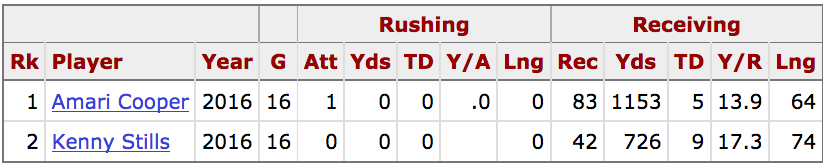
We know that Amari Cooper is a better receiver than Kenny Stills, but who is the better big play threat? Or, more specifically, who was the better big play threat last year?
To answer this question, most people would focus on one metric: yards per reception. Most people are wrong.
Yards per reception is another one of those metrics — like yards per rush — that sounds more meaningful than it is. There are many reasons for this, [1]It is important to note that putting receptions in the denominator is probably not the right way to measure big play ability. Some would argue instead to put targets in the denominator, or perhaps … Continue reading but let’s focus on two of the big reasons today. To begin, consider two hypothetical receivers who are thrown 10 passes, one each at 5 yards, 10 yards, 15 yards, etc. The receiver either makes the catch or does not, and gains zero yards after the catch.
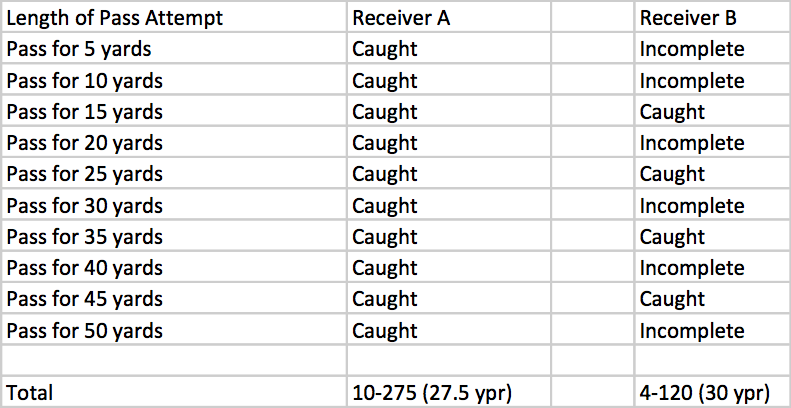
Receiver A caught every pass thrown to him, and averaged 27.5 yards per catch. Receiver B, had he caught every pass thrown to him, would have averaged 27.5 yards per catch, too. Instead, though, he didn’t catch some of the easy ones, and the lack of short catches inflated his yards per reception average to an even 30.
Now, does that make Receiver B better at making big plays? Of course not! Receiver A is “penalized” in this metric because he replaced some zero catch for zero yard plays with some one catch for “less than 30 yard” plays. The fact that Receiver A made those catches doesn’t make him worse at making big plays than Receiver B — it just makes him better at making smaller plays. And that’s a pretty big distinction.
Takeaway #1: when analyzing yards per reception, don’t forget that it treats a dropped pass as better than a catch that goes for 5 yards.
When comparing Stills to Cooper, that’s important to keep in mind, given that Cooper nearly doubled him in receptions. There are probably some short passes that a better receiver than Stills would have made, lowering his average gain. But even ignoring the catches that aren’t made, there are two other reasons that yards per reception is misleading.
Last year, Cooper had 21 catches that went for at least 20+ yards. Stills had just 10. If you look at yards per reception, you wouldn’t know that Cooper was easily the bigger producer of big plays. But even if you analyze big play ability on a per-catch basis, Cooper still wins, as 25% of his receptions went for 20+ yards, compared to just 24% for Stills.
So why does Stills have the big edge in yards per reception? Stills had three big receptions (for 52, 66, and 74 yards), and since yards per reception is sensitive to outliers, Stills gets a big boost.
Takeaway #2: Yards per reception is very sensitive to outliers. A receiver with 50 catches for 800 yards averages 16 yards per catch. If he makes a 40-yard gain, that jumps to 16.5 Y/R, but if it’s an 80-yard gain, it jumps to 17.3. In other words, an 80-yard gain causes his to increase by 2.67 times as much as a 40-yard gain.
Take a look at the length of each reception for Cooper last year, and you can see how Stills had a few really big plays, but Cooper had a lot of big plays:

And for Stills:

Let’s break it down even more:
- 28% of Cooper’s receptions went for 5 or fewer yards, compared to 14% for Stills.
- 49% of Cooper’s receptions went for 10 or fewer yards, compared to 39% for Stills.
- 65% of Cooper’s receptions went for 15 or fewer yards, compared to…67% for Stills.
- 75% of Cooper’s receptions went for 19 or fewer yards, compared to 76% for Stills.
- 12% of Cooper’s receptions went for 30+ yards, compared to 12% of Stills
Stills’ long receptions did go for longer (Cooper’s top three receptions went for 37, 43, and 64 yards), but the real difference is in the short passes. Cooper caught 23 passes that gained 5 or fewer yards, and they went for only 67 yards. Meanwhile, Stills caught just 6 passes of such length, gaining 20 yards. On the surface, Cooper’s 13.9 yards/reception average is “less impressive” than Stills’ 17.3 average. But remove all the passes that went for 5 or fewer yards, and those numbers move to 18.1 and 19.6, respectively. Remove all the passes that went for 10 or fewer yard, and those averages jump to 22.3 and 24.3, respectively. Because yards per reception is so sensitive to big plays, Stills will have the advantage even if we remove the short passes, but yards per reception totally obscures the fact that Cooper gained 20+ yards not just twice as often, but even more frequently on a per reception basis.
If you want to argue that Stills was a better big play threat based on his percentage of 50+ yard plays, that makes sense. But Cooper made a ton of short catches, had more catches of 20+ yards than Stills, and had a larger percentage of his catches go for 20+ yards. Yards per reception works some of the time in identifying big play threats, but it’s important to remember where it goes wrong.
References
| ↑1 | It is important to note that putting receptions in the denominator is probably not the right way to measure big play ability. Some would argue instead to put targets in the denominator, or perhaps routes run or even just snaps. Such analysis, while correct, is outside the scope of today’s post. Yards per reception is still bad. |
|---|