
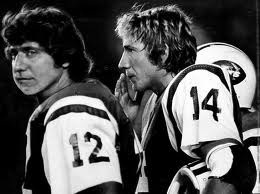
A pair of Crimson Tide/Jets quarterbacks in 1976
The duo even looked similar, shaggy hair and all, and you can forgive Jets fans for hoping that another Hall of Fame quarterback had come to them out of Tuscaloosa. Todd failed to meet those lofty expectations, of course, but he did lead the NFL in yards per pass attempt in 1979. Three years later, in the strike-shortened 1982 season, a 29-year-old Todd started every game for the Jets and posted the following stat line:
| Year | QBrec | Cmp | Att | Cmp% | Yds | TD | TD% | Int | Int% | Y/A | Y/C | Y/G | Rate | Sk | Yds | NY/A | ANY/A | Sk% | 4QC | GWD |
|---|---|---|---|---|---|---|---|---|---|---|---|---|---|---|---|---|---|---|---|---|
| 1982 | 6-3-0 | 153 | 261 | 58.6 | 1961 | 14 | 5.4 | 8 | 3.1 | 7.5 | 12.8 | 217.9 | 87.3 | 23 | 206 | 6.18 | 5.90 | 8.1 | 1 | 1 |
Does that stand out to you as particularly impressive? It may not against our modern eyes, but what about that 14:8 touchdown to interception rate? Okay, maybe a 1.75 TD/INT ratio doesn’t scream superstar to you. After all, of the 35 quarterbacks last year to qualify for the league passing crown, 22 of them had a better TD/INT Ratio than 1.75. Heck, Josh McCown (3.00) and Brian Hoyer (2.71) eclipsed those numbers with ease.
But here’s the thing: in 1982, Todd led the NFL in touchdown/interception ratio. Yes, a 1.75 TD/INT Ratio doesn’t sound good, but it was outstanding for his era. But things change quickly, and Todd is the last — and will surely remain the last — quarterback to lead the NFL in TD/INT Ratio with a sub-2.00 rate. When Ryan Fitzpatrick (31/15) or Ryan Tannehill (24/12) throw twice as many touchdowns as interceptions, it sounds good, but it really isn’t. It’s just average now. And given the randomness of interceptions, a few bad bounces can really torpedo a quarterback’s ratio given the rising tides at play.
The graph below shows the league-average TD/INT Ratio for every season since 1932. This one speaks for itself:

TD/INT Ratio likely emerged as a “key” quarterback statistic because passer rating is incredibly complicated and silly, while passing yards are simple to understand but have almost no correlation to success. TD/INT Ratio suffers from some of the same flaws as passer rating in that the correlation to winning is tricky — trailing quarterbacks tend to throw interceptions, so the causation arrow runs both ways — but that makes nice antidotes to pure passing yards (if you want a high correlation to winning) and passer rating (if you value simplicity).
Consider this: just ten quarterbacks in NFL history have a career TD/INT ratio better than the 2015 league average! Those quarterbacks are Aaron Rodgers, Russell Wilson, Tom Brady, Steve Young, Peyton Manning, Tony Romo, Drew Brees, Philip Rivers, Donovan McNabb, and Joe Montana. You may notice that other than Young, the top 8 players in this category were active last season. McNabb was at exactly 2.00 when he retired.
But then think about Montana. He retired with the best TD/INT Ratio in NFL history, courtesy of 273 touchdowns and 139 interceptions. That’s a 1.96 ratio. Yet, given the recent trend lines, that will likely slow in as below-average in 2016. If that’s not a good enough reason to look at all TD/INT Ratios with a skeptical eye, then this is the wrong site for you.