
There have been 52 Super Bowl games played so far, but they have featured just 17 upsets. But a Super Bowl upset was once extremely rare. The Jets and Chiefs produced the first two Super Bowl upsets, in Super Bowls III and IV, respectively. But then there wasn’t a single Super Bowl upset during the decade of the 1970s! (Excluding, of course, Super Bowl IV, which concluded the 1969 season but took place on January 11th, 1970).
In the 1980s, there were 4 Super Bowl upsets, all featuring the Raiders or the Redskins (or both). Oakland beat Philadelphia in 1980, Washington beat Miami in 1982, the Raiders beat the Redskins in ’83, and the Redskins upset the Broncos in ’87. All featured point spreads of 3.5 or fewer points, in contrast to the two double digit upsets from the AFL teams.
In the ’90s, there were just TWO upsets in the Super Bowl: the Giants over the Bills and the Broncos over the Packers. When Tom Brady and the Patriots took the field as underdogs in Super Bowl XXXVI, but 8 of the first 35 Super Bowls had featured upsets. But beginning with that first Patriots/Rams Super Bowls, there have been a whopping 9 upsets in 17 games (and the denominator is really 16 here, since one Super Bowl had an even point spread and therefore couldn’t feature an upset)! In other words, we’ve gone from an upset happening less than 25% of the time to an upset happening over 50% of the time.
Beginning with the first Patriots Super Bowl, and excluding the New England/Seattle Super Bowl (which featured the even points spread), there have been 16 Super Bowls with a favorite during the Brady/Belichick era. Of those 16 Super Bowls, the favorites have lost 9 times, and failed to cover in 3 of the 7 times that they actually won! There have been just 6 times in Super Bowl history that the favorite won but failed to cover the point spread, so that means half have occurred in relatively recent history.
From 1966 to 2000, favorites went 22-11-2 against the spread during the first 35 Super Bowls. In the 16 Super Bowls since 2001 to feature a favorite, those favorites have gone just 4-12 against the spread. The graph below shows the point spread (in red) and margin of victory (in blue) for the Super Bowl winner in each game. The point spread is shown as an expectation of how much the winner was expected to win by (so the Jets in Super Bowl 3, rather than shown as +18, are shown as -18). All Super Bowl upsets feature red bars that are negative.
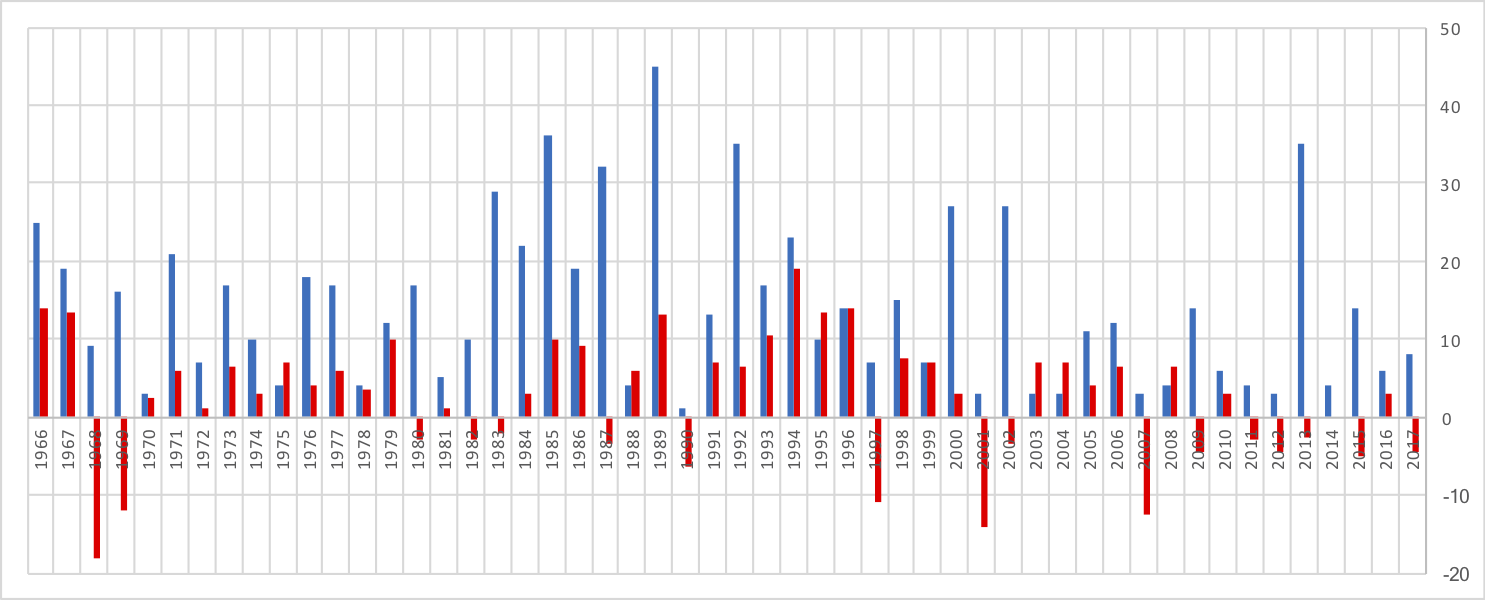
What stands out to you?