≡ Menu

Oklahoma tries, fails to stop Tavon Austin

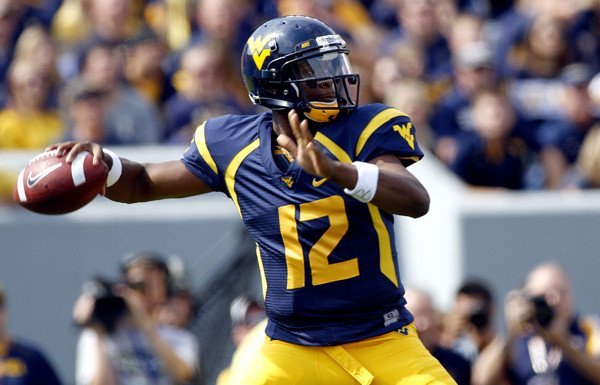
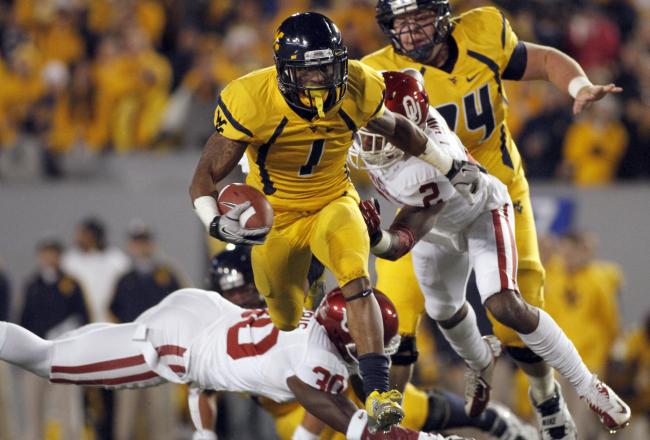
Oklahoma tries, fails to stop Tavon Austin.

It’s become trendy in recent weeks to discuss how players like Tavon Austin are “changing the game,” after the success of multi-dimensional athletes like Percy Harvin, Darren Sproles, Randall Cobb, and Aaron Hernandez. Many football analysts have described these players as the next phase in the evolution of the game; for example, here’s what Greg Cosell wrote earlier this week:

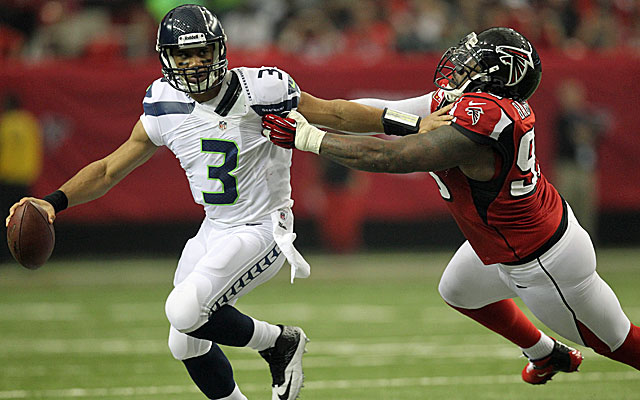
I wrote about the Seattle Seahawks a number of weeks ago, specifically relating to the trade for Percy Harvin. I made the point that Seattle did not acquire Harvin solely to line him up at wide receiver. He will be so much more than that. He will align everywhere in the formation, the ultimate chess piece that can attack from anywhere on the board. Just like Cobb in Green Bay and Hernandez in New England. This is the light bulb moment. That’s exactly what Austin should be in the NFL. Those who see him solely as a slot receiver are stuck in conventional thinking, and missing the larger, more expansive point. Austin is not a static, inert player. He’s a movement player, a peripatetic ball of energy that creates all kinds of matchup issues for defenses.

I believe Austin, Hernandez, Cobb and Harvin are representative of where NFL teams would like to go with their personnel, and their passing concepts. The objective is to have five receivers, and certainly four, who can align all over the formation. Traditionally, they can be wide receivers, tight ends or running backs. It can be the Patriots with their “12” personnel. Or the Packers, with their four-wide receiver personnel. From a schematic perspective, it doesn’t matter how you define them by position. The overriding, and superseding point is that they are all movable chess pieces, all “Jokers”, to use the term that I’ve used before and I think is aptly descriptive. That’s the “Cosell Doctrine”, and that’s the direction I see the NFL game trending. It’s about passing, and how you can create, and ultimately dictate favorable matchups. You do that with players that are amorphous and fluid in their ability to be utilized in ways both multiple and expansive, yet somewhat unstructured based on conventional definitions.

[continue reading…]

{ 4 comments }

A poor man's Matt Stafford?

Tyler Bray is this year's youngest quarterback prospect.

For the most part, age is rarely discussed when talking about college quarterbacks. Outside of the Brandon Weedens and Chris Weinkes of the world, you generally don’t hear much from the draft community about the age of a prospect. But we do know that age matters, and that all other things being equal, being younger is better (or a sign that the player has a higher ceiling).

In this year’s draft, Tyler Bray is the neophyte, as he’ll be 21 years and 8 months old at the start of the season. He’s just weeks older than Matt Stafford and Josh Freeman were this time four years ago. It also means he’s 10 months younger than Geno Smith, the second youngest of the top prospects. On the other hand, Tyler Wilson will be 24 when the season starters, Landry Jones just turned 24, and Jordan “did you know Aaron is my brother” Rodgers will be 25 on August 30th. Do NFL teams generally ignore age — i.e., fail to measure younger quarterbacks against a lower bar? Or perhaps do they overemphasize age, thinking a young player has such high upside and can be taught anything that they ignore red flags? That’s what this post seeks to answer.
[continue reading…]

{ 7 comments }

In Part I, I derived a formula to translate the number of marginal wins a veteran player was worth into marginal salary cap dollars (my answer was $14.6M, but the Salary Cap Calculator lets you answer that question on your own terms). We can also translate Approximate Value into wins using a similar method.

Each NFL team generates about 201 points of Approximate Value per season, or 6,440 points of AV per season in the 32-team era. I ran a linear regression using team AV as the input and wins as the output, which produced a formula of

Team Wins = -9.63 + 0.0876*AV

This means that adding one point of AV to a team is expected to result in 0.0876 additional wins. In other words, for a 201-AV team to jump from 8 to 9 wins, they need to produce 11.4 additional points of AV.

A player who can deliver 11.4 marginal points of AV is therefore worth one win to a team, or 14.6 million marginal salary cap dollars (or whatever number you choose). Alternatively, you can think of it like this: a player who is worth $1.277M marginal dollars should be expected to produce 1 additional point of AV and 0.0876 additional wins. In case the math made you lose the forest for the trees, this is all a reflection of the amount of wins we decide the replacement team is worth, as the formula is circular: if a team spends all of its $72.877M marginal dollars, they should get 57.07 marginal points of AV, or 5 extra wins, the amount needed to make a replacement team equal to an average team.

[continue reading…]

{ 14 comments }

On Friday, I looked at the career leaders in 4th quarter (and overtime) game-winning touchdowns from scrimmage. Yesterday I presented the all-time leaders in passing touchdowns. Today we give field goal kickers some love using the same criteria.
[continue reading…]

{ 1 comment }

Still the king

Still the king.

Yesterday, I looked at the career leaders in 4th quarter (and overtime) game-winning touchdowns from scrimmage. Today I will do the same thing for passing touchdowns.

As a reminder: tracking things like game-winning touchdowns is only interesting in a trivial sort way. I looked at all games, regular and postseason, in all leagues, from 1940 to 2012, and counted all touchdowns scored that put the player’s team ahead for good (with one exception: I did not count touchdowns scored when down by 7 and the team successfully went for two afterwards). The table below shows all players with at least 4 such game-winning touchdown passes. It won’t do much to settle the Brady/Manning debate.
[continue reading…]

{ 2 comments }

Five years ago, Doug wrote an interesting post about game-winning touchdowns. Let’s be clear: tracking things like game-winning touchdowns is only interesting in a trivial sort way, but hey, it’s April.

Football doesn’t have a statistic like “game-winning RBIs” the way baseball does, although my friend Scott Kacsmar has been doing a great job tracking 4th quarter comebacks and game-winning drives for quarterbacks. I was wondering which players have scored the most game-winning touchdowns in the 4th quarter or overtime, and fortunately I have the data to answer that pretty easily. I looked at all games, regular and postseason, in all leagues, from 1940 to 2012, and counted all touchdowns scored that put the player’s team ahead for good (with one exception: I did not count touchdowns scored when down by 7 and the team successfully went for two afterwards).

The table below lists all players with at least five such touchdowns and the teams for which they scored those touchdowns.

[continue reading…]

{ 7 comments }

It’s been awhile since I’ve updated things on my team in the RSP Writers Project, so this post will explain what I was thinking on the six players I selected in rounds six through eleven.

Rounds 6/7

Already on team: QB Josh Freeman, WR Julio Jones, WR Brandon Marshall, LT D’Brickashaw Ferguson, 3-4 OLB/4-3 DE Paul Kruger
[continue reading…]

{ 1 comment }

D’Brickashaw Ferguson and how tackles age

A few weeks ago, I discussed why I selected D’Brickashaw Ferguson as my left tackle in the RSP Writer’s Project. In the comments to that post, mrh argued that tackles generally don’t age that well, a proposition I never really considered before. I have previously discussed quarterback age curves and examined running back aging patterns last summer, so I’ve decided to take a closer look at offensive tackles.

First, I grouped together all tackles who entered the league since 1970 and recorded at least four seasons with an Approximate Value of at least 8 points (Ferguson has three seasons with an AV of 8 and two more with an AV of 9). That gave me a group of 78 tackles who were above-average players in their prime. As it turns out, they didn’t age very well as a group, and the results probably underestimate the true effects of age.

As I’ve discussed before, there are two ways to measure group production over a number of a seasons. In the graph below, the red line shows the aging patterns of top tackles when you divide their total AV accumulated by tackles at that age by 78; the blue line shows the age curves when you divide the total AV accumulated only by those tackles active in the NFL at that age.
[continue reading…]

{ 2 comments }

Here’s the introduction to an old fantasy football article by my fellow Footballguys staffer Maurile Tremblay:

In most fantasy football leagues, eligible players are divided into 6 different positions: quarterback, running back, wide receiver, tight end, placekicker, and special teams/defense. Imagine a league that includes a seventh position, team captain, which earns points each week based solely on the initial coin toss. For example, if you’ve got the Raiders as your starting TC and the Raiders win their coin toss, you get 30 points; if the Raiders lose their coin toss, you get nothing.

Under the current laws of probability, we can expect any particular team captain to win about 8 out of its 16 coin tosses over the course of the season, winding up with about 240 total fantasy points — so let’s use that as our VBD baseline. There will probably be one or two team captains, however, that win around 12 tosses, making them about 120 points better than average. That makes the top team captain pretty valuable!

So how long should we wait before drafting our TC1? Is the first round too early? The second?

Of course, anything before the final round is too early! Coin flips are random, so while some TCs will end up scoring many more points than others over the course of the season, there’s no way to know which ones. We should therefore be totally indifferent to which TC we end up with.

That’s not the case with, say, running backs. We may be fairly confident that Eddie George will score more points than Tim Biakabutuka. So while we have no good reason to prefer the Raiders’ team captain to the Chiefs’, we should quite rationally prefer George to Biak. And as it makes sense to spend our early draft choices filling positions where our preferences are strongest — indeed, that is the essence of VBD — we ought to generally draft our RBs before we draft our TCs.
[continue reading…]

{ 5 comments }

Forgotten Stars: Hugh Taylor

Bones stretches for a touchdown

Bones stretches for a touchdown.

Only three players in NFL history have been responsible for half of their team’s receiving touchdowns over a six-year period: Don Hutson, Jerry Rice, and Hugh Taylor. You probably don’t know much about Taylor, the Washington Redskins star receiver who played from 1947 to 1954. In his first game in the NFL, he caught 8 passes for 212 yards and 3 touchdowns, giving him the record for receiving yards in a player’s first game that stood until 2003.  In his last game, he caught five passes for 106 yards and three touchdowns.  In between those games, he was a star receiver on one of the worst teams in the NFL.  Despite the short career, Taylor came in at #63 on my list of the best receivers of all time. His most impressive season came in 1952, when he was responsible for 45% of the Redskins’ receiving yards and produced the 52nd-best season ever by a wide receiver.

At 6’4, Taylor was one of the tallest receivers of his era, but at only 194 pounds, he was also very deserving of his nickname: Bones. Taylor made up for his skinny physique with a long stride that enabled him to get behind defenders.  I spoke with T.J. Troup, an NFL historian who has coached wide receivers at the college and high school levels, for his thoughts on Taylor. Troup owns a significant amount of NFL film from the late ’40s and ’50s, making him the perfect source for this subject.  He described Taylor to me as one of the best home-run threats of his day, with a playing style similar to other long-striders like Harlon Hill, Don Maynard, and Lance Alworth. The numbers certainly back that up.

The table below shows all receivers who were responsible for at least 39% of a team’s receiving touchdowns over a six-year period.  Note that several receivers would show up multiple times on this list, so for players like Hutson, I’ve limited them to their single best six-year stretch. Taylor’s stretch from ’49 to ’54 ranks second on the list:

[continue reading…]

{ 9 comments }

From the gut: My thoughts on AFC teams

Yesterday, I talked about how optimistic I was about nearly every team in the NFC. On the other hand, most of the teams in the AFC are rebuilding, whether they know it or not. In fact, figuring out which team is the 3rd best team in the conference is much more challenging than it should be. Let’s break the AFC into tiers.

The “Going to Meet in the AFC Championship Game” Tier

Denver Broncos
New England Patriots

This picture will never get old

This picture will never get old.

The big story last offseason was Peyton Manning signing with the Denver Broncos. This year, stealing Wes Welker from the Patriots may prove just as important. For New England, the key to their success is keeping Rob Gronkowski, Aaron Hernandez, and Danny Amendola healthy, although the Patriots will be fine as long as two of them are on the field. We’re months away from the season, but for now, New England’s depth chart at wide receiver is downright scary. Meanwhile, the Broncos boast perhaps the best trio in the league with Demaryius Thomas, Eric Decker, and Welker; even if you say Manning and Tom Brady cancel each other out, Denver should still have the better passing game (and Jacob Tamme did a fine Dallas Clark impression last year). On defense, the Patriots continue to cross their fingers and pray, instead of signing players like Nnamdi Asomugha and John Abraham. Von Miller and the Broncos defense were strong last year, and another easy schedule (NFC East, AFC South) should help the team win 12 or 13 games. As usual, the Patriots won’t be far behind, and if they can beat Denver in the regular season matchup in Foxboro, they can steal the 1 seed.
[continue reading…]

{ 2 comments }

From the gut: My thoughts on NFC teams

It’s April, so most of these points will probably look silly in 9 months, but the NFC should be the class of the NFL in 2013. I think you can make a convincing case for practically every team in the NFC as a possible playoff contender, which means a lot of coaches in that conference are going to be wondering what went wrong by December. Here’s my quick thoughts on each team:

San Francisco 49ers – returning NFC Champions lost Dashon Goldson, Isaac Sopoaga, and Delanie Walker, but added Anquan Boldin, Nnamdi Asomugha, Glenn Dorsey, and Phil Dawson. With Colin Kaepernick entering his second season as starter and a roster full of first round talent, it’s hard to imagine anything shy of another double-digit win season and a Super Bowl run for the 49ers. And they have 13 picks in April’s draft. I still see them as having a chance to become this generation’s version of the Lombardi Packers.

Wilson's arms are too short to stiff-arm opponents.

Wilson's arms are too short to stiff-arm opponents.

Seattle Seahawks – maybe the best team in the NFL by the end of last year, the Seahawks solved their two biggest problems in the first week of free agency. The Percy Harvin trade adds another dimension to one of the toughest offenses in the NFL to stop, while signing Cliff Avril and Michael Bennett significantly improves the pass rush. Seattle could challenge for the league lead in sacks. Having Bruce Irvin, Avril, and Bennett on the field on third downs — especially at CenturyLink Field — will be a nightmare for opposing offenses.

St. Louis Rams – the Rams went 4-1-1 in the division last year and Jeff Fisher did a fantastic job turning the culture around. There were some significant losses in the offseason — Steven Jackson, Danny Amendola, Bradley Fletcher and Brandon Gibson — but the two biggest moves were paying for Jake Long and Jared Cook. St. Louis has the 16th, 22nd, and 46th picks in the draft, so they should be better in a month. They have a brutal division, but it’s clear that they’re moving in the right direction. You could argue that three of the five best coaches in the NFL are in the NFC West, and that doesn’t include the reigning Coach of the Year.
[continue reading…]

{ 2 comments }

More division wins than non-division wins

The Rams finished with the best division record in the NFC West last year at 4-1-1, but St. Louis went only 3-7 in games against non-NFC West opponents. The Jaguars were 0-10 in non-division games last season, but beat both the Colts and Titans to finish 2-4 against the AFC South. Since the merger, three teams have won six more games against division rivals than against non-division opponents. Two of those teams did so in 1998, when the Cowboys went 10-6 thanks to a 8-0 record against the NFC East and a 2-6 mark against the rest of the league (in the playoffs that year, Dallas lost to an NFC East team, a choke that was presumably not Tony Romo’s fault). Over in the AFC, the Titans finished 7-1 against the AFC Central and 1-7 against the rest of the NFL. Technically, the ’82 Dolphins went 7-1 against the AFC East and 0-1 against Tampa Bay during the strike-shortened season, so they fit the criteria, too.

In the new eight-division, four-teams-per-division format, each team plays six games against division opponents and 10 games against non-division opponents. The table below shows all teams since 2002 that won more at least 1.5 more games against division rivals than non-division opponents:
[continue reading…]

{ 0 comments }

Yet another draft value chart

Last November, I provided an updated version of my own draft value chart where I measured the value provided by each draft pick to his Approximate Value over the course of his first five years. A week later I decided another change was needed. While AV measures the value provided by a player, the marginal value provided by a player is a better measure of the value of a draft pick. As a result, I re-did the chart and only gave players credit for their AV above 2 points of AV.

You can view the values for both of those charts and the Jimmy Johnson chart here. This week, I spoke with Peter Keating of ESPN the Magazine, who is working on an article regarding how teams should value draft picks. Keating asked if I could make two changes to the chart, and I was happy to do so (and thought you guys might be interested). First, I increased the measure of replacement-level AV from 2 to 3 points. Theoretically, this change would reward the best players, as the higher the value used for replacement level, the fewer players that will meet that threshold. The other change was to reduce the number of years measured from five to four, since that matches the length of the typical rookie contract under the new CBA. The chart below shows the raw data and a smoothed curve depicting the marginal AV (over 3) produced by draft picks in the first four years of their career over a 28-year period.
[continue reading…]

{ 8 comments }

Quarterbacks wearing #12 have won 14 Super Bowls

Quarterbacks wearing #12 have won 14 Super Bowls.

What does it mean that Geno Smith comes from a long line of Mike Leach/Dana Holgorsen star quarterbacks? I don’t know. At a minimum, it means he’s part of a very interesting and distinguished set of college quarterbacks. Because few players have dominated college football over the last 15 years like quarterbacks under Mike Leach and Dana Holgorsen.

Leach is one of the most fascinating characters in recent college football history, and he’s been one of the most influential coaches in the modern passing game. That’s what tends to happen when your quarterbacks produce video game numbers practically every season. Leach was the offensive coordinator under Hal Mumme at Kentucky in 1997 and 1998, which is when the Air Raid offense arrived on the national radar. At the time, there hadn’t been any Wildcats drafted in the first round since running back George Adams in 1985. Twenty-six months after Leach and Mumme arrived in Lexington, Tim Couch was the first pick in the NFL draft.

Leach then spent a year as the offensive coordinator for the Oklahoma Sooners with Josh Heupel at quarterback. Heupel led the conference with 3,460 passing yards and 30 touchdowns, and also sported the highest completion percentage (62.0%) in the conference. Those were big numbers in a conference where only four players threw for even 1900 yards, and was enough to land Leach the head coaching job at Texas Tech after only a season in Norman. When Leach moved to Lubbock, Texas in 2000, the quarterback cupboard appeared bare. He took unheralded sophomore quarterback Kliff Kingsbury and shaped him into the player that led the NCAA in pass attempts in 2000, 2001, and 2002. Klingsbury led the Big 12 in passing yards in both 2000 and 2001, and then as a senior, became just the third player in college football history to pass for 5,000 yards in a season (after Ty Detmer and David Klingler). Klingsbury went on to have an unremarkable career in the NFL before excelling as an assistant coach with the Houston Cougars. He followed then-head coach Mike Sumlin to Texas A&M after the 2011 season, and after turning Johnny Manziel into a Heisman Trophy winner, Kingsbury is now the new head coach at his alma mater.
[continue reading…]

{ 4 comments }

Is Arian Foster declining?

[House-keeping note: I’ve added the Salary Cap Calculator to the gray header tabs at the top of each page, so you can now easily get there no matter what page you’re on at Football Perspective.]

A quick look at Arian Foster‘s statistics over the last three years paints a picture of a player in decline:

Year G Rsh RshYd RTD YPC YPG C/G Rec RecYd YPR TD YScm RRTD
2010*+ 16 327 1616 16 4.9 101.0 20.4 66 604 9.2 2 2220 18
2011* 13 278 1224 10 4.4 94.2 21.4 53 617 11.6 2 1841 12
2012* 16 351 1424 15 4.1 89.0 21.9 40 217 5.4 2 1641 17


Foster’s declined in rushing yards per game and yards per carry over the last two years, while his value in the receiving game fell off a cliff in 2012. One could reasonably conclude that Foster simply isn’t the same player he used to be, and that he could drop off even more in 2013.  But while the traditional statistics tell one story, what do the advanced metrics say?
[continue reading…]

{ 20 comments }

How much money *should* Tom Brady be paid? What are the appropriate cap figures for Tony Romo and Darrelle Revis? This series looks to derive the appropriate salary cap value for each player in the NFL.

Let’s start with the basics, which will include many generalities and rough estimates. I have chosen to ignore all players who are in the first three years of their rookie contracts; while we could try to determine the “fair market” cap values for Andrew Luck, Robert Griffin III and J.J. Watt, that would be nothing more than an academic exercise because their 2013 salary cap figures are set in stone. Instead, my goal is to determine the appropriate salary cap values for NFL Veterans (in this post, “Veterans” means all players with at least three prior years of NFL experience).

Note that ALL of the numbers in this post can be manipulated by each user thanks to the Salary Cap Calculator below. Your opinions regarding my assumptions should not interfere with your use of the salary cap calculator.

The salary cap in 2013 is $123.9M, but because players on injured reserve count against the cap, a buffer is needed to sign healthy players during the season. On average, each team will have placed on their roster 64 different players. Some of those players will be signed during the year and may only be on the team for a few weeks, so they won’t cost a significant percentage of the cap. On the other hand, a couple of players are usually on IR before the season even starts. Let’s assume that teams should spend 96% of their cap dollars on the healthy 53 players on their week 1 roster. The next step is figuring out how many of those salary cap dollars will go to non-Veterans.
[continue reading…]

{ 17 comments }

On Thursday, I looked at the increase in pick sixes per interception in the NFL. Brian Fremeau asked if that was also going on at the college level, so let’s take a look.

In 2012, there were 159 pick sixes according to cfbstats.com, matching the number provided at Sports-Reference.com. That’s right in line with previous numbers. The table below shows the number of pass attempts, interceptions, and pick sixes in major college football games since 2006, courtesy of cfbstats.com.

YearPick 6INTAttINT RatePick 6 Rt
20121591532545452.8%10.4%
20111591490513392.9%10.7%
20101591589497763.2%10%
20091581537498723.1%10.3%
20081621606498283.2%10.1%
20071671711529933.2%9.8%
20061631569460113.4%10.4%

It’s pretty interesting that the interception rates in college and the NFL are nearly identical. The interception rate in the NFL was 3.1% in 2007 and 2.9% in 2011, just about what it was in college football in those years. And with the exception of the crazy-high Pick Six rate in the NFL in 2012, both leagues see about 10% of all interceptions returned for touchdowns. Unfortunately, I don’t have the data to see if the Pick 6 rate was 5% in the ’50s in college football like it was in the NFL. But my guess is the trend would hold and that there’s an inverse relationship between interception rate and pick six rate.

{ 2 comments }

Yesterday, I asked how many wins a team full of recent draft picks and replacement-level NFL players would fare. I don’t think there’s a right answer to the question, but it might be a more important question than you think (and you’ll see why on Monday). But I have at least one way we can try to estimate how many games such a team would win.

Neil once explained how you can project a team’s probability of winning a game based on the Vegas pre-game spread. We can use the SRS to estimate a point spread, and if we know the SRS of our Replacement Team, we can then figure out how many projected wins such a team would have. How do we do that?

First, we need to come up with a mythical schedule. I calculated the average SRS rating (after adjusting for home field) of the best, second best, third best… and sixteenth best opponents for each team in the NFL from 2004 to 2011. The table below shows the “average” schedule for an average team:

[continue reading…]

{ 11 comments }

It’s been awhile, but time for another post in the Thought Experiments category. Assume the following:

  • On May 1st, 2013, an average owner, average general manager and average coach are assigned an expansion team. They are randomly assigned 24 players: one from each of the seven rounds of the 2011, 2012, and 2013 drafts. So this expansion team has a 1-in-32 shot at getting Cam Newton from the 2011 first round and a 1-in-32 chance of getting Green Bay offensive lineman Derek Sherrod.  There’s a 1-in-32 chance the sixth round pick from the 2012 draft lands on the Alfred Morris pocket, but more likely than not Lady Luck will give them a generic sixth rounder. As for the final three players, the team is randomly assigned from each draft class one of the X number of undrafted players that ended up making an opening day roster that year. So while it is technically possible this team could get someone like Vontaze Burfict, it’s much more likely to be a Junior Hemingway, David Douglas or Martell Webb. Finally, assume in this magical world that while random, the 24 picks work out in this team’s favor as far as spreading the roster: they don’t end up with 6 quarterbacks and zero defensive lineman, and instead things are magically balanced.
  • On May 2nd, this team is able to poach anyone on any roster provided that such player is making the veterans minimum. The team can also sign players currently not on any roster, but it must be of the veterans minimum variety. The team can sign anywhere from 29 to 50 of these minimum players, with the spread based on how many of the 24 players from above the team decides to roster (and they can roster more in training camp, but must be at 53 by the start of the season).

Suppose we simulate this process and play out the 2013 season 10,000 different times. On average, how many games does this mean win per season?

One thing that you might want to keep in mind. While some teams have gone 1-15 and the 2008 Detroit Lions went 0-16, those records do not represent the true winning percentages of those teams. If we simulated the 2008 Detroit Lions season 10,000 times, they wouldn’t go 0-160,000. When Neil talked about the Tangotiger Regression Model, he added 11 games of .500 football to get an estimate of a team’s true ability level. That would put the ’08 Lions at a .204 winning percentage, or 3.26 wins in a 16-game season. The Lions also has a Pythagorean record of 2.8-13.2, so perhaps we can say they were a 3-win team that was really unlucky. On the other hand, Brian Burke had those Lions at 1.8 wins and Football Outsiders had them at 2.1 wins.

Of course, there are many differences between the 2008 Lions and our mythical expansion team. Just food for thought.

{ 17 comments }

Good bit of trivia from my buddy Scott Kacsmar: there were 71 interceptions returned for touchdowns in 2012, the highest number in NFL history. Another interesting fact about the 2012 season: just 2.6 interceptions were thrown per 100 attempts, the lowest figure in NFL history.

We already know that the league-wide interception rate has been rapidly decreasing for years, but the significant increase in interceptions returned for touchdowns per interception is an under-reported story. Last year was the year of the Pick Six, but the Pick Six rate (INTs returned for touchdowns per interception) has been on the rise for several years. The graph below shows both the interception rate (100*INTs/Att) in blue (and measured against the left vertical axis) and the Pick Six rate (100*INT TDs/INT) in red (and measured against the right vertical axis):

Pick Six rate
[continue reading…]

{ 16 comments }

A closer look at Danny Amendola

Amendola in his element

Amendola in his element.

Few get the statheads talking like Danny Amendola. Bill Barnwell wrote a free-agent book on Amendola in March, where he presented Amendola in the best possible light. Barnwell noted that over the last four years, Bradford has completed 66.5% of his passes aimed at Amendola compared to just 56.8% to all other targets. Barnwell further argued that since Amendola was much more productive in St. Louis than Wes Welker was in Miami, there is a good chance Amendola sees a big, Tom Brady-induced spike when he moves to New England, too.

Scott Kacsmar takes a slightly different view. First, the pro-Amendola argument: since 2010, the Rams are 12-15-1 (.446) when Amendola plays and 4-16 (.200) when he is out. Kacsmar also shows that the Rams averaged 18.9 PPG, 5.8 yards per pass attempt, and 312 yards per game, along with a 5.9% sack rate, in games with Amendola, versus averages of just 12.6, 5.6, 296, and 8.1%, respectively, in games that St. Louis played without Amendola. On the negative side, Kacsmar focused on Amendola’s miserable 8.81 yards-per-reception average, the lowest in history by a wide receiver with at least 100 receptions (by a pretty large margin). Another reason not to be impressed with Amendola’s high catch rate is that 29% of his receptions were “failed completions” [1]These are plays where the player fails to gain a minimum percentage of yards towards a first down (45 percent on first down, 60 percent on second down and 100 percent on third/fourth down. according to Kacsmar.

Amendola is a unique player in the same sense that Darren Sproles isn’t a traditional running back or Tim Tebow isn’t a traditional quarterback. Amendola’s a wide receiver, but he doesn’t operate the way wide receivers have for much of NFL history. According to Pro Football Focus, Amendola was in the slot on 85% of his routes over the last four years; that’s an enormous number, as even Wes Welker ran routes out of the slot on “only” 73.8% of his routes over that time period.
[continue reading…]

References

References
1 These are plays where the player fails to gain a minimum percentage of yards towards a first down (45 percent on first down, 60 percent on second down and 100 percent on third/fourth down.
{ 7 comments }

The best drafting teams from 2000 to 2007

In this post I derived the expected value of the contribution of each draft slot based on Pro-Football-Reference.com’s Approximate Value system. You can see the full draft chart here. Once you know what the expected value is for a draft pick, the next step to grading a draft pick is to measure how much actual value was provided. As before, I used the marginal Approximate Value generated by each player in each of his first five years, with the caveat that a player is only credited for his AV after his first two points of AV. Using that formula, Patrick Willis, LaDainian Tomlinson, and Maurice Jones-Drew come in as the three most valuable picks over that time period.

Since 2000, the team with the most amount of draft value in terms of picks was the 2002 Texans. Houston not only received the first pick in each round that year, but the expansion Texans were given several supplemental draft picks as well. The 2007 Raiders and 2000 Browns tied for the second mount amount of value in terms of raw draft picks, but both of those teams wound up with many more whiffs than hits.

The table below lists the best drafting teams from 2000 to 2007. I’ve also broken out each team’s AV above expectation for each year. If you click on any of the values in the columns from 2000 to 2007, you can see the players drafted by the team that year (one side effect of including this information: the columns do not sort correctly).

[continue reading…]

{ 34 comments }

The Time Value of Draft Picks

How do you compare the value of a draft pick this year compared to a draft pick next year? NFL teams have often used a “one round a year” formula, meaning a team would trade a 2nd, 3rd, or 4th round pick this year for a 1st, 2nd, or 3rd rounder next year. But to my knowledge, such analysis hasn’t evolved into anything more sophisticated than that.

So I decided to come up with a way to measure the time value of draft picks. First, I calculated how much Approximate Value each draft pick provided from 1970 to 2007 during their rookie season. Then, to calculate each player’s marginal AV, I only awarded each player credit for his AV over two points in each year. As it turns out, the player selected first will provide, on average, about 4 points of marginal AV during his rookie year. During his second season, his marginal value shoots up to about 5.5 points of AV, and he provides close to 6 points of marginal AV during his third and fourth seasons. In year five, the decline phase begins, and the first pick provides about 4.7 points of AV. You can read some more fine print here. [1]The charts in this post are “smoothed” charts using polynomial trend lines of the actual data. I have only given draft picks credit for the AV they produced for the teams that drafted … Continue reading

Here’s another way to think of it. The 1st pick provides 4.0 points of marginal AV as a rookie, the same amount the 15th pick provides during his second year, the 17th pick produces during his third year, the 16th pick during his fourth year, and the 8th pick during his fifth year. So the 15th pick this year should provide, on average, about the same value next year as the 1st pick in the 2014 draft (of course, that player might have something to say about that, too).

The graph below shows the marginal AV (on the Y-axis) provided by each draft selection (on the X-axis) in each of their first five years. The graphs get increasingly lighter in color, from black (as rookies) to purple, red, pink, and gray (in year five):
[continue reading…]

References

References
1 The charts in this post are “smoothed” charts using polynomial trend lines of the actual data. I have only given draft picks credit for the AV they produced for the teams that drafted them – that’s why the values are flatter (i.e., top picks are less valuable) than they were in this post. Finally, astute readers will note that the draft looks linear in the second half; that’s because if I kept a polynomial trend line all the way through pick 224, some later picks would have more value than some early picks
{ 5 comments }

I’m usually the one doing the talking, but we’ve got a long off-season ahead of us. I generally advise people interested in becoming writers to write what they want to write about, but it’s also important to give your audience the type of writing they want to read.

This week I looked at a wide range of topics. Monday’s post was about how can teams best take advantage of the rookie salary cap, which fits into the football strategy and theory parts of Football Perspective. On Tuesday, I went all statgeekery on you with a look at the youngest and oldest teams in the NFL last year.

I changed courses on Wednesday and went the player profile route with an in-depth look at Arrelious Benn, while on Thursday I did a social economics-style post when I examined the correlation between birth months and making the NFL. On Friday, I did the sort of data dump that was a specialty at PFR with a post about players who played with the most coaches.

Those are five very different types of posts, and I like to think that there’s generally an wide variety of posts at Football Perspective. But I’d like to make the site as reader-friendly as possible, and I know there are some devoted readers who check in every day. If I can produce content you’re interested in reading about, all the better.

So, how can I improve the site? What would you like to read about? Nothing is off-limits, so make your suggestions in the comments.

{ 30 comments }

I took this Sporcle quiz the other day on receivers to gain 1,000 yards with multiple teams. I did fine, I suppose, naming 22 of the 30 receivers. As I was going through the list, I kept looking at the rows for “Buccaneers, Panthers” and “Panthers, Cowboys” and my brain operated in this way:

Steve Smith never played for the Bucs or Cowboys. Neither did Muhsin Muhammad.”
….
Patrick Jeffers had a big year in 1999, but that was it for his career.”
….
“The Panthers have literally never had anyone resembling a competent wide receiver starting across from Smith in as long as I can remember (other than Muhammad).”
….
Wesley Walls didn’t play for Dallas or Tampa Bay. And I can’t think of a single other Panthers receiver from before 2000.”

“Let me try typing in Smith and Muhammad again.”

After the quiz, I checked the Panthers team page on PFR. The top nine receiving seasons were accomplished by either Smith or Muhammad, but there were in fact two other players to hit the 1,000-yard receiving mark for Carolina. Can you name them? If so, you’re a better man on Panthers wide receiver trivia than me.
[continue reading…]

{ 9 comments }

Playing with the most coaches on one team

This man knows a coach when he sees one.

This man knows a coach when he sees one.

During the season, Mike Tanier noted that Shane Lechler has played for eight different coaches while being a member of the Raiders. When I read it, I thought that sounded like the start of a really good trivia question, and I put figuring out the answer to that question on my offseason to-do list. Sadly, the offseason is here.

Lechler and his special teams brother Sebastian Janikowski are two of only four players since 1960 to play for eight different coaches for the same franchise. Both Lechler and Janikowski were selected in the 2000 draft, and they each played under Jon Gruden, Bill Callahan, Norv Turner, Art Shell, Lane Kiffin, Tom Cable, Hue Jackson, and Dennis Allen.

You probably wouldn’t be surprised to find out that Jason Hanson, the Lions placekicker since 1874, has seen his share of head coaches come and go, too. The fourth player is Ernie McMillan, a four-time Pro Bowl tackle for the Cardinals in the ’60s and ’70s (and the father of Jets safety Erik McMillan), although he makes the list with an asterisk. McMillan played for Don Coryell in ’73 and ’74, Bob Hollway in ’71 and ’72, Charley Winner from ’66 to ’70 and Wally Lemm for four years before that. But in his rookie season of 1961, the Cardinals had four different head coaches, if you take a liberal definition of the word. St. Louis was coached by Pop Ivy for most of the season, but Chuck Drulis, Ray Prochaska, and Ray Willsey all served as the interim head coaches at the end of the year. In any event, I will include all co-coaches as separate coaches.

The table below shows all players to play under at least five different coaches for the same franchise since 1960. The first year with the team and the last year with a new coach for that team is indicated for each player, and I have taken the inclusive approach when it comes to co-coaches.
[continue reading…]

{ 6 comments }

In 2006, Doug looked into how much of a role the month in which you were born could play into your chances for athletic success later in life. Doug didn’t just ponder this out of thin air: a bit more research has been spent on this topic than you might think. Steve Levitt, of Freakonomics fame, found some evidence indicating that “older” kids in the same level of play — older by as much as 365 days, I suppose — tended to be more likely to become professional athletes. Basically, if you’re the oldest kid in your travel soccer team or 8th-grade basketball team, chances are you will be better than the other kids. This leads to a snowball effect, where you might be more likely to receive more personal coaching and your confidence should increase.

J.C. Bradury graphed the birth-month of over 16,000 major league baseball players. Take a look:
[continue reading…]

{ 5 comments }

Benn against the Redskins

Benn against the Redskins.

To the casual fan, Arrelious Benn is one of many nondescript wide receivers in the NFL. The Buccaneers selected him in the second round of the 2010 Draft, he gained 862 yards in three seasons, and Tampa Bay just traded him to Philadelphia for a 7th round pick in the 2013 draft.

My curiosity with Benn dates back to his college days. He came to Illinois as a five-star recruit and he gained 676 yards and 2 touchdowns as a true freshman.   While that might not sound impressive, he gained more than twice as many receiving yards as any other player on the team, and his production earned him Big Ten Freshman of the Year honors. That 2007 Illini threw the fewest passes in the Big Ten, suppressing Benn’s numbers, but landed in the Rose Bowl based on a run-heavy attack led by Rashard Mendenhall. They were quarterbacked by Juice Williams, a running “quarterback” in name only, and coached by Ron Zook, the two men who would torpedo the Illinois offense over the next two seasons.

As a sophomore, Benn again more than doubled the production of the next best receiver on the Illini: he caught 67 passes for 1,066 yards and ran 23 times for 101 yards. Those numbers were good enough to lead the conference in receiving yards during the regular season, although Minnesota’s Eric Decker passed him in Minnesota’s Bowl game. Illinois didn’t have a Bowl game, as the team imploded and finished 5-7.
[continue reading…]

{ 3 comments }

The youngest and oldest NFL teams in 2012

Last August, I looked at the 2011 age-adjusted team rosters. I have reproduced the intro to that post below:

Measuring team age in the N.F.L. is tricky. Calculating the average age of a 53-man roster is misleading because the age of a team’s starters is much more relevant than the age of a team’s reserves. The average age of a team’s starting lineup isn’t perfect, either. The age of the quarterback and key offensive and defensive players should count for more than the age of a less relevant starter. Ideally, you would want to calculate a team’s average age by placing greater weight on the team’s most relevant players.

Using Pro-Football-Reference’s Approximate Value system, I calculated the weighted age of every team in 2012, with the weight for each player being proportionate to his contribution (as measured by AV) to his team. You don’t have to use AV — Danny Tuccitto did an excellent job producing age-adjusted team rosters based on the number of snaps each player saw — but since AV is what I’ve got, AV is what I’ll use.

The table below shows the total AV for each team in 2012. The table is sorted by the team’s average (AV-adjusted) age. I’ve also included the offensive and defensive AV scores and average ages for each team.

[continue reading…]

{ 14 comments }