≡ Menu

Through 9 weeks of the 2018 season, the Bills looked like one of the worst passing teams of the modern era.  Buffalo ranked last — by a lot — in most major passing categories.

  • Buffalo’s passer rating was 51.5; Arizona ranked 31st at 67.5.
  • Buffalo ranked 32nd in Net Yards per Attempt at 4.2; Arizona ranked 31st at 4.9, Cleveland was 30th at 5.2, and every other team was at 5.7 or better.
  • Buffalo had 3 TD passes and 16 INTs, by far the worst TD/INT ratio in the league. Arizona had the second-worst at 7 TDs and 10 INTs.
  • Buffalo ranked 31st in yards per completion, at just 9.9 (the Colts were at 9.7).

But over the last 8 weeks of the season — and admittedly I am using multiple endpoints here to make a point — things changed significantly. From week 10 through the end of the season, the Bills ranked:

  • 28th in passer rating, which while not very good, was a much better 78.0.
  • 12th in Net Yards per Attempt, at an above-average 6.6.
  • Had a TD/INT ratio of 10/7.
  • 1st (!) in yards per completion, at 13.5.

In case it wasn’t obvious by those four numbers, much of the improvement in pass efficiency was driven by Buffalo’s huge jump in yards per completion. And much of that improvement was due to the breakout performance by Robert Foster.  The rookie wideout had just two receptions for 30 yards through week 9, but in the team’s final 7 games, he had 25 catches for 511 yards, a 20.4 YPC average. Foster was an undrafted rookie out of Alabama who had just 389 yards in four seasons with the Crimson Tide, but like most players from Tuscaloosa, he profiled as a player with great athleticism.  And, of course, some of Buffalo’s improvement comes from how the men under center changed over the course of the season.

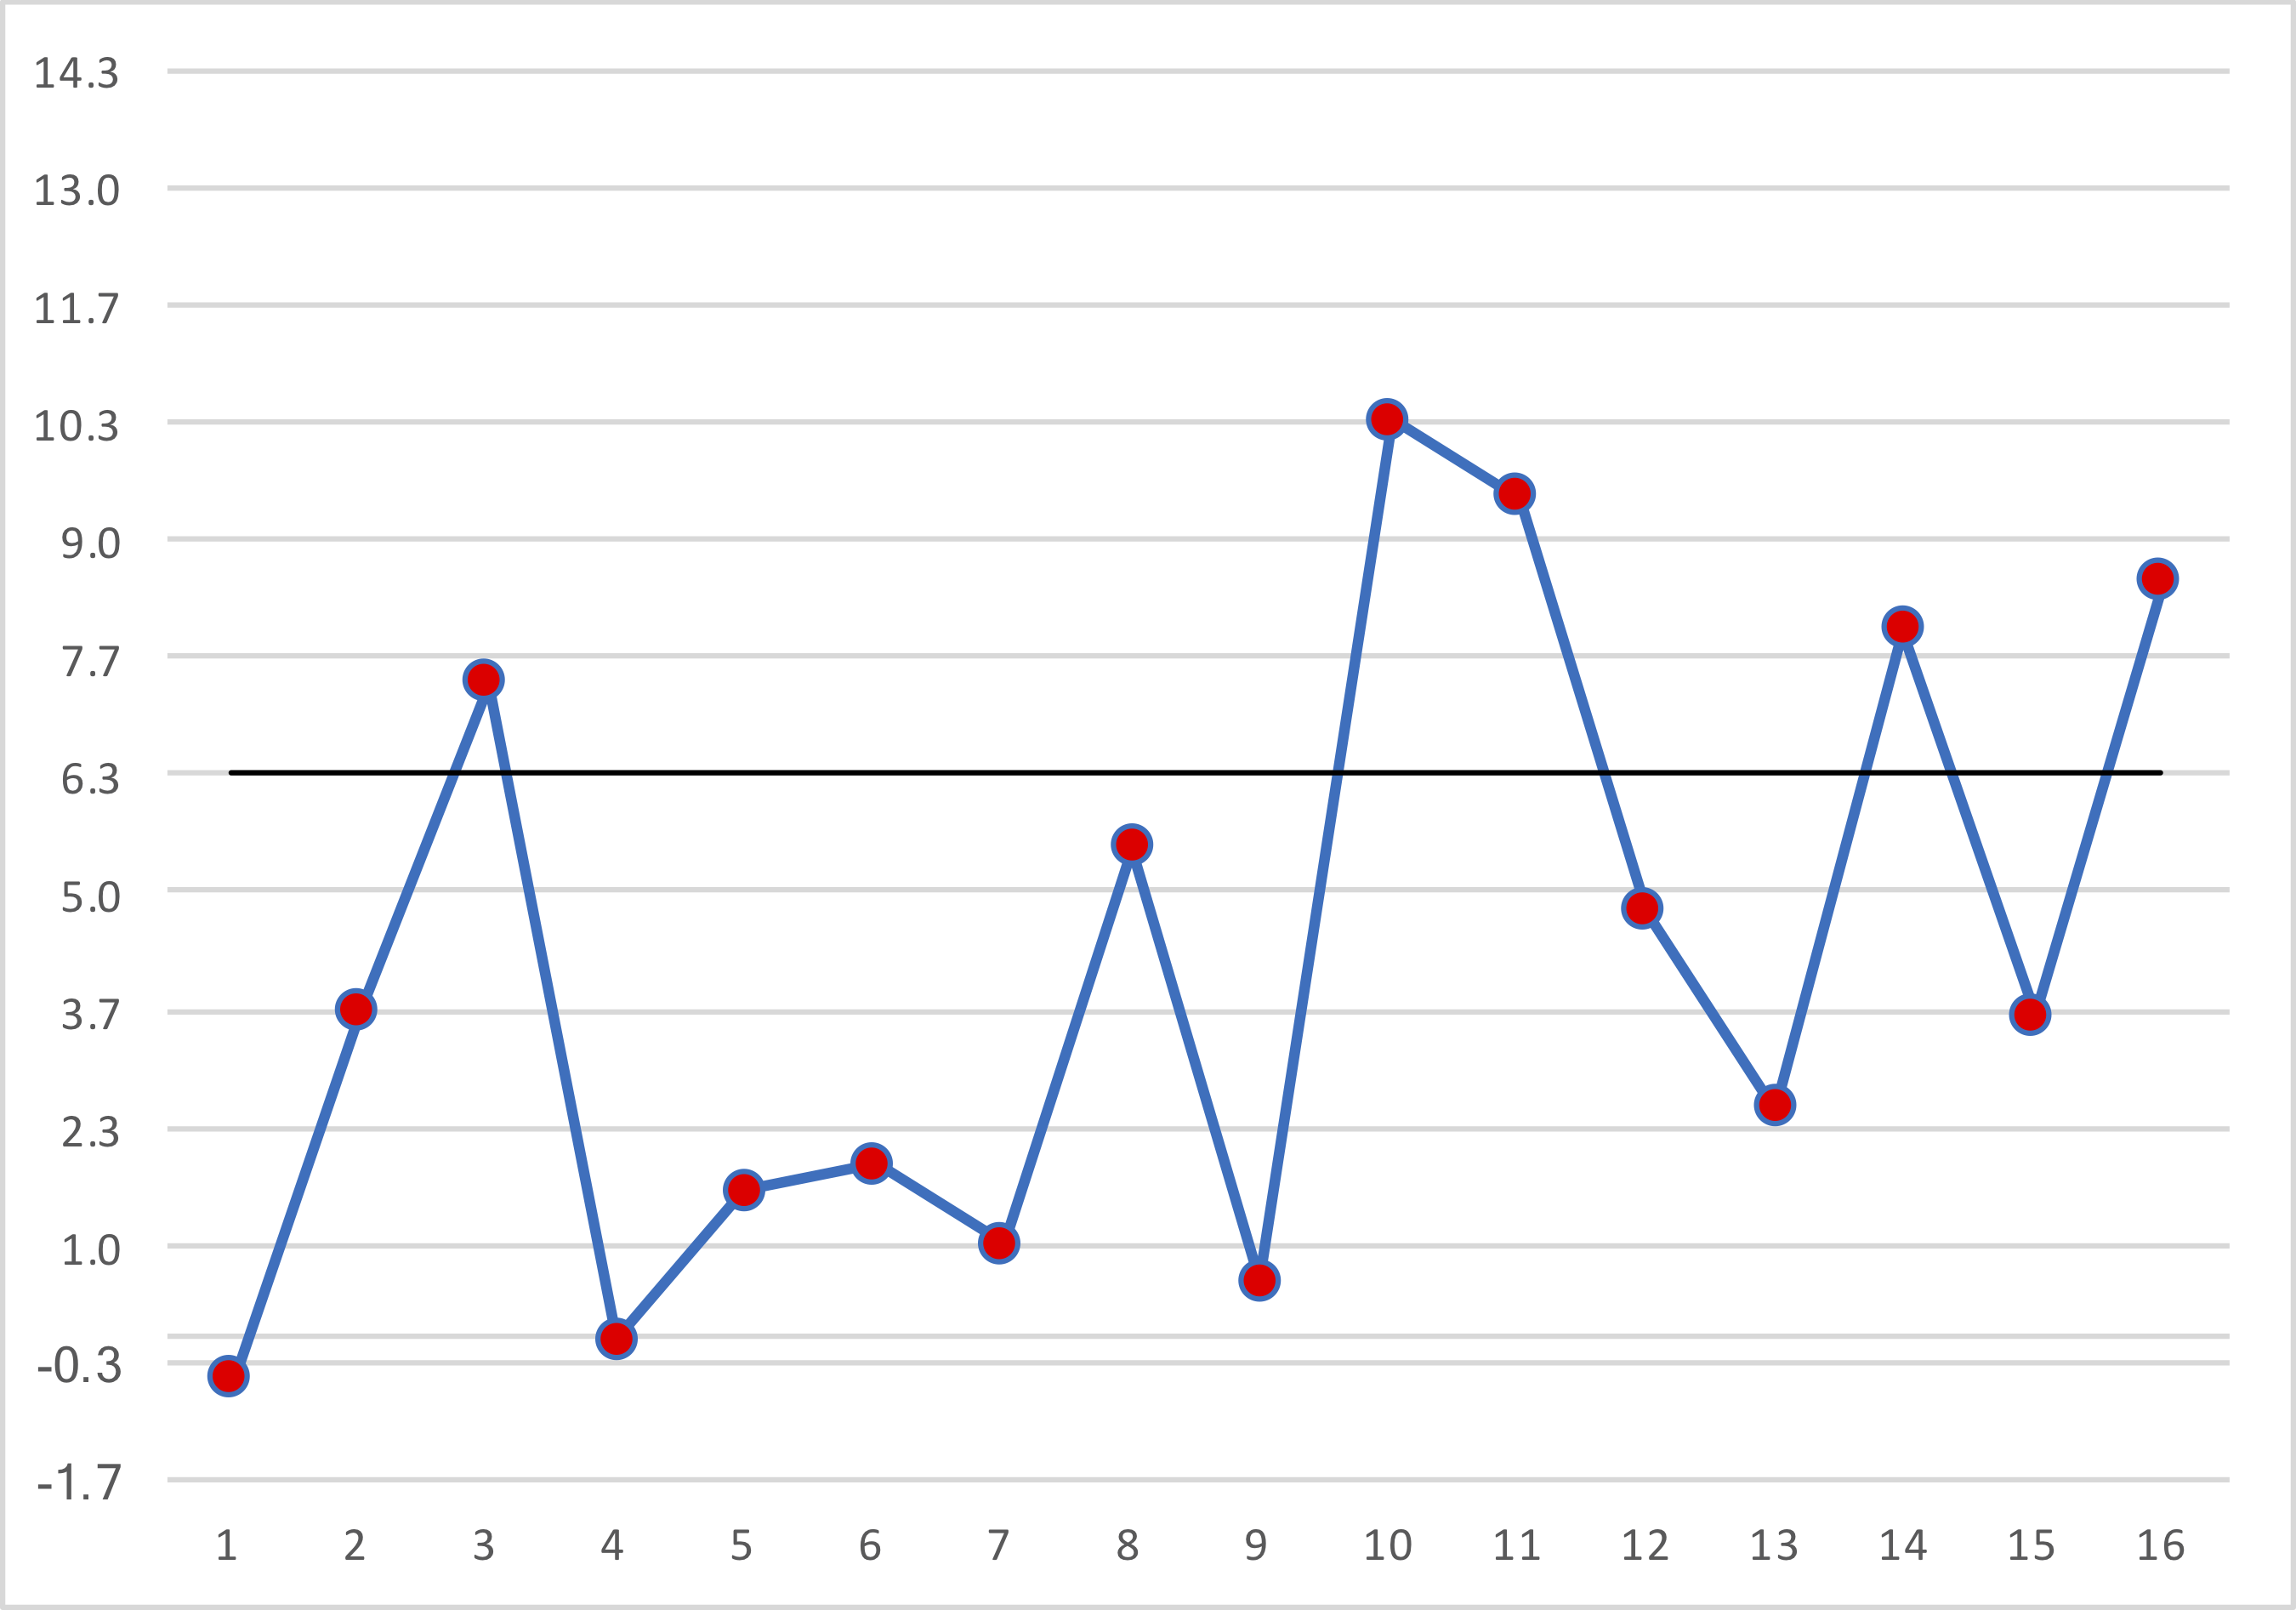
The graph below shows the Adjusted Net Yards per Attempt produced by the Bills in each game in 2018. The black line shows the league average ANY/A of 6.32. The Bills were really bad through week 9, as we showed above, but then rebounded significantly the rest of the way.  The X-Axis shows game number, and the Y-Axis shows ANY/A:

So let’s get to the quarterbacks. Josh Allen, Nathan Peterman, Derek Anderson, and Matt Barkley all started games for the Bills last season.

Peterman started game 1, threw 12 passes in game 6 (relieving an injured Allen), and started game 9.

Allen threw 15 passes in game 1, started games 2 through 6, missed the next four games with an injured elbow, and then started games 11 through 16.

Anderson started games 7 and 8 in relief of an injured Allen, before a concussion re-opened the door for Peterman.

Barkley was the quarterback for the team’s 10th game — a win over the Jets that was arguably Buffalo’s best passing game of the season. Despite the sparkling performance, after that game, Allen returned as the team’s starter for the remainder of the year. And while Allen’s full-season numbers were underwhelming, his statistics improved significantly as the season went on. And how much of that was due to Allen — and how much is due to Foster — is also worth asking.

Allen averaged 6.5 yards per attempt last season, which is really bad (it landed him in the bottom three with Joe Flacco and fellow rookie Josh Rosen).  On targeted passes (i.e., excluding throwaways and spikes), he averaged 6.7 yards per attempt.  But Allen averaged 10.9 yards per attempt on passes targeted to Foster and 6.1 yards per attempt on passes targeted to all other Bills.  For Buffalo fans, it may not really matter, and the optimistic spin is that the future is very bright: these two rookies from 2018 may well lead the next great passing attack in western New York.

{ 0 comments }

The graph below shows the passer rating in every week of every NFL season since 1950. The red dot at the top left? That’s the passer rating from week 7, 1958, when six games all took place on Sunday, November 9th.

November 9th, 1958 should be remembered as the greatest passing day of the NFL’s first 50 years. It was a star-studded day with names even modern fans will recognize. Two of the best quarterbacks of the 1960s, Bart Starr and Norm Van Brocklin, were starters that day, while the 49ers saw both future MVP John Brodie and Hall of Famer Y.A. Tittle take the field. And all four lost. [continue reading…]

{ 1 comment }

Prior to the 2018 season, there had never been a week in the NFL where at least 5 games were played and the league as a whole had a passer rating of 97.0. In week 2 of the 2018 season, the league-wide passer rating was 102.6. In week 4, it was 98.2. In week 8, it was 98.0. In week 10, it was 100.9. In week 12 it was 101.2.

The graph below shows the passer rating of every week in the NFL since 1950, shown chronologically along the X-Axis, where at least five games were played:

[continue reading…]

{ 0 comments }

Is Winning In Close Games Sustainable?

In 2017, the Carolina Panthers went 11-5, thanks largely to a 7-1 record in games decided by 7 or fewer points. This means that in non-close games, Carolina went 4-4.

In 2018, Carolina was even better in non-close games, going 5-2. But the Panthers didn’t replicate their close-game success; in fact, the Panthers luck swung wildly in a different direction, going just 2-7 in close games.  This has actually been a trend of the Ron RiveraCam Newton Panthers.  The duo got off to a very rocky start, going 1-5 (0.167) in close games in their first year together in 2011, and then 1-7 (0.125) in close games in 2012.  After that season, I wrote that Carolina looked like a team on the rise that would probably start experiencing good luck soon.  That turned out to be one of my most accurate predictions, as in close games, Carolina went 5-2 (0.714) in 2013, 4-2-1 (0.643) in 2014, and then 6-1 (0.857) in 2015.  The Panthers then swung the other way, going 2-6 (0.250) in 2016, then up to 7-1 (0.875) in 2017, and back down to 2-7 (0.222) in 2018. [continue reading…]

{ 1 comment }

Memorial Day 2019

Pat  Tillman

Pat Tillman.

It is the soldier, not the reporter, who has given us freedom of the press. It is the soldier, not the poet, who has given us freedom of speech. It is the soldier, not the campus organizer, who has given us the freedom to demonstrate. It is the soldier, who salutes the flag, who serves beneath the flag, and whose coffin is draped by the flag, who allows the protester to burn the flag.
Father Dennis Edward O’Brien, USMC

Today is a day that we as Americans honor and remember those who lost their lives protecting our country. As my friend Joe Bryant says, it’s easy for the true meaning of this day to get lost in the excitement of summer and barbecues and picnics. But that quote helps me remember that the things I enjoy today are only possible because those before me made incredibly selfless sacrifices. That includes a number of football players who have lost their lives defending our country.

The most famous, of course, is Pat Tillman, the former Arizona Cardinals safety who chose to quit football to enlist in the United States army. On April 22, fifteen years ago, Tillman died in Afghanistan. Over thirty years earlier, we lost both Bob Kalsu and Don Steinbrunner in Vietnam. You can read their stories here. For some perspective, consider that Hall of Famers Roger Staubach, Ray Nitschke, and Charlie Joiner were three of the 29 NFL men who served in the military during that war.

An incredible 226 men with NFL ties served in the Korean War, including Night Train Lane and Don Shula. Most tragically, World War II claimed the lives of 21 former NFL players.

Another player, Dave Schreiner an All-American at Wisconsin and the 11th pick in the 1943 Draft never played in the NFL: he served in the War and was killed in the Battle of Okinawa. Jack Chevigny, former coach of the Cardinals, and John O’Keefe, an executive with the Eagles, were also World War II casualties. The Pro Football Hall of Fame has chronicled the stories of these 23 men, too. Lummus received the Medal of Honor for his bravery at Iwo Jima, and you can read more about his sacrifice here. In 2015, the Giants inducted him into the team’s Ring of Honor. [continue reading…]

{ 0 comments }

The Adam Gase Dolphins And Close Games

I have written before about the remarkable close-game success that Adam Gase and the Miami Dolphins had from 2016 to 2018. The disparity is remarkable: Miami went 3-19 in games decided by more than 8 points under Gase, the second-worst record in the NFL in non-close games (only the Browns were worse). But in games decided by 8 or fewer points, Miami went 20-6, the best record in the NFL.

So you have a huge split here: under Gase, the Dolphins were outstanding in close games but awful in non-close games. What does that mean? Was Gase an outstanding coach who could win any game as long as the talent level of the two teams were close? Or was Gase an awful coach who just happened to get really lucky? With a 23-25 record, Gase looks like an average coach — so perhaps he’s somewhere in the middle of these two extremes?

First, a quick visual to show how extreme this performance really was. The graph below shows each team over the last three years, and their winning percentage in close games (X-Axis) and non-close games (Y-Axis). A team that was awful in non-close games but great in close games would be at the bottom right of the chart: as you can see, Miami is all alone there. [continue reading…]

{ 1 comment }

It’s time for a topical post here at Football Perspective, so let’s look at the careers of Roman Gabriel and Ken Stabler. Both were very good quarterbacks for a long time, and occasionally great quarterbacks for stretches. When they retired, each was a borderline HOF candidate. Statistically, Gabriel had the better career, including posting an ever-so-slightly better era-adjusted passer rating. Both are safely in the top-50 quarterbacks of all time, and while Stabler (who won a Super Bowl) is in the Hall of Fame, Gabriel probably was the better quarterback on a consistent basis.

But that’s not what I want to discuss today, because it’s not that interesting whether you have Gabriel at 28 and Stabler at 35 on your all time list, or vice versa. What *is* interesting is how they are two of the biggest outliers in two metrics that often go together. [continue reading…]

{ 0 comments }

I originally wanted to write today about the Dallas Cowboys, and whether them being labeled America’s Team was reflected in their appearances on Monday Night Football. The Cowboys have been on MNF a whopping 83 times since the program began in 1970, just one behind the Miami Dolphins for the most in the NFL. The 49ers, Broncos, Redskins, Steelers, and Bears all have between 70 and 75 appearances, too.

Then I wondered: do the Cowboys usually play at home or on the road on MNF? As it turns out, it’s usually on the road. Dallas has played 43 road games on Monday Night Football, as have the Raiders, two teams that NFL fans love to hate. But it’s the New York Giants that have the most road games on Mondays with a whopping 47. That stands in stark contrast to just the 19 home games the Giants have had on Monday nights. The table below shows the MNF data for all 32 teams. The Giants have played, on average, 0.57 more road games than home games per season on MNF, easily the most in the league. Meanwhile, the Dolphins — perhaps because Miami is a good location for a night game — have played 0.57 more home MNF games per season than road MNF games.

[continue reading…]

{ 1 comment }

On Monday, I posted the implied SRS ratings from the Vegas lines released last week covering the first 240 games of the season. And, as discussed, the Oakland Raiders have the toughest schedule in the league, by virtue of competing in the AFC West with two elite teams, and facing the tough AFC South and NFC North Divisions. The table below shows each team’s SOS for all 16 games in 2018:

RkTeamSOSDivisionOpp Divisions
1Oakland Raiders0.9AFC WestAFCS; NFCN
2Denver Broncos0.7AFC WestAFCS; NFCN
3Houston Texans0.6AFC SouthAFCW; NFCS
4Atlanta Falcons0.6NFC SouthNFCW; AFCS
5Chicago Bears0.5NFC NorthNFCNE; AFCW
6Tampa Bay Buccaneers0.5NFC SouthNFCW; AFCS
7Arizona Cardinals0.4NFC WestNFCS; AFCN
8Tennessee Titans0.4AFC SouthAFCW; NFCS
9Jacksonville Jaguars0.4AFC SouthAFCW; NFCS
10Minnesota Vikings0.3NFC NorthNFCNE; AFCW
11Los Angeles Chargers0.3AFC WestAFCS; NFCN
12Detroit Lions0.2NFC NorthNFCNE; AFCW
13Kansas City Chiefs0.2AFC WestAFCS; NFCN
14Carolina Panthers0.1NFC SouthNFCW; AFCS
15Seattle Seahawks0.1NFC WestNFCS; AFCN
16San Francisco 49ers0.1NFC WestNFCS; AFCN
17Green Bay Packers0.1NFC NorthNFCNE; AFCW
18Miami Dolphins0AFC EastAFCN; NFCE
19New Orleans Saints0NFC SouthNFCW; AFCS
20Indianapolis Colts-0.1AFC SouthAFCW; NFCS
21Dallas Cowboys-0.1NFC EastNFCN; AFCE
22Los Angeles Rams-0.1NFC WestNFCS; AFCN
23Washington Redskins-0.2NFC EastNFCN; AFCE
24Baltimore Ravens-0.2AFC NorthAFCE; NFCW
25Pittsburgh Steelers-0.4AFC NorthAFCE; NFCW
26Cincinnati Bengals-0.4AFC NorthAFCE; NFCW
27New York Giants-0.6NFC EastNFCN; AFCE
28Philadelphia Eagles-0.7NFC EastNFCN; AFCE
29Buffalo Bills-0.7AFC EastAFCN; NFCE
30Cleveland Browns-0.7AFC NorthAFCE; NFCW
31New York Jets-0.9AFC EastAFCN; NFCE
32New England Patriots-1.3AFC EastAFCN; NFCE

[continue reading…]

{ 1 comment }

Implied SRS Ratings For the NFL in 2019: Every Game

Yesterday, I published the implied SRS ratings from the Vegas point spreads produced last week. Today, I want to publish the weekly point spreads, along with some notes.

With 240 games involved, each team’s rating gets generated by looking at the point spread in their game and the point spreads in all other games by them, and the point spreads in all other games by their opponent, and the games for their opponent’s opponents, and so on. For the most part, the results match up pretty well. For example, in week 7, Houston is a 4-point road underdog in Indianapolis, and in week 11, the Texans are a 2-point home favorite against the Colts. The Steelers are 9-point home favorites against Cincinnati in week 4, and Pittsburgh is a 3-point road favorite against the Bengals in week 12.

For the most part, after we have derived each team’s rating, the point spreads then make a lot of sense. Pittsburgh has an SRS of +1.5 and Cincinnati has an SRS of -4.3, so it makes perfect sense that the Steelers would be 9-point home favorites and 3-point road favorites against the Bengals. But there are two games that don’t make much sense.

In week 8, the Bengals are facing the Rams in London. Los Angeles has an SRS rating of +5.4, making them 9.8 points better than Cincinnati. And if anything, home field should favor Cincinnati, as this is a really far trip for LA. And yet the Rams are 13-point favorites! In addition, the Seahawks have an SRS rating of +1.9, while the Falcons have an SRS rating of +0.4. All else being equal, the Seahawks should be 1.5 point favorites on a neutral field and 1.5-point dogs on the road. And yet when Seattle flies cross country to Atlanta, it is the Seahawks that are 1.5-point favorites. Weird.

Other than those games, all other point spreads are within 2 points of what we would project based on the SRS ratings of the two teams and the location of the game. This is why you don’t really need many games to come up with implied SRS ratings: for the most part, Vegas uses their team ratings to set lines, and the transitive property is applicable here (and matchup strengths are not).

Below are the point spreads for every game this season. Here’s how to read the table, which is fully sortable and searchable. Arizona has an SRS rating of -5.8, and in week 1, hosts Detroit who has an SOS of -3.3. The point spread in that game is a pick’em, and based on that point spread, the expected MOV is the Lions by 3 points. [continue reading…]

{ 0 comments }

Belichick is ecstatic after checking out his team’s schedule.

After the release of the 2019 Schedule, the next big item on the agenda is figuring out who are the best and worst teams in the NFL. Every year, CG Technology releases point spreads for each of the first 240 games of the NFL season (i.e., spreads for every game during each of the first 16 weeks). And, every year, I then use those weekly ratings to derive the Vegas ratings are for each team. Hence the title of today’s post: we can use the Vegas point spreads in each game to derive the implied ratings by CG Technology for each team.

The way to do this is to take the point spread in each game, adjust for home field (except for the five international games), and then determine by how many points Vegas thinks Team A is better than Team B. For example, when the Jets are favored by 6 points in a home game against the Dolphins, we can take this to mean that Vegas thinks New York is about three points better than Miami. When we see that the Jets and Dolphins game is a pick’em for the matchup in Miami, this helps reinforce that view. And when Vegas says the Jets are a pick’em against the Browns at home, that tells us that Vegas thinks the Jets are about 3 points worse than the Browns *and* that the Dolphins are about 6 points worse than Cleveland. Using the iterative SRS process, and because the transitive property of point spreads applies, we can generate team ratings based on the 240 point spreads involved.

Here’s how to read the table below, in each case excluding week 17 action. After adjusting for home field advantage, the Patriots are expected to beat their average opponent by 6.6 points. On average, New England’s opponents (after adjusting for *their* strength of schedule) are 1.0 points below average, which means the Patriots are expected to be 5.5 points better than average (difference due to rounding). That’s the best in the league; the worst team in the league is the Cardinals. [continue reading…]

{ 1 comment }

It is a football truism that the team that wins the rushing battle wins the game. The causation arrow also runs the other way, of course: the team that wins the game usually wins the rushing battle.

Since 1950, how successful were teams that won the rushing battle? Those teams won 72.9% of the time. That number is 72.7% since 1970, 71.9% since 1990, 71.3% since 2002, and 70.5% over the last 10 years. And the numbers are nearly identical, of course, if we ask the question the other way (among teams that won, how often did they win the rushing battle?).

Now, there are obviously key factors that drive both of these results: number of carries and leading late in games. The number of carries a team has is highly correlated with how many rushing yards a team gains. And the number of carries a team has is highly correlated with what the score margin is late in the game. And, finally, the score margin late in the game is highly correlated with how often the team wins the game.

That’s a few steps, but given the strong correlations, it makes it difficult to really evaluate a team’s rushing game and the causal relationship between rushing and winning. In a lot of games, you can see something like this:

Team that is winning late –> is team that runs more late in games –> is team that finishes with more runs –> is team that finishes with more rushing yards –> is team that wins.

But what if we flip the script and look at games where that’s not true. Specifically, I’m thinking of all games where the team that wins the game was losing at the end of the third quarter. In that universe, we have a much more even environment to examine the rushing game. For example, since 1950, there have been 2,085 games where a team was losing after three quarters and won the game. On average, those teams trailed by 5.4 points after three quarters, but of course won every game.

Now, what percentage of the time do you think the winning team — that is, the team that trailed after three quarters — won the rushing battle?

This isn’t just a rhetorical question. I want you to think about it. On average, over these two thousand plus games, the winning team trailed by 1.5 points after the first quarter, (4.6 to 3.1), by 3.8 points at halftime, (12.0 to 8.2), 5.4 points after three quarters (17.1 to 11.7), and then was ahead by 4.2 points (23.7 to 19.5) after the fourth quarter.

Knowing this, how often do you think the team that won also won the rushing battle?

I’ll give you another minute to think about it.

.
.
.
.
.
.
. [continue reading…]

{ 1 comment }

How Often Does A Passing Game Flip The Outcome?

In week 1 last year, Tampa Bay quarterback Ryan Fitzpatrick had a game for the ages. He averaged 17.75 ANY/A on 28 dropbacks, and was the catalyst in the Bucs 48-40 upset over the Saints.  Tampa Bay’s running game underperformed, and its defense was dreadful, but Fitzpatrick and the passing offense were so effective that the Bucs won anyway.

Here is the Expected Points Summary from that game, courtesy of PFR.

Passing is king in football, and you won’t be surprised to learn that in lots of games, the passing game is the reason a team wins. Even in games where a player throws a pick six — say, this Chargers/49ers game from September — strong passing the rest of the way can make up the difference. In this game, Los Angeles won by 1 point and finished with +2.2 points of passing EPA, as Philip Rivers still finished with 6.43 ANY/A.

In total, there were 113 games last year where a team won and their passing EPA was larger than the margin of victory.  This is in stark contrast to yesterday, where there 23 games where the team that won had a rushing EPA larger than the margin of victory.  This means that in 44% of games, the team that won would “have lost” if they had an average passing attack. [continue reading…]

{ 1 comment }

How Often Does A Running Game Flip The Outcome?

No study is perfect, but some are useful anyway. Pro-Football-Reference.com publishes Expected Points Data for every game broken down by unit. For example, let’s take a look at the week 6 game from the 2018 season between the Broncos and Rams. In this game, Jared Goff and the passing attack produced just 174 net yards on 33 dropbacks, while throwing one interception and zero touchdowns. In other words, it was a really bad game (3.91 ANY/A), statistically his second-worst of the season (behind his disaster performance in Chicago). Meanwhile, Todd Gurley rushed 28 times for 208 yards and 2 TDs, a monster performance that included a 4th down conversion.

The Rams won the game by 3 points, while the team’s running game produced 15 points above expectation. So — if we are willing to make a few assumptions about how a game works — we can say that the Rams won against the Broncos in a game where they would not have won had their rushing game been average.

There were 23 games in 2019 where a team won and where the team’s rushing EPA was greater than the margin of victory. That represents 9% of all winning teams in 2018. [continue reading…]

{ 1 comment }

We know that there is a strong correlation between winning percentage and rushing plays: the teams with the best records tend to run most often, as leading in the second half of games is strongly correlated with both winning games and running in the second half of games. Last year, the top 5 teams in rushing attempts all made the playoffs, and 9 of the top 10 teams (sorry, Buffalo) in rushing attempts won at least 9 games.

The flip side of this is that there is a negative correlation between winning percentage and pass plays. But what I wanted to look at today is how this has changed over time.

I grouped all games into ones where a team passed between 20 and 29 times, 30 and 39 times, or 40 to 49 times. I then checked, for every season since 1960, how often teams won when meeting those criteria. The results are in the graph below: [continue reading…]

{ 0 comments }

According to Ian Rapaport, Jets head coach — and now interim GMAdam Gase was apparently unhappy with the amount of money ex-New York GM Mike Maccagnan spent to lure Le’Veon Bell to the team in March. Gase “just did not love spending that much money for a player at that position” according to Rapaport. Which, frankly, is a little silly.

For starters, other than Bell, all other Jets running backs are making less than $1M this season (the top three are Elijah McGuire, Trent Cannon, and Ty Montgomery).  And the Bell contract is hardly debilitating: he will cost the Jets $9M in salary cap space.  As a result, New York has allocated $12.4M in 2019 salary cap dollars to the running back position, which …. simply isn’t that much.

The two teams that have allocated the most 2019 salary cap dollars to the running back position are the Bills (LeSean McCoy, Frank Gore, and T.J. Yeldon) and 49ers (Jerick McKinnon, Tevin Coleman,Raheem Mostert), and perhaps you want to argue that those are not the teams one should emulate.  But last year’s two Super Bowl participants are also in the top five in salary cap dollars spent at running backs.  The Rams have the highest paid running back in the NFL in Todd Gurley and also are paying over $2M this season to Malcolm Brown.  New England is spending $4.6M on James White, $3M on Rex Burkhead, $2.2M on Sony Michel, and $1.7M on Brandon Bolden.  And in terms of capital spent, New England used a 1st round pick on Michel in 2018, have two higher paid backs on the roster, and then used a 3rd round pick this year on RB Damien Harris from Alabama.

Arizona (David Johnson) rounds out the top 5 in RB salary cap dollars spent, and the Jets are sixth.  So while Gase may think the Jets overpaid for Bell, it’s hard to make the argument that this was a big mistake.  The Jets are one of 10 teams that still have $25M of salary cap space available for 2019, and there are not many ways left to use that space.  Maybe Gase thinks Bell was overpaid by a couple of million dollars, but that will have little practical impact on the team in 2019.  In 2020, Bell’s cap hit will be $15.5M, but that is not going to hamstring the team.

One reason for that, of course, is the presence of Sam Darnold.  In general, we do see an inverse relationship between how many 2019 salary cap dollars a team spends at RB with how many salary cap dollars a team spends at QB. Take a look at the graph below, with all data courtesy of Over The Cap. [continue reading…]

{ 0 comments }

Arranged marriages are a Jets tradition

In 2001, the Jets did something pretty conventional.  On January 12, 2001, they hired a new GM in Terry Bradway, and six days later, Bradway hired a new head coach in Herm Edwards.  That’s pretty much the normal way a team operates: ownership (in this case, it was brand new owner Woody Johnson) picks a GM to build the organization, and then the GM picks a head coach to build the team.

Apparently, Johnson has since found the old fashioned way to be pretty boring.

In January 2006, the Jets traded Edwards to the Chiefs with Bradway’s tenure on the rocks. On January 18, 2006, the Jets hired a new head coach in Eric Mangini.  But then, a few weeks later, on February 7, 2006 Bradway was fired and assistant GM Mike Tannenbaum was promoted.  Tannenbaum was a friend of Mangini and “part of the interviewing process” — a common Jets theme — but acknowledged that it was Bradway who made the final call to hire Mangini.

Regardless, in late December 2008, Mangini was fired, and on January 20, 2009, Tannebaum hired Rex Ryan to replace him.

That worked out because the Jets had great seasons in 2009 and 2010, but after bad seasons in 2011 and 2012, Tannenbaum was fired on the last day of the 2012 calendar year. You might think that Ryan would be shown the door with him, but if you think so, you don’t know the Jets.

With Johnson determined to hire a GM while keeping Ryan in place, the best Johnson could do was hire John Idzik — another salary cap guru — to replace Tannenbaum.  That happened in January 2013.  But Idzik couldn’t help turn around a depleted Jets roster, and he never got a chance to hire his own head coach, either: at the end of the 2014 season, Johnson fired both Idzik and Ryan.

This gave the Jets a chance to bring on a new GM and have that GM hire his own head coach. It also gave the Jets a chance to reinvent the circus wheel, and that turned out to be the more appealing option.  On January 12, 2015, Johnson hired both HC Todd Bowles and GM Mike Maccagnan.  Maccagnan didn’t hire Bowles, but he was “part of the interviewing process” as the Jets ran a dual-track hiring approach. As Rich Cimini noted that day:

In hiring Maccagnan, the Jets have changed their power structure. He and Bowles will report directly to Johnson, who envisions the GM and coach as equal partners. Previously, the coach reported to the GM. Maccagnan will have control over the 53-man roster and final say on the draft; the coach will decide the weekly lineups. The lines were blurred with Ryan and Idzik, especially with quarterback decisions.

You may be surprised to learn that such a strategy did not work out.  Under Bowles and Maccagnan, from 2015 to 2018, the Jets were a bad football team.  At the end of the 2018 season, it made a lot of sense to fire both and start over.

But making a lot of sense is viewed as boring by the Jets.  Instead, New York fired Bowles and hired the underwhelming Adam Gase, whose Dolphins ranked 29th in points differential over his three years in Miami.  If you think limiting prospective coaching hires to only those who are willing to work under a bad GM who is on the hot seat and has a 24-40 record would limit the coaching pool, you are correct.  The Jets — after mismanaging the hiring process with another coach — were left with Gase, a candidate who would not have otherwise been a head coach in the NFL in 2019.

But today, on May 15, 2019, in a stunning move for those who don’t follow the Jets, the team has fired Maccagnan, a move that is long overdue but comes at a very suspect time.  It means the new Jets GM will have to inherit Gase as his coach, in typical Jets fashion. And the early reports are not very promising, as Gase is going to be acting as interim GM and assisting in the process of finding his own boss:

Six months ago, the Jets entered the offseason with a potential franchise quarterback in Sam Darnold, the #3 pick in the Draft, and a ton of cap space.  It was the perfect opportunity for the Jets to attract a strong GM candidate, and in turn, have that GM be able to find a strong HC. Instead, the Jets let Maccagnan run the offseason, hire Gates, and spend nearly $200M on free agents, and oversee the 2019 Draft…. and then fire him.  And now, the Jets are looking to to attract a GM who will have no power to make material changes in 2019 and be tied at the hip to Gase.

That strategy makes a lot of sense, but only if you are talking about the Jets.

{ 0 comments }

Yesterday, I noted that the average height of all wide receivers — weighted by receiving yards — declined steadily during the ’80s, and then reverted by steadily rising during the 1990s. There is no natural way to measure something like “wide receiver height” because it involves taking an average. And taking an average means you need a numerator and a denominator, and there’s no clear answer as to what the denominator should be.

Should “average wide receiver height” be an average of all wide receivers in the NFL? Maybe, but what does “all” mean? Does it include only players who made it to the final 53 man roster? Only players who played in a single NFL game that year? Only starters?

Should a wide receiver who played in zero games but be on the roster be counted exactly the same as Jerry Rice? I don’t think so, and one easy and neat way to deal with all of these questions is to take a weighted average, and to use receiving yards as the weighing mechanism. So if Rice was responsible for 2% of all NFL receiving yards, and a 6’7 backup who never made it into a game was responsible for 0% of all receiving yards, then the “average height of all wide receivers” is comprised of 2% Rice and 0% of the backup.

This works well, in my opinion, but there is a potential drawback to this approach. If the structure of the league changes — say, the introduction of three-WR sets with smaller slot receivers — that would change the average by a noticeable amount. Teams may have always had a 5’10 player as their third receiver, but they could jump from 200 yards to 700 yards just by moving to an offense that gets them on the field. [continue reading…]

{ 0 comments }

In 1973, the top five fantasy wide receivers were 6’8 Harold Carmichael, 6’3 Charley Taylor, a pair of 6’1 guys in John Gilliamand Isaac Curtis, and 5’10 Harold Jackson.

In 1988, the top five fantasy wide receivers were 6’2 Jerry Rice, a pair of 5’11 players in Henry Ellard and Ricky Sanders, and a pair of 5’9 targets in Mark Clayton and Drew Hill.

Ten years later, in 1998, the top five fantasy wide receivers were a pair of 6’4 wideouts in Randy Moss and Keyshawn Johnson, a 6’3 Terrell Owens, a 6’2 Eric Moulds, and a 6’1 Antonio Freeman. 6’3 Cris Carter was the sixth-ranked fantasy wideout.

Those years are representative of the broader trend in the NFL: the “average” wide receiver was a bit over six feet tall throughout the 1970s and through 1985; during the ’80s, receivers kept getting shorter, and the “average” receiver was just 71.6 inches tall — also known as a hair under six feet — in 1990. During the ’90s, however, the trend reversed, and by 1998, the “average” receiver once again looked like he did (from a height perspective, at least) prior to the mid-’80s. The “average” wide receiver now is consistently just shy of 6’1 tall, league-wide.

What do I mean by average? I took the height of every wide receiver in the NFL each year, and then took a weighted average of those players based on the number of receiving yards they had. This means a 6’3 receiver with 1200 yards counts three times as much as a 5’10 receiver with 400 yards when determining the weight of the “average” wide receiver in the NFL in a given season. Take a look:

[continue reading…]

{ 4 comments }

One of the greatest receivers ever

As noted yesterday, Steve Smith played on teams that didn’t pass very often (just 94% as often as the average team) or pass well (his average team’s passing offense produced a -0.12 Relative ANY/A). He’s the only player in the top 20 in career receiving yards who played on teams that were below average in both categories; Muhsin Muhammad and Joey Galloway are the only other such players in the top 40, and Eric Moulds (who ranks 49th) is the only other such player in the top 75 in career receiving yards. There’s a reason that Smith has long been a Football Perspective favorite.

Using the results from Friday’s post and Saturday’s post, we can sum the results to see which receivers really played in the most disadvantageous environments. To do that we need to convert each player’s results in both Pass Ratio and Relative ANY/A into Z-scores.

For Pass Ratio, the average for this group of 200 players was 102.5%, and the standard deviation was 6.7%. So for Smith, whose teams passed on 93.6% of plays, he has a Z-Score in the Pass Ratio variable of -1.33, since his teams were 1.33 standard deviations below average (102.5% minus 93.6% is 8.9%, and 8.9% divided by 6.7% is 1.33). For Relative ANY/A, the average was +0.35 and the standard deviation was 0.63. For Smith, he has a Z-Score in pass efficiency of -0.74, since his teams were 0.12 ANY/A below average (+0.35 minus -0.12 is 0.47, and 0.47 divided by 0.63 gives us how many standard deviations his teams were below average).

Note that the averages here for both pass quantity and quality are above average. That’s not surprising, but it is noteworthy. One, the players with the most receiving yards tended to play on better passing offenses, but we also give more weight to a player’s best seasons, which tend to come when they play with good quarterbacks who frequently pass.

The table below shows the full results for all 200 players. Here’s how to read the Jerry Rice line. He is the career leader in receiving yards with 22,895, and he played from 1985 to 2004. His average team had a RANY/A of +1.57, which was 1.91 standard deviations above average. His average team also had a Pass Ratio of 105.8% of league average, which was 0.51 standard deviations above average. Add those numbers together, and he has a Z-Score total of 2.42. [continue reading…]

{ 0 comments }

Yesterday, inspired by Doug Baldwin leaving Seattle, I looked at the top 200 players in receiving yards and measured how pass-happy that player’s average pass offense was.  For Baldwin, his teams were the 4th-most run-heavy teams of any player on that top 200 list, which obviously disadvantaged him from putting up big numbers.

One thing that helped him, of course, was playing with a great quarterback.  Baldwin’s Seahawks were, on average, 0.65 ANY/A better than average.  That ranks 57th among the 200 players.

Regular readers may recall that I used this methodology to grade receivers last year.  So consider today’s post an update for 2018. Among players who were active in 2018, Rob Gronkowski (+1.50) and Jordy Nelson (+1.38) played on the best passing offenses, and DeAndre Hopkins (-0.39) and Larry Fitzgerald (-0.32) played on the worst passing offenses relative to league average. That isn’t going to be breaking news to anyone, but that’s not the point: yes, we know that the Patriots and Packers have had good passing offenses, and the Texans and Cardinals have not. But quantifying those terms is always helpful.

The full results, below: [continue reading…]

{ 1 comment }

A sight Seahawks fans loved to see.

Doug Baldwin was released by the Seahawks yesterday due to multiple injuries that leaves his career in doubt. It is not expected that he will ever play in the NFL again, and if this truly is the end, it was a special run for a unique player.

Baldwin will be remembered as a Seahawks great, one of the engines of the best era in Seattle’s history.  He was an undrafted free agent out of Stanford, and while he wasn’t quite Rod Smith, Wes Welker, or Drew Pearson, he can make a reasonable case as being one of the top 10 or so wide receivers to get overlooked in the draft.

But when we look back on his career, his statistics won’t tell much of a story.  With just 6,563 career receiving yards, he will get lost with the many of talented wide receivers in pro football history.  Even in the postseason, Baldwin’s 734 yards and 6 touchdowns in 13 games won’t quite stand out. [continue reading…]

{ 0 comments }

Yesterday, I noted that in 2018, Josh Rosen produced one of the least valuable passing seasons ever. One reason that Rosen had so much negative value attributed to his stats is because he took 80% of all Arizona dropbacks last year. So while Rosen was bad, the results look different if we examine things on the team level.

In fact, two other Cardinals passing attacks were worse. In 2012, Arizona had three passers with over 180 dropbacks — John Skelton, Kevin Kolb, and Ryan Lindley — and a fourth (Brian Hoyer) with 57 dropbacks. Collectively, the group averaged 3.42 ANY/A (compared to 3.68 in 2018). The league average was 5.93 that season (and 6.32 last year), and Arizona had a whopping 666 pass plays that season. As a result, the 2012 Cardinals finished 1,672 adjusted net yards below average, the second worst in NFL history. (The 1999 Cardinals, with Jake Plummer, also check in as slightly worse than the 2018 Cardinals; more on them in the table below). [continue reading…]

{ 0 comments }

Last year, I looked at the worst passing seasons in NFL history as measured by the amount of Adjusted Net Yards each passer produced relative to league average. The worst season of all time — which is heavily influenced by the number of pass attempts a quarterback has — belonged to Blake Bortles in 2014.

Well, in 2018, a rookie Josh Rosen nearly beat him. Rosen averaged just 3.53 ANY/A last year, relative to a leauge average ANY/A of 6.32. That’s 2.79 ANY/A below average, and over 438 dropbacks, that means Rosen produced 1,221 Adjusted Net Yards fewer than league average. He was worse relative to league average than Bortles was in 2014, but since he had fewer attempts, he now comes in with the second least valuable season.

The full list of the 100 worst passing seasons (without pro-rating for games played) is below.

RkQuarterbackYearTeamANY/ALgAvgDropbacksRANY/AValue
1Blake Bortles2014jax3.816.14530-2.33-1234
2Josh Rosen2018crd3.536.32438-2.79-1221
3DeShone Kizer2017cle3.695.91514-2.21-1138
4David Carr2002htx3.245.35520-2.11-1096
5Jake Plummer1999crd2.65.18408-2.59-1055
6Archie Manning1975nor1.384.04387-2.66-1030
7Brock Osweiler2016htx4.346.22537-1.88-1007
8Blaine Gabbert2011jax3.685.9453-2.22-1007
9Bobby Hoying1998phi1.435.31259-3.88-1004
10JaMarcus Russell2009rai2.315.65279-3.34-931
11Jimmy Clausen2010car2.985.73332-2.75-913
12Joe Flacco2013rav4.55.87662-1.37-910
13Kerry Collins1997car2.945.16408-2.22-907
14Ryan Leaf1998sdg1.935.31267-3.38-904
15Vinny Testaverde1988tam3.275.02499-1.75-872
16Ryan Fitzpatrick2008cin3.585.7410-2.13-872
17Jon Kitna2001cin3.765.19606-1.43-867
18Joe Kapp1970nwe0.684.16246-3.47-854
19Kyle Orton2005chi3.25.34398-2.14-852
20Dan Pastorini1981ram-0.125166-5.12-850
21Jack Trudeau1986clt3.054.96446-1.9-849
22Kordell Stewart1998pit3.585.31491-1.73-848
23Jack Jacobs1948gnb0.024.61184-4.59-844
24Jake Plummer2002crd3.865.35566-1.49-844
25Jim Plunkett1972nwe2.154.28394-2.13-841
26Andrew Walter2006rai2.785.38322-2.6-836
27A.J. Feeley2004mia3.445.63379-2.2-833
28Geno Smith2013nyj4.175.87486-1.7-828
29Derek Carr2014rai4.826.14623-1.32-822
30Alex Smith2005sfo1.115.34194-4.23-821
31Chris Weinke2001car3.745.19566-1.45-821
32Dave Brown1996nyg3.35.14447-1.83-820
33Jeff Komlo1979det2.64.61408-2.01-819
34Matthew Stafford2009det3.645.65401-2.01-807
35Terry Bradshaw1970pit0.864.16243-3.3-802
36Vince Evans1981chi3.275459-1.73-793
37Joe Ferguson1984buf2.935379-2.08-788
38Trent Dilfer1995tam3.715.41462-1.7-787
39Rusty Hilger1988det2.695.02337-2.33-785
40Jared Goff2016ram2.826.22231-3.39-784
41Eli Manning2013nyg4.555.87590-1.33-783
42Craig Whelihan1998sdg2.985.31335-2.33-782
43Bob Lee1974atl0.063.91203-3.85-781
44Gary Marangi1976buf0.994.07254-3.07-781
45David Carr2005htx3.775.34491-1.58-774
46Mark Malone1987pit2.855.04354-2.19-774
47Trent Dilfer2007sfo2.375.52246-3.14-773
48Mark Sanchez2012nyj4.365.93487-1.57-766
49Jake Delhomme2009car3.425.65344-2.22-765
50Brett Hundley2017gnb3.715.91345-2.2-759
51Joey Harrington2003det3.865.2563-1.34-754
52Stan Gelbaugh1992sea2.314.88289-2.57-744
53Joe Theismann1985was2.664.86338-2.2-744
54Matt Cassel2009kan4.265.65535-1.38-741
55Ryan Lindley2012crd1.895.93183-4.04-740
56Dan Pastorini1973oti1.583.89320-2.31-739
57Kyle Boller2004rav4.165.63499-1.47-734
58Akili Smith2000cin2.815.21303-2.39-726
59Charlie Frye2006cle3.725.38437-1.66-724
60Kelly Stouffer1992sea1.544.88216-3.34-722
61Carson Wentz2016phi5.096.22640-1.12-720
62Jeff George1991clt3.865.18541-1.32-716
63Randy Hedberg1977tam-3.213.55105-6.76-709
64Steve DeBerg1978sfo1.834.03319-2.2-701
65Joe Namath1976nyj1.224.07246-2.85-700
66Ryan Leaf2000sdg3.225.21353-1.98-700
67Mike Phipps1973cle1.863.89343-2.03-696
68Joe Flacco2017rav4.715.91576-1.2-691
69Drew Bledsoe1995nwe4.375.41659-1.05-689
70Dennis Shaw1971buf1.813.93324-2.12-686
71Steve Fuller1979kan2.384.61307-2.23-685
72Kim McQuilken1976atl-0.94.07138-4.96-685
73Bubby Brister1995nyj1.745.41186-3.67-683
74Josh Allen2018buf4.376.32348-1.95-679
75Donovan McNabb1999phi2.415.18244-2.77-675
76Rick Mirer1995sea3.855.41433-1.56-674
77Troy Aikman1989dal3.095.24312-2.15-672
78David Archer1985atl2.974.86355-1.89-671
79Greg Landry1969det1.154.67190-3.52-668
80Derek Anderson2009cle2.195.65193-3.46-667
81Josh McCown2014tam4.36.14363-1.84-666
82Josh Freeman2011tam4.765.9580-1.14-664
83Mike Phipps1975cle2.094.04341-1.95-664
84Bobby Douglass1969chi1.094.67185-3.58-662
85Mark Rypien1993was3.165.11335-1.96-656
86Rick Mirer1993sea3.895.11533-1.22-653
87Cliff Stoudt1983pit3.495432-1.5-650
88Blake Bortles2016jax5.236.22659-0.98-649
89Boomer Esiason1992cin2.74.88297-2.18-648
90Bobby Douglass1971chi1.393.93255-2.54-648
91Randall Cunningham1986phi2.664.96281-2.3-646
92Tobin Rote1959det0.654.59162-3.93-637
93Marc Bulger2008ram4.385.7478-1.33-634
94Hugh McCullough1940crd-2.92.55116-5.45-632
95Vinny Testaverde1991tam3.455.18361-1.74-627
96Sam Bradford2010ram4.735.73624-1-624
97Rick Norton1969mia0.484.23166-3.76-624
98Marc Bulger2007ram4.025.52415-1.5-621
99Richard Todd1976nyj0.824.07191-3.24-619
100Ronnie Cahill1943crd-2.543.12109-5.66-617
{ 0 comments }

One of my favorite articles was written back in 2012, and the idea began during my law school days.

One of my law school professors was very quirky, even by law school professor standards. His preferred examination method was multiple choice, but with a twist. After grading each exam, he would then divide the students into quarters based on their test score. He would then re-examine each question, and measure how the top quarter of students performed on each question relative to the bottom quarter. Any question that more bottom-quarter students answered correctly than top-quarter students would be thrown out, and the exam would be re-graded. As he delicately put out, ‘if the wrong students are getting the question right, and the right students are getting the question wrong, it’s a bad question.’

NFL passing records are falling for a variety of reasons these days, including rules changes and league policies that make the passing game more effective. But there’s another reason: for the first time in awhile, the right people are throwing the most passes in the league. And there’s no better example of that than Drew Brees. Since coming to the Saints in 2006, he’s ranked 1st or 2nd in pass attempts four times, and ranked in the top three in net yards per attempt four times. But even since ’06, we’ve seen the passing game evolve, as the best quarterbacks are now the most likely ones to finish near the top of the leaderboard in pass attempts. In 2010, Peyton Manning had his first 600-attempt season… when he threw 679 passes for the Colts. Tom Brady threw 611 passes last year for the 13-3 Patriots, making New England one of just three teams to threw 600 pass attempts and win 13 or more games in a season. The other two teams? The ’09 Colts and the ’11 Saints.

In this early 1970s, the best passing teams often didn’t throw very often. In 1972, the top four teams in ANY/A — the Dolphins, Redskins, Giants, and Jets — all ranked in the bottom half of the NFL in pass attempts. And as I wrote in a 2014 update, there is a way to measure whether the best passing teams in the NFL are also the most frequent passing teams:

[W]hen we say the average completion percentage in the NFL is 61.2%, this is generally assumed to reflect the fact that in 2013, there were 18,136 passes thrown in the NFL, and 11,102 of them were completed.

An alternative method of measuring completion percentage in the NFL is take the average completion percentage of each of the 32 teams. That number won’t be very different, but it won’t be identical, either. The difference, of course, is that this method places the same weight on each team’s passing attack when determining the league average. The former, more common method, means that the Cleveland Browns make up 3.755% of all NFL pass attempts and the San Francisco 49ers are responsible for only 2.299% of the league-average passing numbers. The latter method puts all teams at 3.125% of NFL average.

Believe it or not, that background presents an interesting way to look at how the NFL has become more of a passing league.

For example, let’s look at the 1972 season. Miami led the NFL in points scored and in rushing attempts, while ranking 24th out of 26 teams in pass attempts. Does this mean the Dolphins weren’t a good passing team? Of course not; in fact, Miami had the highest Adjusted Net Yards per Attempt average of any team that season! That year, only two teams threw over 400 passes: New England and New Orleans. And both teams were below-average in ANY/A, with the Patriots ranking in the bottom three.

In 1972, the average pass in the NFL gained 4.28 Adjusted Net Yards. But an average of each team’s ANY/A average was 4.34, because good passing teams like Miami and Washington passed less frequently than bad passing teams like New England and New Orleans. The league-wide average was only 98.5% of the “average of the averages” average; whenever that number is less than 100%, we can conclude that the better passing teams are passing less frequently.

The graph below shows the passing data for the 32 teams in the NFL in 2018. The X-Axis shows each team’s Adjusted Net Yards per Attempt average; the Y-Axis shows each team’s number of dropbacks (pass attempts plus sacks). In a league where the teams with the best quality of passing attacks also have the most quantity of pass plays, the data will generally fit a line that slopes up and to the right. That’s not quite the case here, but there is a positive relationship between the two variables. Yes, the Saints were very efficient but didn’t pass very often, but the Chiefs led the NFL in ANY/A and were 12th in passing dropbacks, while the Falcons were 3rd in ANY/A and 5th in dropbacks. And the bottom three teams in dropbacks — the Jets, Bills, and Cardinals — all ranked in the bottom 10 in ANY/A.

In 2018, the NFL as a league averaged 6.32 ANY/A. However, if you average the ANY/A averages of each of the 32 teams, you get an average of 6.29. This means the average ANY/A was equal to 100.5% of the “average of the averages” ANY/A; that result only exceeds 100% when the better passing teams pass more frequently than the weaker passing teams. Twenty years earlier, in 1998, the league as a whole averaged 5.31 ANY/A, but an average of each team’s ANY/A would give you a result of 5.34. That’s because by assigning the same weight to each passing offense, you would have a higher result in 1998 than if you weighted efficiency by pass attempts because in 1998, weaker passing teams passed more often than stronger passing teams.

The graph below shows the relationship between these two variables. In short, it shows for each season since 1970, the league-wide ANY/A average divided by the ANY/A average for each of the teams in the league that year. A result of more than 100% means the better passing teams passed more often than the weaker passing teams.

Pretty neat, right? And at least in 2018, the better passing teams passed more often than the weaker passing teams.

{ 1 comment }

The Best Players To Change Teams In 2018

Who were the best players to change teams last season? The Oakland Raiders lost three of them, with varying degrees of fanfare. Oakland traded Khalil Mack to the Bears, and the outside linebacker wound up having a dominant season in Chicago. Mack was drafted with the 5th overall pick by Oakland in 2014; at the end of the draft, the Raiders signed Denico Autry as an undrafted free agent. He had a good four-year run in Oakland, and then signed a three-year, $17.8M contract with the Colts after the 2017 season. As it turned out, 2018 was Autry’s breakout year, putting together 9 sacks in 12 games.

And then, in the middle of the season, Oakland traded Amari Cooper to the Cowboys, and the wide receiver played like a superstar during his 9-game run in Dallas.

The table below shows all players who switched teams in 2018 who produced at least 5 points of AV last year. [continue reading…]

{ 0 comments }

In 2008, four undrafted quarterbacks were leading potential playoff teams in Kurt Warner, Jake Delhomme, Jeff Garcia, and Tony Romo.  Warner’s Cardinals made the Super Bowl, Delhomme’s Panthers went 12-4, Garcia went 6-5 for the Bucs, and Romo went 8-5 for the Cowboys.  A fifth undrafted quarterback, Shaun Hill, went 5-3 for the 49ers.

The undrafted quarterback era seemingly disappeared, but is it on its way back? Nick Mullens had one of the best seasons by an undrafted free agent rookie quarterback last year.  Only two other rookie UDFAs started games last year, one apiece by the two Panthers backups (Taylor Heinicke and Kyle Allen). And while it was an ignored week 17 game, Allen played extremely well.

Highly drafted rookies get a chance to stink for a very long time — think of the awful rookie seasons of Blake Bortles, Josh Rosen, Derek Carr, or Jared Goff.  But we don’t have a very large sample when it comes to lowly regarded prospects who play poorly. [continue reading…]

{ 1 comment }

I calculated the Adjusted Net Yards per Attempt averages for every quarterback for every season in NFL history. I then calculated each quarterback’s Relative ANY/A, which is their ANY/A relative to league average. I wanted to then plot the big four quarterbacks of this era — Peyton Manning, Tom Brady, Drew Brees, and Aaron Rodgers — to see how they fared (after excluding seasons where the quarterback didn’t have enough pass attempts to qualify for the passing crown). I’ll leave the commentary to you guys, and I’ll just present the data in three different graphs.

First, let’s do it by chronological year. This means Manning’s graph starts early but ends, while Rodgers doesn’t get started until 2008. I have used blue/white for Manning, red/blue for Brady, gold/black for Brees, and green/gold for Rodgers.

[continue reading…]

{ 1 comment }

Matt Ryan Is Building A Hall of Fame Career

Matt Ryan has had the unfortunate luck of playing in an area with Tom Brady, Drew Brees, Peyton Manning, and Aaron Rodgers, four quarterbacks who will go down as among the 15 or so best to ever play the position. Manning entered the NFL in ’98, Brady in ’00, and Brees in ’01; Ben Roethlisberger, another very likely future HOFer, was drafted in ’04, and then Rodgers in ’05.

But then there’s a gap.

The best quarterback drafted in ’06, by far, was Jay Cutler.
There are no quarterbacks of note from 2007, the year JaMarcus Russell and Brady Quinn were first round picks.
Ryan was drafted in 2008, as was Joe Flacco.
In 2009, we have Matthew Stafford and Mark Sanchez.
In 2010, it’s Sam Bradford and nothing else.
In 2011, we get Cam Newton and Andy Dalton. We probably should have seen Russell Wilson, and Andrew Luck nearly declared this year but did not.

As a result, when we look at the 6-year period from 2006 to 2011, Ryan and Newton stand out as the best quarterbacks of that era. And at this point in time, Ryan is the heavy favorite to finish his career as the best quarterback to enter the league during this 6-year period.

And that’s because there’s no reason to think Ryan won’t age very well. He entered the league at age 23, and just finished his 11th (age 33) season. Ryan also has thrown for the most yards in history during any players age 23 through 33 seasons.

Will Ryan get to 70,000 passing yards? Right now, only four players have done that — Brett Favre, Brady, Manning and Brees. Ryan has not been at that caliber, but it would require just 23,280 yards the rest of his career. At this point in time, I would suggest that he’s more likely than not to get there. [continue reading…]

{ 1 comment }

Jameis Winston and Marcus Mariota have been linked together for a long time.

In college, Jameis Winston was the 2013 Heisman Trophy winner, and his Florida State team won the college championship that season. The next season, Marcus Mariota won the Heisman Trophy Winner and his Oregon Ducks knocked Winston and the Seminoles out of the playoffs.

The two quarterbacks then were selected as the first two picks in the 2015 Draft. Who was the better prospect? That was a tough debate for many analysts to answer. Four years later, the question of who is the better pro quarterback is just as difficult to solve.

Both have been average starters in the NFL. There have been 32 quarterbacks to throw 800+ passes since Winston and Mariota entered the NFL. Of those passers, Winston ranks 17th in ANY/A and Mariota ranks 20th. Stylistically, the two quarterbacks are very different: Mariota takes a ton of sacks (he has the 5th-worst sack rate of those 32 quarterbacks; Winston is square in the middle at 16th), while Winston throws a lot of interceptions (he has the 2nd-worst INT rate) but also is a deep thrower (he has the 3rd-best yards/completion rate).

But perhaps the biggest discrepancy between the two players through four years is their records. Mariota is an average 27-28, but that’s dragged down by a 3-9 rookie season; he has been slightly better than .500 every year since. Winston, meanwhile, has a 21-33 record; his 0.389 winning percentage is the 4th-worst of those 32 quarterbacks.

But how they got to those records tells a pretty revealing story. Mariota has started 55 games and has produced a 6.16 ANY/A average in those starts, while Winston has started 54 games and averaged 6.34 ANY/A. I calculated each quarterback’s ANY/A average in each game, and then combined those games into groups: an ANY/A of 0 to 0.99, 1 to 1.99, 2 to 2.99, etc. Then, I checked to see how many games under or over .500 each quarterback was in each group.

That’s shown below, with Winston’s numbers in orange and Mariota’s in blue.  I have also included each quarterback’s full record for each category of games.  For example, take a look at the graph below and look in the middle for the 7 on the X-Axis.  This is all games where the quarterbacks averaged between 7 and 7.99 ANY/A.  Mariota is four games over .500 in those games, going 4-0.  Winston is two games over .500 in those games, going 5-3.

The biggest outliers concern Winston, particularly at the 6 and 10 marks.  For Winston, he is 3-7 when averaging between 6 and 6.99 ANY/A, while Mariota is 4-5.  More striking, perhaps, is at the 10-10.99 ANY/A mark: Winston there is 0-3!  (Those losses were to Carolina, Washington, and Atlanta.) Mariota, meanwhile, is 7-1 when in games with an ANY/A of 9.00 or better. [continue reading…]

{ 0 comments }
Previous Posts