≡ Menu

2017 Sloan Sports Analytics Conference

I’ll be speaking at one of the panels at this year’s Sloan Sports Analytics Conference. The panel is titled “Football Analytics: Please Stop Punting” and I’ll be joining Mike Lombardi, John Urschel, and Sandy Weil in a general discussion about football analytics and ways to improve the game. I suspect that I am up to the task, but to the extent I am not, moderator Bill Barnwell should keep me in line.

If you’re attending, give me a shout.

{ 5 comments }

It’s not easy to gain recognition as an offensive lineman. It’s even harder to do so as a center. And it’s almost impossible to do it as a center on a bad offense.

Travis Frederick of the Cowboys was the first-team All-Pro center in 2016, based on voting from the AP, PFW, and PFF. Alex Mack of the Falcons was the 2nd-team choice from the APP and PFF. Dallas and Atlanta, of course, had two of the best three offenses in the NFL this year.

Since the merger, 31 of the 47 first-team All-Pro centers (based on the AP team) played for teams that ranked in the top 10 in passing efficiency, as measured by Adjusted Net Yards per Attempt. Just five of the 47 selections played for offenses that ranked 20th or worse in ANY/A, and all five played for the Jets or Steelers: Mike Webster (1983, Pittsburgh, 26th), Dermontti Dawson (1998, Pittsburgh, 28th), Kevin Mawae (1999, Jets, 20th), Mangold (2009, Jets, 27th), and Mangold again (2010, Jets, 20th). Here’s where the AP 1AP center’s team ranked in ANY/A each year: [continue reading…]

{ 1 comment }

For his career, Jay Cutler is 68-71, which would put him just a hair below .500. He’s also 1-1 in the playoffs.

For his career, Jay Cutler has averaged 5.88 Adjusted Net Yards per Attempt, while the league average over that span has been 5.85 ANY/A, putting him just a hair above average.

Cutler wasn’t drafted to be league average, and he’s been a polarizing player for much of his career. He hasn’t quite fulfilled the high potential he had as a prospect, but he’s also been a bit better than the critics suggest, too. He’s not great, he’s not bad, he’s… average.

One thing that’s kind of interesting: his record hasn’t really correlated with his passing efficiency numbers. The correlation coefficient between his Relative ANY/A — that is, his ANY/A minus league average — and his winning percentage is just 0.21. [continue reading…]

{ 19 comments }

The 2015 Cowboys and One Strike Out Wonders

In 2014, Dallas, behind Tony Romo, went 12-4 (and 12-3 in Romo starts).

In 2015, with Matt Cassel, Brandon Weeden, and Kellen Moore, the Cowboys went 4-12 (and 3-1 in Romo games).

In 2016, Dallas, with Dak Prescott at quarterback, went 13-3.

So Dallas saw the team’s win total drop by 8 games from ’14 to ’15, and then bounce back up by 9 more games.  That’s an average change of 8.5 wins, even more extreme than the Panthers change (in the other direction) we discussed yesterday.

Of course, given the quarterback changes in Dallas, it’s not super surprising to see that big swings in wins totals.  The Cowboys are the 3rd team to have an average win swing of 8.5 wins over a 3-year period, with the middle year being really bad. The first two also happened pretty recently:

  • In 2012, the Texans (with Matt Schaub) went 12-4; in ’13, Schaub’s performance fell through the floor, and Houston went 2-14 (-10). The next year, with Ryan Fitzpatrick, Houston went 9-7 (+7).

[continue reading…]

{ 6 comments }

The 2015 Carolina Panthers and One Hit Wonders

The 1999 Rams weren’t a fluke. They were a shocking team that went from terrible to excellent overnight, but their success in 2000 and 2001 proved that the team wasn’t a fluke.

The 2015 Panthers? That may be a different story.  In 2014, Carolina went 7-8-1, before winning 7.5 more games (counting a tie as half a win) in 2015 as part of a magical 15-1 season.  Last year, Carolina’s win total dropped by 9 games to 6-10. That means the Panthers 2015 season was, on average, 8.25 wins better than how the team performed in the two surrounding years.

How does that stack up among all teams since the merger? Well, it’s the second biggest outlier since 1970.  Can you guess the first? [continue reading…]

{ 14 comments }

Welcome to the 2017 Offseason

Welcome to the offseason. It was another long year, but a good one, here at Football Perspective.

There should be some exciting news to announce in the coming weeks, and that may keep the posts here short. This would be a great time for guest submissions, so if you would like something posted here, don’t hesitate to send. Otherwise, what sort of content are you hoping to see this offseason? Now is the time for all the crazy ideas and topics on your mind, so let ’em rip.

Chase

{ 30 comments }

What Is The Market Value For Jimmy Garoppolo?

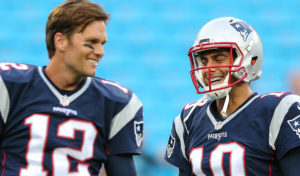
The Patriots leader in passer rating in 2016, and Tom Brady

If you were an NFL team in need of a quarterback, you would certainly be interested in trading for Patriots backup Jimmy Garoppolo. The big question, of course, is what is he worth?

Garoppolo was the 62nd overall pick in the 2014 Draft. If he never took a snap between now and then, his market value would presumably have dropped. He, like all second round picks, signed a four-year deal, with cap hits of $633,436 in 2014, $791,795 in 2015, $950,154 in 2016, and $1,108,513 in 2017. If Garoppolo turns into even a serviceable NFL quarterback, his salary cap hit will go up astronomically, and his next contract could be somewhere in the range of $15M to $20M per year against the cap. An enormous part of the value of a draft pick is the four cost-controlled seasons; with Garoppolo, three of those are already toast. So while you could argue that a quarterback who sat for three years would likely be a better player in year 4 than a rookie quarterback, Garoppolo’s market value would still drop — significantly, I think — by virtue of having him on a cheap one-year deal versus having a rookie on a cheap four-year deal.

But, as we know, Garoppolo has played since being drafted. And while he didn’t do much his first two seasons, throwing for 188 yards on 31 passes, Garoppolo averaged 8.59 ANY/A on 66 dropbacks last season. Anecdotally, too, it seems as though the league views him as a strong prospect, giving him a higher grade than they did three years ago when he slipped to the end of round two. [continue reading…]

{ 41 comments }

Todd Gurley, Jay Ajayi, and Running Back Variation

In yesterday’s post about Frank Gore, I lauded Gore’s remarkable consistency, year after year. But his consistency — for better or worse — is also true game after game. Gore pulled off a tough feat in 2015, rushing for 967 yards while failing to record a single 100-yard game. Last year, he rushed for 1,025 yards and while he topped the century mark twice, he gained just 101 and 106 yards in those games.

How consistent is Gore? Well, not as consistent as Todd Gurley (again, for better or worse: consistency is neither inherently good or bad). I looked at all running backs who averaged at least 50 rushing yards per game and had 700 rushing yards last year. In the graph below, on the X-Axis I have plotted rushing yards per game; on the Y-Axis is each player’s standard deviation in rushing yards across all 2016 regular season games. Gurley, as you can see, is the “lowest” on the graph, although he’s also really far to the left (because his average wasn’t very high). In general, the running backs who gain more yards are less consistent, which is just a residue of how standard deviation works. One interesting counter to that: Ezekiel Elliott. [continue reading…]

{ 8 comments }

Frank Gore Isn’t Aging

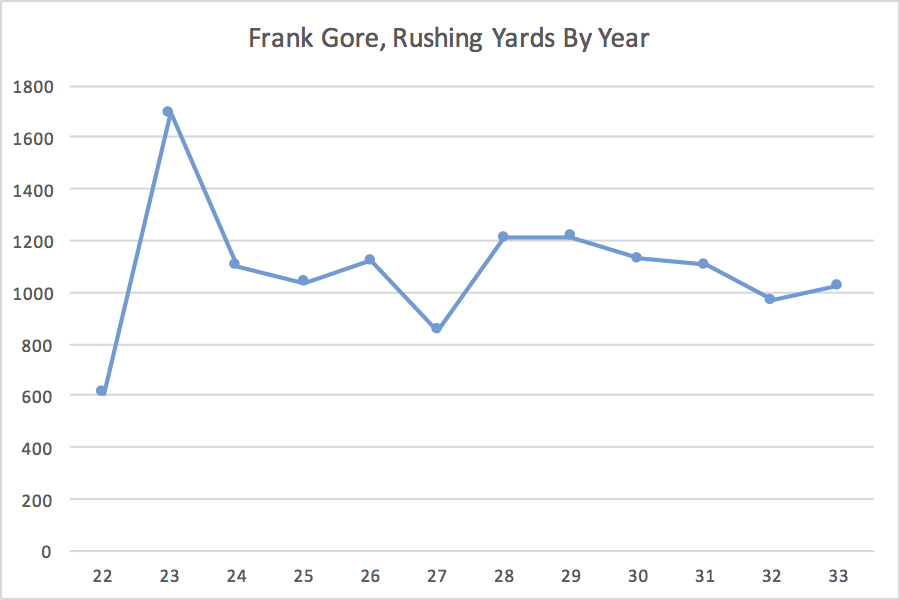
Since turning 28 years old, Frank Gore has rushed for 6,651 yards. That’s the 4th most rushing yards from age 28+ in NFL history.  Gore has also hit the 1,000-yard mark in 5 seasons since turning 28, tied with Emmitt Smith for the most ever.   Here’s Gore’s year-by-year rushing totals:

[continue reading…]

{ 24 comments }

Terrell Owens, and Career Receiving Leaders and the HOF

Howton soars for a reception

On September 29th, 1963, Billy Howton recorded a 14-yard catch against the Redskins. That gave him an even 8,000 career receiving yards, breaking the long-standing record held by Don Hutson (7,991). Through the end of the 1965 season, Howton was still the career leader in receiving yards. Howton, of course, is not in the Pro Football Hall of Fame.

For a decade, Charlie Joiner ranked in the top 3 in career receiving yards, including a first- or second-place ranking from ’84 through ’90.  As of the end of the 1986 and 1987 seasons, it was Joiner who was the all-time leader in receiving yards. Joiner was passed over by the Hall of Fame four times, before being inducted on his fifth try.

James Lofton ranked in the top 3 in receiving yards from ’90 to ’06.  He ranked 1st or 2nd in each year from ’91 through ’01, and 1st in 1992, 1993 (the year he retired), and 1994. Lofton did not make the HOF until his fifth try, too.

And then there’s Don Maynard.  On December 1, 1968, Maynard caught 7 passes for 160 yards and 3 touchdowns in front of the home fans at Shea Stadium.  In the process, he broke Raymond Berry‘s career record for receiving yards.  A month later, the Jets would win the Super Bowl.  It wasn’t until October 6, 1986, 18 years later, that Joiner finally moved Maynard out of the top spot in the record books.  Yet it took Maynard nine years to get inducted in the Hall of Fame.  Here’s a record that won’t ever be broken: it wasn’t until 19 years after he broke the career yardage record that Maynard was inducted into the Hall of Fame.

Howton, Joiner, Lofton, and Maynard all were the career leaders in receiving yards at one point in their careers, and none of them were inducted into the Hall of Fame on their first, second, third, or fourth ballots.  So while Terrell Owens is a deserving Hall of Famer, it’s hard for me to call this an unprecedented oversight that Owens — who has ranked 2nd in career receiving yards since 2010 — didn’t make it to Canton on his first or second try. [continue reading…]

{ 29 comments }

Hall of Famers on Multiple Teams

Terrell Owens in the uniform he wore most often

With the Hall of Fame failing to elect Terrell Owens to the Hall of Fame this year, much of the discussion in the media has centered around the fact that Owens bounced around the league for much of his career. That made me wonder: where does Owens stand when it comes to the Hall of Fame and playing for multiple teams?

Owens has a Career AV [1]I am using perceived AV throughout this post, which assigns 100% credit to a player’s best season, 95% credit to his second best season, 90% to his third best, and so on. of 119. That was split as follows (any discrepancies due to rounding):

  • 74 points of AV, or 62% of his career AV, came with the 49ers;
  • 28 points of AV, or 24%, came with the Cowboys;
  • 11 points of AV, or 9%, came with the Eagles;
  • 4 points of AV, or 3%, came with the Bengals; and
  • 3 points of AV, or 3%, came with the Bills.

It is pretty rare for a player to make the Hall of Fame and lace up for five different teams, although there are already two wide receivers in Canton who can make that claim.  But we’ll get to that at the end of this post.

Where Does Having “Just” 62% of Your Career AV With One Team Rank?

There are 20 Hall of Famers who failed to eclipse 62% of their career AV with one team, including guys like Marshall Faulk, Reggie White, and Deion Sanders. A number of players, including 2017 selection Kurt Warner, barely eclipsed 50% with one team, with Curley Culp and Eric Dickerson the two lowest players at 51%. [continue reading…]

References

References
1 I am using perceived AV throughout this post, which assigns 100% credit to a player’s best season, 95% credit to his second best season, 90% to his third best, and so on.
{ 6 comments }

With the 2nd pick in the 2nd round of the 2016 Draft, the Cowboys drafted Notre Dame linebacker Jaylon Smith at 34th overall.  Smith tore his ACL and MCL in the Fiesta Bowl, but Dallas was willing to take the risk with by giving Smith a redshirt season.

With the 41st pick, Buffalo traded up for linebacker Reggie Ragland, who wound up missing his entire rookie season after tearing the ACL in his left knee in training camp. With the 50th pick, Houston drafted offensive lineman Nick Martin, who also was injured in training camp and wound up missing his entire rookie year.

Those three players, and Bengals first round pick William Jackson (who tore his pec in August), were four of the five players selected in the first two rounds of the 2016 Draft who failed to see the field. Jets second round pick, quarterback Christian Hackenberg, was the fifth.

That makes Hackenberg the 17th quarterback since the common draft (1967) to fail to make the field as a rookie despite being drafted in the first or second round. For the most part, that’s because those quarterbacks were behind entrenched starters. [continue reading…]

{ 2 comments }

More Thoughts On Pick Sixes

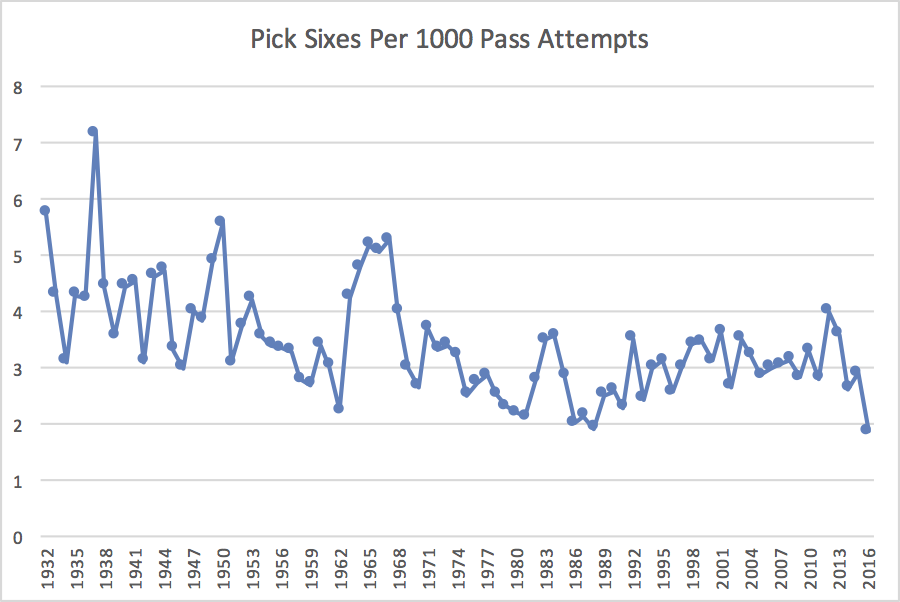
Four years ago, I wrote that interceptions were being returned for touchdowns at a much higher rate. As it turns out, that may have just been a blip: the 2012 season set a record for both pick sixes and pick sixes per interception.

We can look at pick sixes in a few ways. On Monday, I noted that on a per-game basis, interceptions per game were down to near-historic lows. Given that pass attempts are way up, you won’t be surprised to learn that pick sixes per attempt are really, really down.

The graph below shows the number of interceptions returned per 1,000 pass attempts throughout NFL history. Last year was the lowest in history, at 1.86; thought of another way, there was just one pick six for every 538 pass attempts.

[continue reading…]

{ 4 comments }

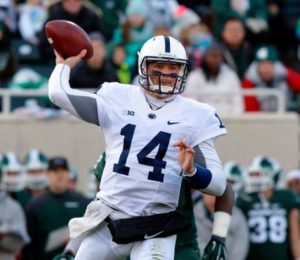
A rare sighting: Christian Hackenberg throwing a pass for the Jets

Penn State quarterback Christian Hackenberg was a very polarizing prospect. Pro Football Focus called him undraftable, and he ranked as the 2nd-worst quarterback in college football in 2014.

But there’s one thing we know: at least someone in the Jets organization really liked him. That person, presumably, is general manager Mike Maccagnan, although it’s likely that head coach Todd Bowles and now-retired offensive coordinator Chan Gailey (and perhaps owner Woody Johnson) had positive thoughts about Hackenberg, too. We know this because the Jets drafted Hackenberg with the 51st pick in the 2016 Draft, so obviously New York wanted him on the team.

Hackenberg was stuck behind Ryan Fitzpatrick, Geno Smith, and Bryce Petty as a rookie.  He was the fourth string quarterback for much of the year, so even once Smith and Petty were hurt, Hackenberg never had enough reps to make him prepared to take the field over Fitzpatrick even in the season finale.

So where do the Jets (which I am using as a stand in for Maccagnan, or a combination of Maccagnan and Bowles) stand on Hackenberg now? There are a few possibilities: [continue reading…]

{ 14 comments }

Passing Yardage Will Always Be For Lovers

Passing is for lovers

There have been 44 quarterbacks in NFL history to throw for at least 30,000 yards. Given enough time, you could probably guess that Drew Bledsoe, Jim Kelly, and Steve McNair are three of them. All three have something else in common: they were all born on February 14th.

If we drop the cut-off to 16,000 yards, we jump to 137 quarterbacks but get to include David Garrard, another Valentine’s Day baby. But wait, there’s more: If we drop the threshold to 3,500 passing yards, we get to include Patrick Ramsey and Anthony Wright. Those guys may not impress you, but consider that only 334 players have thrown for 3,500 yards. That means dozens of days have zero quarterbacks with 3,500 yards — including New Year’s Day, Cinco De Mayo, Halloween, and Christmas Eve — so slotting in Ramsey and Wright as QB5 and QB6 on your birthday dream team is pretty damn good. [continue reading…]

{ 2 comments }

Return Touchdowns Were Way Down in 2016

Most years, there are about 3.5 to 4.0 return touchdowns per team season in the NFL, or about 115 in the entire NFL. But in 2016, there were just 73 return touchdowns, the fewest in a single season since 1988. I’m defining a return touchdown as a punt return, kickoff return, fumble return, or interception return for a score; this does exclude some unusual returns, such as a blocked field goal return, blocked punt return, missed field goal return, etc.

By this measure, the average team had just 2.3 return touchdowns last year. That’s a pretty unusually low number: [continue reading…]

{ 8 comments }

In 22 team games in the 2016 playoffs, just four times did a rusher crack the 100-yard mark — or even exceed 75 rushing yards.  In the Patriots three wins, their leading rusher never cracked 50 yards, and James White was three yards away in the Super Bowl from giving New England three different leading rushers in three games.

Rushing
Rk Date Tm Opp Result G# Week Att Yds
Y/A TD
1 Le’Veon Bell 2017-01-15 PIT @ KAN W 18-16 18 19 30 170 5.67 0
2 Le’Veon Bell 2017-01-08 PIT MIA W 30-12 17 18 29 167 5.76 2
3 Thomas Rawls 2017-01-07 SEA DET W 26-6 17 18 27 161 5.96 1
4 Ezekiel Elliott 2017-01-15 DAL GNB L 31-34 17 19 22 125 5.68 0
5 Devonta Freeman 2017-02-05 ATL NWE L 28-34 19 21 11 75 6.82 1
6 Lamar Miller 2017-01-14 HOU @ NWE L 16-34 18 19 19 74 3.89 0
7 Lamar Miller 2017-01-07 HOU OAK W 27-14 17 18 31 73 2.35 1
8 Tevin Coleman 2017-01-14 ATL SEA W 36-20 17 19 11 57 5.18 0
9 Russell Wilson 2017-01-14 SEA @ ATL L 20-36 18 19 6 49 8.17 0
10 LeGarrette Blount 2017-01-22 NWE PIT W 36-17 18 20 16 47 2.94 1
11 Christine Michael 2017-01-08 GNB NYG W 38-13 17 18 10 47 4.70 0
12 Ty Montgomery 2017-01-15 GNB @ DAL W 34-31 18 19 11 47 4.27 2
13 Aaron Rodgers 2017-01-22 GNB @ ATL L 21-44 19 20 4 46 11.50 0
14 Devonta Freeman 2017-01-14 ATL SEA W 36-20 17 19 14 45 3.21 1
15 Devonta Freeman 2017-01-22 ATL GNB W 44-21 18 20 14 42 3.00 0
16 Dion Lewis 2017-01-14 NWE HOU W 34-16 17 19 13 41 3.15 1
17 Latavius Murray 2017-01-07 OAK @ HOU L 14-27 17 18 12 39 3.25 1
18 Spencer Ware 2017-01-15 KAN PIT L 16-18 17 19 8 35 4.38 1
19 Thomas Rawls 2017-01-14 SEA @ ATL L 20-36 18 19 11 34 3.09 0
20 DeAngelo Williams 2017-01-22 PIT @ NWE L 17-36 19 20 14 34 2.43 1
21 Zach Zenner 2017-01-07 DET @ SEA L 6-26 17 18 11 34 3.09 0
22 Jay Ajayi 2017-01-08 MIA @ PIT L 12-30 17 18 16 33 2.06 0
23 LeGarrette Blount 2017-01-14 NWE HOU W 34-16 17 19 8 31 3.88 0
24 LeGarrette Blount 2017-02-05 NWE @ ATL W 34-28 19 21 11 31 2.82 0
25 Jonathan Grimes 2017-01-07 HOU OAK W 27-14 17 18 4 30 7.50 0
26 Paul Perkins 2017-01-08 NYG @ GNB L 13-38 17 18 10 30 3.00 0

White’s Super Bowl heroics aside — you know, he scored a record 20 points and caught a record 14 passes — New England certainly didn’t get much production from the ground game in the playoffs. Even as a team, the Patriots averaged only 86.3 yards per game in the postseason. Among the 51 Super Bowl champions, that slots in just between two other Patriots teams, giving New England three of the four Super Bowl champions that failed to crack the 90 rushing yards mark in the playoffs. But one team averaged just 37 rushing yards per game in the postseason. Can you guess? Scroll to the bottom of the table to see. [continue reading…]

{ 1 comment }

2016 Playoff Passing Numbers

These two were the top passers of the 2016 postseason

With the 2016 postseason in the books, who were the best and worst passers? There are 11 playoff games every year, and since there were no games where a starting quarterback was injured or benched during the game, that gives us 22 quarterback performances to evaluate.

The best performance belongs to Matt Ryan against the Packers in the NFC Championship Game. Ryan threw for 392 yards with 4 TDs and 0 interceptions or sacks. That’s 472 Adjusted Net Yards and it came on 38 dropbacks, which translates to a 12.42 ANY/A average. His opponent, Green Bay, allowed 6.85 ANY/A to passers this year; that means over the course of 38 dropbacks, Ryan produced 212 Adjusted Net Yards of Value above average.

Using that methodology, here are the single game playoff passing numbers from the 2016 postseason: [continue reading…]

{ 22 comments }

Jason Taylor Was An Unusual First Ballot Hall of Famer

Jason Taylor was a first ballot Hall of Famer, which was pretty surprising to a lot of folks. Let’s start with defensive ends: Andy Robustelli, Howie Long, and Michael Strahan were clear choices, but all had to wait one year before making it to Canton. Jack Youngblood, Carl Eller, and Willie Davis each made 5 Associated Press first-team All Pro teams, but all wait at least 7 years. Chris Doleman and Doug Atkins made 8 Pro Bowls, but both had to wait 8 years.

In the last 30 years, there have been 36 non-quarterbacks who have made the Hall of Fame in their first year of eligibility. Among those players, Taylor is one of only 12 with 3 or fewer 1APs. Half of those 12 were running backs, which isn’t too surprising. Like quarterbacks, running back is a position with a lot of statistics, so reputation matters less when selecting All Pros. As a result, it’s much harder for a running back to rack up a high number of 1AP teams.

The other six? Placekicker Jan Stenerud (1), wide receiver Steve Largent (1), tackle Jackie Slater (0), Taylor (3), and defensive backs Darrell Green (1) and Mel Blount (2). Taylor is also one of just 8 of the last 36 first ballot Hall of Famers with 6 or fewer Pro Bowls. Five of those 8 were running backs; the other three are Taylor (6), Blount (5), and Stenerud (6). [continue reading…]

{ 17 comments }

Bill Belichick and the Patriots won their fifth Super Bowl on Sunday. For a number of reasons, that brings up some good trivia tidbits.

Most Championships

Belichick, of course, is now the only coach with five Super Bowl rings. However, three other coaches have won more titles. Paul Brown won 7 championships, although only three NFL titles (the remaining four were in the AAFC). George Halas and Curly Lambeau each won 6 NFL titles, while Belichick is now tied with Vince Lombardi at five.

Oldest Coach

Belichick is 64 years old, making him the third oldest head coach to win it all. In 2011, Tom Coughlin and the Giants beat Belichick’s Patriots in the Super Bowl, and Coughlin was 65 years old that season. George Halas won his final title in 1963, at the age of 68. Meanwhile, Dick Vermeil was 63 years old when he won the Super Bowl with the Rams to conclude the 1999 season.

Longest Run Between Titles

Belichick’s first title came in 2001, which means he’s now won championships 15 years apart. That’s tied with Curly Lambeau for the third longest stretch: Lambeau won his first championship in 1929, and his last in 1944, with both coming with the Packers. Jimmy Conzelman won as head coach of the Providence Steam Roller in 1928 and then 19 years later with the Chicago Cardinals in 1947. The longest reign, of course, goes to George Halas at 42 years; he won championships with the Bears in both 1921 and 1963. The only other coach to win titles at least 10 years apart? Weeb Ewbank, who won with the Colts in ’58 and ’59, and then as head coach of the Jets (and against the Colts) in 1968.

Most Common Record

There have been 8 Super Bowl champions with 14-2 records, and three of them (’03, ’04, ’16) were coached by Belichick. That’s tied for the second most common record for a Super Bowl champion behind 12-4. There were 11 teams that won with that record, including Belichick’s 2014 squad. The other record to win it all 8 times was 13-3. [continue reading…]

{ 5 comments }

Wisdom of Crowds: Quarterback Edition (2017)

Adam Steele is back with some Wisdom of Crowds work. As always, we thank him for that.


In 2015 we ran a pair of Wisdom of the Crowd exercises, one for quarterbacks and one for running backs. Participation was high and the ensuing discussions were plentiful, so I decided to bring the idea back this year. First up are quarterbacks, but there will be new rules this time around. The previous edition asked voters to rank their quarterbacks 1-25, with points scored in linear fashion based on the ranking from each ballot. While that method was simple, it left a lot to be desired. Most notably, voters weren’t able to indicate the magnitude of difference between the QB’s on their lists, so the difference between 24th and 25th was worth the same as the difference between 1st and 2nd. That’s just plain wrong.

New Rules

1) Each voter will be allotted 100 Greatness Points to distribute to quarterbacks as he or she wishes, with a few caveats.

2) The maximum points given to a single QB may not exceed 25.

3) Ballots must include a minimum of ten quarterbacks, with a maximum of 40.

4) Points must be assigned as whole numbers.

Just as before, you are free to use whatever definition of Greatness you see fit. If you have trouble getting started, it’s helpful to list every quarterback that you consider Great, then distribute points based on the relative standing among the quarterback you listed. In order for this exercise to work properly, please submit your ballot before reading anyone else’s; we want each opinion to be as independent as possible. Your ballot will not be counted if the points don’t add up to exactly 100, although I will let you know and give you a chance for revision. Here is an example of how I’d like your ballot to look (of course yours may include more quarterbacks): [continue reading…]

{ 279 comments }

2016 NFL Awards: Voting Breakdown

On Saturday night, the awards were announced for the 2016 NFL season. It’s good to have a record of the voting breakdown, so in the interest of preserving history, I have reprinted that below.

Most Valuable Player

Matt Ryan, Atlanta (25); Tom Brady, New England (10), Ezekiel Elliott, Dallas (6), Derek Carr, Oakland (6), Aaron Rodgers, Green Bay (2), Dak Prescott, Dallas (1)

Ryan was a pretty obvious pick: he easily led the NFL in ANY/A and Value added over average.  I’m a bit surprised that Brady was as close as he was, but the biggest surprise was Carr somehow receiving 6 votes.  Ryan received 29 votes for the first-team All-Pro slot at QB from the same AP voters; Brady received 15, and Rodgers received 5.  Given that the quarterbacks had to compete with Elliott for MVP, it makes sense that all received more votes at the QB-specific slot than at MVP.  But then there’s Carr, who earned just 1 vote for first-team All-Pro at QB, yet received 6 here.  How five voters thought Carr wasn’t the best quarterback but was the Most Valuable Player in the NFL is a question I’m not comfortable answering.

Offensive Player of the Year

Matt Ryan, Atlanta (15½), Aaron Rodgers, Green Bay (11), David Johnson, Arizona (8), Tom Brady, New England (7), Ezekiel Elliott, Dallas (5½), Le’Veon Bell, Pittsburgh (1), Derek Carr, Oakland (1), Drew Brees, New Orleans (1)

Ryan was a worthy choice here for the same reasons he was a worthy choice for the All-Pro team and the MVP award.  There were 9.5 voters who thought Ryan was the MVP but not the OPOY; there were also 9 voters who thought Rodgers was OPOY but not MVP.  That implies a decent amount of ballot-splitting among voters.  What do we make of Ryan/Brady/Rodgers?  For the All-Pro team, the voting was 29–15–5; for MVP, it was 25–10–2; and for OPOY, it’s 15½–7–11.  That strikes me as inconsistent.  Johnson, Elliott, and Bell all received votes here, which makes some sense.  Oh, and Carr only got 1 vote here, too. [continue reading…]

{ 15 comments }

Super Bowl LI Reaction

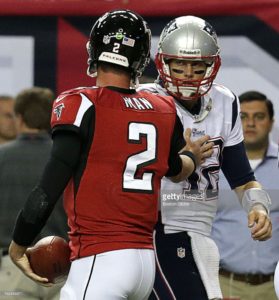
Well, Super Bowl LI is in the books. The Falcons dominated for most of the game, making it both a surprising but pretty uneventful Super Bowl — until the final 10 minutes or so. Matt Ryan had a perfect passer rating for the majority of the night, Robert Alford had a game-turning pick six late in the first half, and Grady Jarrett tied a Super Bowl record with 3 sacks.

Oh, and then New England staged the greatest comeback in Super Bowl history, and maybe the greatest comeback in NFL history? Atlanta led 28-3 with 3 minutes left in the 3rd quarter.  Atlanta led 28-9 with 10 minutes left in the game. Atlanta led 28-12 with 7 minutes left in the game. Atlanta led 28-20 with 60 seconds left in the game. And yet, somehow, the Patriots won.

Down by 16, the Patriots needed everything to go right.  And it did. The Patriots scored a touchdown, got a two point conversion, forced an Atlanta punt, scored another touchdown, got another two point conversion, forced another punt to force overtime, won the coin toss in overtime, and then scored a touchdown in overtime to win.

If it wasn’t the Patriots, it wouldn’t feel real.  With the Patriots, these unrealistic finishes seem preordained.  There had been 105 playoff games where a team trailed by at least 18 points entering the 4th quarter; teams had been 0-105.

I don’t even know where to start, so I’m going to kick it to you. What is the takeaway from Super Bowl LI?  And while I know it will mostly be Patriots-centric, what about from Atlanta’s perspective? Can they recover from this?

{ 136 comments }

Super Bowl LI: Post Your Predictions Here

The two leaders in ANY/A in 2016.

Finally, it’s here: Super Bowl LI has arrived. You can read all my Super Bowl LI articles here.

What’s your projection? Post it in the comments.

For me, I’m going Atlanta 33, New England 28. I think the Falcons offense is the best thing in this game, and the absence of Rob Gronkowski will be the difference here.

And while Julio Jones is the star, I’m going to go with Devonta Freeman as my MVP. And not because of what he will do as a rusher, but as a receiver. Seattle — the 19th team to beat bot Super Bowl teams in a season — set the blueprint. C.J. Prosise caught 7 of 7 targets for 87 yards and 5 first downs, and I don’t think the Patriots linebackers can cover Freeman (especially since safety help will be needed for Jones). Freeman will clear 140 yards from scrimmage, and take home the honors.

What’s your prediction?

{ 7 comments }

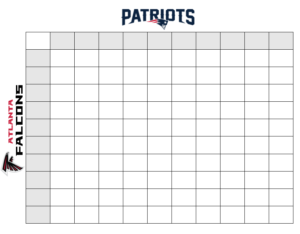
A couple of years ago, I wrote a detailed breakdown about Super Bowl squares. Well, it’s that time of year again, so I’m going to repost that article here to help you cheat to win at your Super Bowl party.

Every Super Bowl squares pool is different, but this post is really aimed at readers who play in pools where you can trade or pick squares (surely no pool has a prohibition on this!) I looked at every regular season and postseason game from 2002 to 2013. [1]Yes, this means your author was too lazy to update things for the 2014, 2015, or 2016 seasons. I suppose the rule change moving back the extra point would probably change things ever so slightly, … Continue reading The table below shows the likelihood of each score after each quarter, along with three final columns that show the expected value of a $100 prize pool under three different payout systems. The “10/” column shows the payout in a pool where 10% of the prize money is given out after each of the first three quarters and 70% after the end of the game; the next column is for pools that give out 12.5% of the pool after the first and third quarters, 25% at halftime, and 50% for the score at the end of the game. The final column is for pools that give out 25% of the pot after each quarter — since I think that is the most common pool structure, I’ve sorted the table by that column, but you can sort by any column you like. To make the table fully sortable, I had to remove the percentage symbols, but “19, 6.7, 4.1, 2” should be read as 19.0%, 6.7%, 4.1%, and 2.0%. [continue reading…]

References

References
1 Yes, this means your author was too lazy to update things for the 2014, 2015, or 2016 seasons. I suppose the rule change moving back the extra point would probably change things ever so slightly, given the small increase in missed extra points.
{ 5 comments }

2017 Hall of Fame Candidates

On Saturday, the 2017 Hall of Fame class will be announced. As many as 8 will be introduced — and there’s a good chance the class will be that large. Three players — Kenny Easley (senior’s nominee) and Paul Talibue and Jerry Jones (contributor selections) — receive a simple up or down vote. The other 15 finalists are all fighting for 5 spots. Here’s the full list:

2017 Semifinalists and Finalists Table
Rk Ballot
Player Pos From To AP1 PB St CarAV G
1 senior Kenny Easley DB 1981 1987 3 5 7 60 89
2 final LaDainian Tomlinson RB 2001 2011 3 5 10 128 170
3 final Jason Taylor DE 1997 2011 3 6 12 119 233
4 final Terrell Owens WR 1996 2010 5 6 13 119 219
5 final Alan Faneca G 1998 2010 6 9 13 114 206
6 final Kevin Mawae C 1994 2009 3 8 15 109 241
7 final Isaac Bruce WR 1994 2009 0 4 13 102 223
8 final Brian Dawkins DB 1996 2011 4 9 14 101 224
9 final Kurt Warner QB 1998 2009 2 4 8 96 124
10 final John Lynch DB 1993 2007 2 9 12 90 224
11 final Ty Law DB 1995 2009 2 5 11 87 203
12 final Joe Jacoby T 1981 1993 2 4 11 82 170
13 final Terrell Davis RB 1995 2001 3 3 4 72 78
14 final Tony Boselli T 1995 2001 3 5 6 63 91
15 final Morten Andersen K 1982 2007 3 7 16 51 382
16 final Don Coryell coach
17 final Jerry Jones contributor
18 final Paul Tagliabue contributor

What are my thoughts? [continue reading…]

{ 96 comments }

Joe Montana had what many consider to be the best performance in Super Bowl history. In Super Bowl XXIV against the Broncos, Montana completed 22 of 29 passes for 297 yards and 5 touchdowns, with 1 sack for 0 yards. Jerry Rice was the biggest beneficiary, catching 7 passes for 148 yards and 3 touchdowns, in a 55-10 blowout of the Broncos.

Do the math, and Montana averaged 13.23 Adjusted Net Yards per attempt that day. Making it even more impressive is that he was facing a Broncos defense that allowed just 3.89 ANY/A to opposing passers during the regular season. That means Montana averaged 9.35 additional ANY/A relative to the average Broncos opponent. Over 30 dropbacks, that’s 280 Adjusted Net Yards of Value that Montana added. That’s the most in Super Bowl history, just ahead of what Doug Williams did two years earlier against the Broncos.

In that game, Williams was 18/29 for 340 yards with 4 TDs and 1 INT, and one sack for 10 yards. That’s an ANY/A of 12.17, but it came against a slightly tougher defense: the Broncos allowed 3.77 ANY/A that season. So Williams was 8.40 ANY/A better than “expected” against Denver, over 30 dropbacks; that means he produced 252 ANY of value in the Super Bowl.

Below are those numbers for each of the 128 passers in Super Bowl history. For Super Bowls prior to 1981, I had to use estimated sack data rather than actual, with the formula for estimated sacks being simply (Team Sacks) * (QB Pass Attempts/Team Pass Attempts). [continue reading…]

{ 40 comments }

Atlanta had a really, really good offense this year. My favorite statistic: the Falcons had 59 drives end in a punt or a turnover, and 58 end in a touchdown.  Atlanta averaged 3.03 points per drive this year, and yet, the offense has been even better in the playoffs.

There was no stopping Matt Ryan and the Falcons against Green Bay, as the group scored 44 points on 9 drives in the NFC Championship Game. In the division round, the Falcons scored 36 points on 9 or 10 drives against Seattle, depending on whether you want to treat the Falcons final drive of the game as a real drive.  In two NFC playoff games, Atlanta’s offense has scored 10 touchdowns, seen 5 drives end on punts, 3 end on field goals, with zero turnovers and one drive end with the clock running out.

Scoring 80 points on 18 or 19 drives translates to an average of 4.21 or 4.44 points per drive. Take an average of those two numbers, and the offense is still averaging a whopping 4.32 points per drive. How remarkable is that? Well, it’s the best average for any of the 102 Super Bowl teams in their pre-Super Bowl playoff games.

The NFL has not historically recorded drive stats, so I previously wrote how one can estimate the number of offensive drives a team has in a game or season.  I used that formula to measure the best playoff offenses entering the Super Bowl; unsurprisingly, the 1990 Bills were the previous hottest offense.

Against Miami in the division round, Buffalo had between 10 and 12 drives, depending on how you treat the final drives of the half (the Bills received the ball with 14 seconds left on their own 32, and took a knee) and the game (Buffalo received the ball with just over one minute to go, and ran three times for a first down to run out the clock). Those other ten drives ended as follows, in order: Touchdown, Field Goal, Field Goal, Touchdown, Touchdown, Interception, Field Goal, Touchdown, Touchdown, Punt. That’s 44 points on 10 real drives.

The next week, in the AFC Championship Game against the Raiders, the Bills had 11 or 12 drives, as the final drive of the game featured Buffalo taking a pair of knees to close out a 51-3 victory. The first 11 drives went: TD, TD, Interception, TD, missed FG, TD, TD, Punt, TD, FG, Punt.  That’s 44 points (Buffalo also scored on a pick six, and one extra point was missed) on 11 drives. [continue reading…]

{ 14 comments }