≡ Menu

I looked at all players (excluding quarterbacks) since 1990 with at least 50 carries in a season. I then grouped those players into 50-carry increments based on their number of carries that season: i.e., 50-99 carries, 100-149 carries, and so on. The chart below shows that data, along with the average number of carries for each group, the average number of rushing yards, and the average yards gained per carry:

Carries# of PlayersAvg RushAvg Rush YardAvg YPC
50-99619722884.03
100-1493381224914.01
150-1992771726894.00
200-2492222239274.15
250-29918127211474.21
300-34912732213614.22
350+3937116424.42

Those results are probably not very surprising. The players with the most carries have the most rushing yards, and the yards per carry average tends to increase, too. This is in some ways an example of survivorship bias: the players who are performing the best will continue to keep getting carries, moving them into the higher-carry buckets.

Now, what happens the next season? Take a second and think about what you expect…. [continue reading…]

{ 1 comment }

The Saints Had The Worst Fumble Luck In 2017

There were 644 fumbles during the 2017 season, with 276 being recovered by the opposing team. That’s a 43% fumble recovery rate for the defense, and a 57% fumble recovery rate for the offense; in other words, exactly 3 out of every 7 fumbles were recovered by the opposing team, and 4 out of every 7 fumbles were recovered by the fumbling team.

The Baltimore Ravens fumbled 19 teams, but only lost 4 of those fumbles. So the Ravens offense recovered 79% of those fumbles, when we would have “expected” them to recover 10.9 of those fumbles. Therefore, Baltimore recovered 4.1 more fumbles than we would have expected. On defense, Baltimore’s opponents had 22 fumbles, and Baltimore recovered 12 of those 22 fumbles. So the Ravens defense recovered 55% of all fumbles by opponents, when we would have “expected” them to recover 9.4 of those fumbles; therefore, Baltimore’s defense recovered 2.6 more fumbles than expected. Add it up, and there were 41 times that the football hit the ground during Ravens games, and Baltimore recovered 27 of them, which was 6.7 more than expected.

On the other side of things we have the New Orleans Saints. Despite being one of the best teams in the NFL last season, New Orleans had really bad fumble luck (perhaps that’s why they “only” went 11-5 despite being the most efficient team in the league). On offense, the Saints had 19 fumbles but only recovered 9 of them; that’s 1.9 fewer fumbles recovered than expected. And on defense, New Orleans forced 20 fumbles but only recovered 5 of them, which was 3.6 fumbles below average! Together, the Saints recovered just 14 of 39 fumbles in all games, which was 5.4 fewer fumble recoveries than expected. [continue reading…]

{ 1 comment }

NFC East Passing Since 2002

A question for the crowd today: which is a better way to present data on the NFC East passing attacks since 2002? The measure today will be Adjusted Net Yards per Attempt.

We can do it in graph form, like this, with each team having color-coded lines and ANY/A on the Y-Axis:

Or we can do a heat graph that shows the actual data, with blue shading for the best years and red shading for the worst years:

If you wanted to tell a story about the NFC East passing since 2002, what story would you tell, and which graph is more useful?

{ 0 comments }

Who are the worst passing teams of the last three years? The Browns are the obvious and correct choice as the worst passing attack, and you won’t hear arguments from many if you include the Texans, Ravens, and 49ers in that group. Those four teams have all averaged 5.7 or fewer net yards per passing attempt since 2015, the simplest measure of passing efficiency.

But the fifth-worst team over the last three years is a shocker: it’s the Green Bay Packers. Yes, Aaron Rodgers missed most of last season (and Brett Hundley was terrible in his stead), but you may not remember that the Packers offense had a lot of struggles in 2015 playing without Jordy Nelson, who has been very instrumental to Rodgers’s success. Yes, Rodgers had his always glowing TD/INT ratio in 2015, but he ranked 32nd out of 36 qualifying passers in NY/A that season.  And Rodgers’s struggles creeped into September of 2016, too, before he finally turned things around.

Still, we think of him as Aaron freakin’ Rodgers, so it’s jarring to see that — even with half a season of Hundley — Green Bay ranks in the bottom five of any passing stat.  To be sure, NY/A has always been Rodgers’s weakest stat, since his TD rate and INT rate are what have buoyed his success. So let’s instead look at Adjusted Net Yards per Attempt, a stat that Rodgers remains the career leader in since 1970.

The graph below shows the trailing 16-game ANY/A average of the Packers passing attack over each 16 game period beginning with the 16th game of the 2008 season (Rodgers’s first as a starter).  The Packers line is in green and yellow; the league average is in black.  As you can see, things are not trending in the right direction, and even as of the middle of 2016, the T16G average was pretty ugly: [continue reading…]

{ 0 comments }

Yesterday, I looked at player weight in the NFL. Today I want to take a more granular approach and look at weight by position. Of course, in modern times, positions have blended quite a bit. In a 3-4 defense, the edge rusher would be a linebacker, while in a 4-3 defense, that same player would be a defensive end; defensive front sevens are so versatile that Khalil Mack once received All-Pro honors at both OLB and DE… in the same season! And it’s not just the front seven players that are hybrids: Deone Bucannon and Mark Barron converted from safety to linebacker after entering the NFL, while 2017 Eagles rookie Nathan Gerry converted from safety to linebacker when he entered the draft.

So while there’s an element of trying to fit square pegs into round holes, I nevertheless labeled every defensive player from 2017 as either a DL, LB, or DB. In my database for each player, I have their weight and 2017 AV score. I have graphed that data below, with player weight on the X-Axis and AV score on the Y-Axis.  All players in red are defensive backs, while players in black are linebackers, and defensive linemen are showed in blue.

There is some fluidity in player positions, but some broad trends clearly emerge.  Yes, there is overlap between defensive backs and linebackers, and between linebackers and defensive ends, but that overlaps is mostly at the edges. Below is the same data (with player weight on the X-Axis), but showing the range of weights for defensive backs (the top line), linebackers (middle), and defensive linemen (bottom).  This chart is particularly neat, because in one picture it highlights both the rule and the exception: it’s clear what the ranges are for players at DL, LB, and DB, but it is also clear that there’s overlap at the margins: [continue reading…]

{ 0 comments }

Let’s travel back to 1990. On average, most defensive backs weighed between 172 and 210 pounds, most linebackers between 225 and 250 pounds, and most defensive linemen between 260 and 290 pounds. The graph below shows the amount of AV produced by defensive players at each weight in 1990:

If you look carefully, you’ll notice a few low spots on the graph. Very little AV is coming from players who weighed between 211 and 220 pounds, and also at 256 to 259 pounds. Let’s graph this another way: below, I show the percentage of all defensive AV produced by players who are X pounds or lighter. For example, about 11% of AV is produced by players 187 pounds or lighter, about one-third of AV is produced by players 210 pounds or lighter, and 34% is from players 220 pounds or lighter. The graph gets very flat between 211 and 220 pounds, indicating the lack of players in that range: [continue reading…]

{ 0 comments }

Vegas Records Vs. Actual Records

Last year, the Steelers went 13-3, but you would have lost money if you bet on Pittsburgh every week. Despite that record, the Steelers went just 7-9 against the spread. Since 1978, teams that have won games are 7706-1514-256 in 9,476 games against the spread, which means teams that win cover the spread about 83% of the time.

The biggest outlier was the 1986 Bears. You probably have heard of a team called the ’85 Bears, who stomped through the league en route to a Super Bowl title. The next season, Chicago went 14-2 but went just 6-10 against the spread! There were 7 games where the Bears were favored by at least 9.5 points and won the game but didn’t cover; that is, of course, a record. The only other teams with even four such games where they failed to cover were the ’98 49ers and ’07 Patriots.

The graph below shows, on the X-Axis, the winning percentage of all teams in all seasons since 1978. The Y-Axis shows their winning percentage against the spread. You can see the Bears as the low dot on the bottom right, at 0.875 winning percentage and 0.375 winning percentage against the spread. [continue reading…]

{ 0 comments }

Today’s guest post/contest comes from Thomas McDermott, a frequent guest contributor. As always, we thank him for his hard work.


Author’s note regarding the numbers: The Win Probability (WP) numbers shown below were, for the most part, generated using a formula presented by Wayne Winston in his book Matheletics, and subsequently improved upon by Pro Football Reference for their WP model. [1]While in the process of messing around with PFR’s WP Calculator, I have noticed differences between the results from the Calculator and the results from using the formula as shown on their web … Continue reading

The heart of the formula is the Excel NORMDIST function, which returns the normal distribution (the probability) for a given mean and standard deviation. I have made some minor adjustments to this formula, but it is basically the same. The formula requires the use of Expected Points data; the EP dataset I use comes from Brian Burke’s Advanced Football Analytics site (when it was active), and I have adjusted those numbers for era. Since the formula falls apart in certain areas – most importantly, the 4th quarter when the game is close – I abandon it and use other data to generate a WP number. Field goal success rates, 4th down success rates, drive results, PFR’s Play Index and the recently provided play-by-play data from Ron Yurko on GitHub, are some of my alternate sources. I realize there’s a “black box” aspect to Win Probability analysis (if you can find two models that completely agree, let me know), since it’s not something that can be easily checked, and perhaps especially suspect when the author openly states that he adjusts the numbers “manually”. To that I can only say that my intent is to provide as accurate a picture as possible of the games that I analyze, and I’m open to any suggestions, comments or questions. Thanks. [continue reading…]

References

References
1 While in the process of messing around with PFR’s WP Calculator, I have noticed differences between the results from the Calculator and the results from using the formula as shown on their web page. I have a hunch that PFR has probably moved on from the formula and is using a more sophisticated model (which perhaps incorporates the formula?), but I’m not sure.
{ 0 comments }

Who Will Win 2018 Coach of the Year?

There is no tougher award to predict than AP Coach of the Year. On the other hand, that makes it one of the most fun awards to speculate and discuss. Regular readers know that I have been at this game for awhile, with no success at all.

  • In 2012, I selected Mike Mularkey as my pick. That turned out be very, very wrong — the Jaguars went 2-14! — but in COTY predicting, it’s win or go home, so swinging for the fences makes sense. Bruce Arians, who went 9-3 as interim head coach of the Colts, won the award for his magical work in transforming a bad Indianapolis team.
  • In 2013, I selected Sean Payton; unfortunately for him, an 11-5 record was not enough. That honor instead went to Ron Rivera, whose Panthers went from 7-9 to 12-4, on the back of a dominant defense.
  • In 2014, I chose … Jay Gruden. Washington went 4-12. Arians, now in Arizona, won the award for taking a Cardinals that ranked 24th in both yards and yards allowed and barely outscored its opposition to an 11-5 record: Arizona went 6-0 under Carson Palmer, but going 5-3 with Drew Stanton secured the honors for Arians.
  • In 2015, I chose Dan Quinn. That was a year too early: Atlanta finished just 8-8 this year before going to the Super Bowl in ’16.  Instead, Rivera won again, as Carolina went from 7-8-1 to 15-1.
  • In 2016, I went with Bill O’Brien as my pick; he responded with his third straight 9-7 season. I was in the wrong state of mind but the right state: Cowboys coach Jason Garrett won the award, after Dallas vaulted from 4-12 to 13-3.
  • Last year, I didn’t write an article about my picks, but I leaned towards Chargers coach Anthony Lynn.  Well, 2017 turned out to be a perfect example of how hard this award is to pick.  Entering the season, Sean McVay was one of five head coaches who had 50-1 odds to win, tied for the longest odds of any coach.  And McVay turned around the Rams from 4-12 to 11-4 before securing a first round bye.  He picked up 35 of 50 votes to win the award.

The reason this award is so hard to pick is because in some ways, every coach is on an even playing field in week 1. The winner of this award is the one who usually exceeds expectations the most, so there is a natural equalizer in place.

That’s not entirely true, of course.  A team needs to have a good season to get the award, and some teams are so low on talent that a good season is a longshot.  Here are the only odds I can currently find on the award for 2018: [continue reading…]

{ 0 comments }

Pass Efficiency By Pass Direction

Thanks to the always wonderful PFR Play Index, it’s easy to analyze NFL pass plays by direction. The official play-by-play logs released on behalf of the league label all passes as either short (less than 15 yards from the line of scrimmage) or deep, and either left, middle, or right.

The table below shows the results of passes last year in those six directions, along with the totals:

A few things stand out. NFL teams have a slight preference for throwing right rather than throwing left, which likely reflects (or is a cause of!) the fact that every quarterback in the NFL is now exclusively righthanded. The effect is not large, but there are slightly more short passes to the right than the left.

Another is that passes in the middle of the field seem very good, but with two big caveats. On short passes, teams averaged 7.41 Y/A and pick up a first down on 40% of all throws; meanwhile, teams averaged 5.93 Y/A and a 32% first down rate on short throws to the left or right. That makes passes to the short middle appear about 20% more efficient than passes that are thrown short and outside. And on deep throws, the completion percentage is significantly higher on throws in the middle of the field (46% vs. 37%), with higher first down rates (duh) and AY/A averages, too.

Ah, but the caveats. One is that throws in the middle of the field are less safe, almost certainly due to the heavy congestion. The interception rate was twice as high on short throws last season as it was on short throws to the outside, and it was also twice as high on deep middle throws relative to passes deep and to the outside. Throwing in the middle of the field is riskier, but it appears to have a higher reward.

We’ll get to the other caveat in a minute, but first, let’s look at passes from 2013 to 2016, again using the PFR Game Play Finder.

We see similar results here. The NFL still looks like a right-handed league, with just a few more passes coming to the right than the left. On short passes, the interception rate is much higher on passes to the middle of the field, but the Y/A and first down rates are also way higher. In fact, both AY/A and first down rates were 22% higher on passes short and to the middle relative to short and outside. On deep throws, completion percentage was significantly higher on throws in the middle of the field, as was the touchdown rate, first down rate, and well, the interception rate.

But the elephant in the room in this analysis isn’t that passes thrown in the middle of the field are more effective than passes thrown to the outside. Perhaps the most important data point in these tables isn’t even given its own column, but savvy readers likely picked up on it. On short passes, just under 25% of them (in both 2017 and 2013-2016) were thrown to the middle of the field; on deep passes, 22% of throws (2017 and 2013-2016) were to the middle of the field. Meanwhile, passes to the right (short/deep/2017/2013-2016) approach 40% in all cases.

This means we are not necessarily comparing apples to oranges. There is a likely survivorship bias going on here. I don’t have data on time from snap to throw, which would supplement (and make more interesting!) today’s analysis, but it seems likely that passes to the middle of the field happen quicker. In other words, a quarterback is much more likely to do this:

Read 1 is to middle of the field —–> player covered —-> Read 2 –> throw to outside

Than to do to this

Read 1 is to outside of the field —–> player covered —-> Read 2 –> throw to middle of field

If your first option is covered, that play’s overall success rate is likely going down. A “backup” plan is to throw to the outside, which would explain why passes to the outside are both greater in number and lower in efficiency.

And let’s not forget that targets themselves — or pass attempts, in this case — are also measures of quality.  The fact that teams throw to the outside more is evidence (not conclusive, of course, but evidence nonetheless) that throwing to the outside more is better.  Let’s consider the 2017 Eagles, with Alshon Jeffery and Torrey Smith (who spent most of their time on the outside) and the team’s slot receiver, Nelson Agholor, who had been heavily criticized much of his career.   Agholor averaged 8.08 yards per target last year on 95 targets, while Jeffrey (6.58) and Smith (6.42) were much worse on 120 and 67 targets, respectively.

Let’s look just at short passes for the Eagles last year.  Philadelphia quarterbacks had a 96.5 passer rating and picked up a first down on 31.5% of passes that were short and to the outside; meanwhile, those same players had a 119.6 passer rating and picked up a first down on 47.8% of passes that were short and in the middle of the field.

But for Philadelphia, short throws to the middle of the field comprised only 21% of all short throws.  Perhaps, just like with Agholor, Philadelphia only threw to the middle of the field when the middle was open, and threw short no matter what (and if everyone was covered, a check down to the running back in the flat may be more likely to be charted as an outside pass).

It’s easy to look at efficiency numbers and conclude that teams should be doing more of what’s most efficient. But that only works when we’re comparing the same sort of data, and it’s not clear that we can do that just yet.

{ 1 comment }

Adam Steele on QB Defensive Support: Part 2

Adam Steele is back for another guest post, with today’s work being initially published at The GridFe. You can view all of Adam’s posts here. As always, we thank him for contributing.


Yesterday, I outlined my methodology for measuring QB defensive support, and looked at the best and worst seasons using that metric. Today’s post will explore the career numbers for the 107 quarterbacks in my study.

I originally planned to simply tally the seasonal numbers without adjustment, but that presented a problem: The top of the support leaderboard was disproportionately filled with QB’s who were exceptional at avoiding interceptions. This makes sense because throwing picks generally makes it harder to prevent the opponent from scoring, although I expected the effect to be minimal enough that it wouldn’t really make a difference. Well, it does make a difference.

To counter the interception issue, I added three point of defensive support for every marginal INT thrown in the regular season. Marginal INT’s are calculated by taking the difference between a given QB’s INT% and the league average rate [1]Technically a rolling three year average calculated by Bryan Frye, then multiplying that difference by the number of pass attempts. I know from expected points models that the typical INT is worth roughly -3 EPA, so each marginal INT makes the defense look three points worse than it actually is. As an example, Len Dawson threw -31 marginal INT’s during his career, which “saved” 93 points for his defense. Dawson’s career support is then adjusted by -93 points.

A more rigorous study would also adjust for playoff interceptions and lost fumbles, but I don’t currently have the means for easily compiling the marginal version of those statistics. Again you’ll just have to use common sense and make mental adjustments when necessary. [continue reading…]

References

References
1 Technically a rolling three year average calculated by Bryan Frye
{ 0 comments }

Adam Steele on QB Defensive Support: Part 1

Adam Steele is back for another guest post, with today’s work being initially published at The GridFe. You can view all of Adam’s posts here. As always, we thank him for contributing.


I’ll start by stating the obvious: QB wins is a terrible metric for evaluating the performance of quarterbacks. But since this criteria remains at the forefront of the public discourse about NFL signal callers, I figured it would be worthwhile to provide some important context.

The game of football is won and lost in three phases, two of which have very little to do with the QB. In this post I’m going to present a cursory analysis of which quarterbacks benefited the most and least from the play of their teams’ defenses and special teams.

When I reference defensive support, I’m actually referring to the points allowed by a given quarterback’s team compared to the average team during that season. This is not an exhaustive study; my numbers do not adjust for field position, number of drives, turnovers, weather, or any other hidden variable that affects points allowed. But including all the noise also includes all the signal.

From the quarterback’s perspective, it doesn’t matter why his team gave up x number of points – his chances of winning the game are the same (or nearly the same) regardless. If his team allows 35 points, it doesn’t matter to the QB whether his own defense was bad or the opposing offense happened to be a juggernaut. If his team allows only 10 points, it doesn’t matter to the QB whether his defense was stout or the opposing kicker missed three field goals. This is why I’m content to use straight points allowed and ask the reader to make common sense adjustments for QB’s in extreme circumstances.

I collected data from the top 100 quarterbacks in career pass attempts (modern era) plus Hall of Famers and Super Bowl winners outside of the top 100. I only wanted to count games in which the QB played a significant amount, so I set a threshold of 14 pass attempts for a game to count (14 attempts per game is the NFL’s official minimum for rate stat leaderboards). It doesn’t matter whether the QB started the game or not, as such data gets murky the further in time we look back (for another look, here is an old Chase article on points allowed per game in games started by each quarterback). Playoff games are included in the points allowed totals as well as league baselines; said baselines are calculated by removing the points allowed in qualifying games of the QB is question, then finding the league average points per game in all other games during a given season.

In the two tables below, Win % is from qualifying games only, O/U is the number of games over or under .500 in qualifying games, and Playoffs indicates which round of the postseason was reached the by the QB’s team (even if he didn’t play in the postseason).

Here are the top 100 seasons of defensive support among the quarterbacks in my study: [continue reading…]

{ 0 comments }

Paxton Lynch’s Broncos Career Is Nearly Over

Paxton Lynch was the 26th pick in the 2016 Draft, but it looks like his Broncos (and perhaps NFL) career is coming to a close. As a rookie, he sat on the bench behind Trevor Siemian, who was taken with the 25t0h pick in the 2015 Draft and vastly outplayed Lynch during the summer of ’16 to win the job. And in 2017, Lynch missed time with shoulder and ankle injuries, but he also was the third most productive QB on a bottom-5 passing offense, looking worse than both Siemian and Brock Osweiler. Lynch has now fallen to third on the team’s depth chart even with Siemian and Osweiler gone: Case Keenum was brought in to be the team’s starter, and Chad Kelly — the 253rd pick in the ’17 Draft — has moved ahead of Lynch on the depth chart.

That’s right: the Broncos 1st round pick in 2016 has now been beaten out by 7th round picks from both the 2015 and 2017 drafts.

Let’s assume Lynch finishes 2018 with zero touchdown passes.  That would give him 4 career touchdown passes through three seasons.  The graph below shows quarterbacks drafted from 1992 to 2015 plus Lynch, with the X-Axis representing draft slot and the Y-Axis showing touchdown passes through three years.  Lynch is the red dot. [continue reading…]

{ 1 comment }

2017 Contest: 38 Questions in Review, Part III

Back in August, I asked you 38 questions that served as prop bets for the 2017 NFL season. Thanks to the tireless work of Jeremy De Shelter, who helped compile all the results. Earlier this offseason, I looked at Part I and Part II. Let’s move on to Part III…

Number of playoff (non-Super Bowl) games won by the visiting team, +0.5
Maximum number of TDs thrown by Kirk Cousins in a single game

Cousins topped out at 3 passing TDs in a single game, done four times in 2017.  Meanwhile, road teams won… 3 games in the 2017 playoffs, with Atlanta and Tennessee winning on the road in the Wild Card round, and Jacksonville winning in Pittsburgh in the second round.

That Steelers loss was critical: only 39% of you picked the road playoff wins side, which means the Jaguars upset gave the minority group the win.

Punts by Jets opponents, -5
Jets team offensive passer rating.

The Jets were supposed to be terrible on offense and not too bad on defense, making this a tricky one to analyze.  The votes here were pretty split, with 53% of contestants voting for the Jets offensive passer rating side to be higher.  Jets opponents had 87 punts in the league last year the 4th most behind Jacksonville, Arizona, and Denver.

Meanwhile the Jets passing attack was surprisingly…. decent? New York finished with an 86.1 passer rating, slightly above the league average of 85.1, and 15th-best in the NFL.

In other words, this was a good line where the hook made the difference! The line finishes 82 vs. 86.1, swinging the side towards the brave 47% who backed the Jets passing attack. [continue reading…]

{ 0 comments }

Yesterday, I looked at Norm Van Brocklin and how he set the single-game passing record with 554 passing yards.  This was done way back in 1951, in a game against the New York Yanks.  In that post, I noted that big passing games in Van Brocklin’s era tended to come against bad teams in blowouts, while big passing games now come in more competitive games. Let’s investigate that a bit more today.

In the 1950s, there were 10 games where a team threw for at least 400 gross passing yards (that is, without deducting sack yards). In those games, the average team threw for 444.5 yards, while the opponent had just 159.3 passing yards. And the 400-yard passing team led by, on average, 5.4 points, 13.3 points, 24.6 points, and 26.6 points after each quarter.

In other words, those were one-sided affairs where the winning team was able to name its score (and number of passing yards).  Van Brocklin’s game against the Yanks is a good example; in modern times, this is much less common, with the Patriots/Titans snow game from 2009 being an outlier (New England passed for 442 yards, while Tennessee had negative passing yards even without including sacks!).

Let’s compare that to the 2010s. There have been 126 passing games of 400+ yards, with an average of 436.6 passing yards. On average, the opponents in those games had a 300-yard game — 306.9 passing yards, to be exact. And the games were almost always close, with the margin being within 2 points at the end of each quarter (in fact, it was negative for the big passing team). [continue reading…]

{ 1 comment }

Super Bowl LII. Nine seconds left, New England down by eight. Tom Brady had already thrown for 505 yards, but the Patriots still needed another 51 yards from him to have a chance to extend the game. Brady launches a prayer to Rob Gronkowski, who …

… nearly comes down with it in the end zone. Had the Hail Mary been completed, Brady would have thrown for 556 yards, setting a new single-game passing yardage record. The current record, as trivia experts know, is 554 passing yards, set by Norm Van Brocklin way back in 1951.

Eight years ago, I first wrote about how Van Brocklin held the record for most passing yards in a single game. I’ll be reprinting and updating that post today.

Let’s begin with the obvious: Van Brocklin is a Hall of Famer and all-time great quarterback who, at his very best, produced some of the most efficient and valuable seasons in NFL history. He should be on most top-20 quarterback lists, and his net yards per pass attempt — one of the most basic but important measures of quarterback play — is the best of all time.

On the other hand, he set the record in 1951.  How the heck did that happen?  Below, I have plotted all games where a team has passed for at least 450 gross yards (that is, without deduction for sacks).  As you can see, the dot at (1951, 554) is a pretty large outlier: [continue reading…]

{ 1 comment }

Red Zone Performance Since 2002

As noted yesterday, red zone performance is mildly correlated with team success. One team that was a big outlier last year was the Steelers. Pittsburgh’s offense made it into the red zone 63 times, but converted those trips into touchdowns just 32 times (50.8%), slightly below-average. On defense, the Steelers allowed touchdowns on 24 of 39 red zone trips, a 61.5% rate that was the 5th-worst in the league. Of course, the Steelers were actually one of the best teams in the league.

On one hand, this seems kind of silly: of course red zone performance alone won’t tell us much about a team’s record! It says nothing about a team’s turnover rate, how effective the team is at producing or preventing big plays, overall team efficiency, or special teams. Perhaps the most remarkable part is that it does tell us quite a bit.

The table below has a lot of information, so to analyze it, let’s look at the best red zone team of the modern era, the 2005 Seattle Seahawks. That year, the Seahawks offense had 60 red zone trips and scored a touchdown on 43 of them, a conversion rate of 71.7%.  Given that 53% of red zone trips yield a touchdown, this means Seattle’s offense scored 11.1 more red zone touchdowns than expected. On defense, Seattle faced 47 red zone trips, and allowed just 19 touchdowns, a 40.4% conversion rate that was 6.0 touchdowns better than average. Therefore, overall, the team’s red zone performance yielded 17.1 touchdowns better than average, the most of any team since 2002.  Based on the best-fit formula derived yesterday, a team’s expected winning percentage based on its red zone team value is 0.0154*(Team Value) +0.500.  Since Seattle’s red zone value was +17.1, we would have expected the Seahawks to win 76.3% of their games; they actually won 81.3% of their games, a difference of 0.049.

[continue reading…]

{ 1 comment }

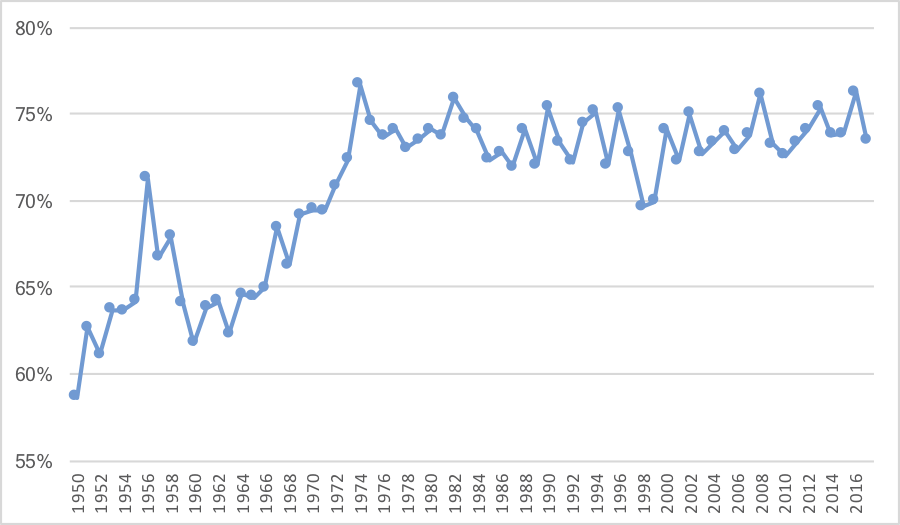
On Sunday, I noted that roughly 2/3s of all touchdown passes now come from inside of the red zone. That number is, of course, even higher when we look at all offensive touchdowns. The graph below shows the percentage of passing and rushing touchdowns that came from within the red zone in every year since 1950. Prior to 1970, less than 70% of all touchdowns came from within the red zone; since then, it’s been at about 75%. What’s interesting is that while there is an obvious increase over the course of pro football history, the rate has been relatively steady over the last five decades:

[continue reading…]

{ 11 comments }

Yesterday, I looked at a larger percentage of touchdown passes are coming from shorter distances. While longer touchdown throws used to rule the day, about two-thirds of all touchdown passes now come from inside the red zone.

The average touchdown pass was, at one point, north of 30 yards. Now? It’s south of 20 yards:

Three years ago, I wrote about the average length of touchdown pass. Let’s update that post today, using all quarterbacks who either threw 100+ career touchdown passes or threw a touchdown pass in 2017 and have at least 20 career touchdown passes.  Ed Brown is your career leader, although if we raise the limit to 125 touchdowns, Norm Van Brocklin would still be your career leader: [continue reading…]

{ 0 comments }

Back in June, I wrote about how the average length of touchdown passes was declining significantly. I wanted to revisit that post with a graph that really highlights the change in the type of touchdown passes thrown over time. The graph below shows, for each season from 1950 to 2017, the percentage of touchdown passes each year that were:

  • At least 50+ yards, plotted in dark red;
  • 30-49 yards, plotted in in red;
  • 20-29 yards, plotted in gray;
  • 10-19 yards, plotted in light blue;
  • Inside of 9 yards, plotted in dark blue.

The overall trend is obvious: while in the ’60s, fewer than 25% of touchdown passes came from inside of 9 yards, in modern times, well over 40% of touchdown passes come from that range. On a raw basis, as recently as 1975, there were more touchdown passes from 30+ yards (85 from 30-49, 44 from 50+) than from 9 yards and in (128).  Last season, there were 314 touchdown passes from the 9 yard line or closer, and 157 from 30+ (76 from 31-49, 71 from 50+).

What’s really notable is that while passing touchdowns are on the rise, that is entirely a function of short touchdowns. There are 32 teams and 16 games per season, providing for 512 team games in modern times. In the graph below, the dark red line shows the number of passing touchdowns in each season per 512 team games. The high-water mark was 2015, when there were 842 passing touchdowns, and therefore 842 passing touchdowns per 512 team games. But the dark blue line shows the number of passing touchdowns per 512 team games but excluding all touchdown passes inside of 9 yards.  That number has been relatively constant across NFL history (well, at least since the merger), but if anything, the trend (both shot-term since 2015, and long-term) is negative for gross passing touchdowns once you eliminate the shortest throws.

Pretty interesting, eh?

{ 0 comments }

During the season, I looked at the Carolina Panthers and how their team rushing stats were a bit misleading.

The Carolina Panthers have rushed for 982 yards this year, an average of 109.1 per game.  That ranks 15th in the NFL, and just a hair above the league average rate of 108.1 rushing yards/game.  But the Panthers don’t have anything resembling a traditional ground game: of those 982 yards, starting running back Jonathan Stewart has just 350 of them, while quarterback Cam Newton has 341 rushing yards, the most of any quarterback in the NFL in 2017.

In addition, wide receivers Curtis Samuel, Damiere Byrd, and Russell Shepard have combined for 87 yards; that’s the third-most rushing yards in the league for any team behind the Rams (Tavon Austin) and Raiders (Cordarrelle Patterson) among non-QB/non-RBs. In fact, Panthers running backs are averaging just 61.6 rushing yards per game, the fewest in the NFL.

Carolina’s running game improved the rest of the way, but that was thanks to both Newton and the traditional ground game improving. The Panthers finished the season 4th in rushing yards, which sounds really good! But Carolina also ranked just 27th in rushing yards by running backs, which, well, doesn’t sound very good. The table below shows where each team ranked in rushing yards by running backs, along with in just raw rushing yards: [continue reading…]

{ 0 comments }

Today’s guest post comes from Tom Nawrocki, a longtime fan of the site and not of the Dallas Cowboys. What follows are his words….

I grew up in the 1970s, watching the NFL and hating the Dallas Cowboys, as all right-thinking Americans did. The Cowboys were consistently strong throughout the decade; they made the Super Bowl after the 1970, 1971, 1975, 1977 and 1978 seasons.

What was additionally frustrating for us Cowboy haters was the way they kept adding top-flight talent throughout the decade. Despite the fact that they were a perennial playoff team, they seemed to have a top draft choice nearly every season. In the middle of this run, the Cowboys had the No. 1 or No. 2 pick in the draft for three out of four years, and the fact that they made the most of those choices helped give their dynasty a second wind. But how were they able to get those top draft picks, when they were successful every year? [continue reading…]

{ 0 comments }

How To Get A Lot of Receiving Yards

There are a few ways to get a lot of receiving yards.

One way is to play with a good quarterback, assuming that is defined as a quarterback who averages a high number of yards per attempt. This is pretty self explanatory.

Another way, though, is to play with a quarterback who throws a lot of passes. For example, we know that Russell Wilson is a much better quarterback than Derek Carr. The stats back this up, too: Wilson has averaged 7.82 Y/A for his career; by comparison, Carr has averaged just 6.54 Y/A for his career. But Carr has averaged 36.2 pass attempts per game, while Wilson is at just 29.5. As a result, Carr has averaged 237 passing yards per game, while Wilson has averaged only 231 passing yards per game. Since every passing yard is a receiving yard, it’s actually been better to play with Carr than Wilson if your goal was to get a lot of receiving yards.

So, you might realize, if receiving yards just equals gross passing yards, then having a good quarterback is only half the equation.

Receiving Yards = (Yards/Attempt) x Attempts

So if you are a receiver, you want to play on a team that has a good passer, or passes a lot, or better yet — both! On the other hand, a wide receiver can’t control these things.  We would naturally expect that the same wide receiver would gain fewer yards if he suddenly played for a team with a worse passer and if that team passed less often.

So can we control for this?  You might think that we should focus more on percentage of team receiving yards, rather than raw receiving yards.  For example, this might mean a receiver with 1,000 receiving yards on a team that threw for 3,000 yards was “better” than a receiver with 1,200 receiving yards on a team that threw for 4,000 yards.  After all, the first receiver had 33.3% of his team’s passing game, while the second receiver had just 30% of his team’s passing game.

But there are issues with that, too.  Let’s assume that both teams threw 500 passes, so the team that threw for 3,000 yards averaged just 6.0 yards per attempt, while the team that threw for 4,000 yards averaged 8.0 yards per attempt.  A team that averages 6.0 yards per attempt is a very bad passing team, while a team that averages 8.0 yards per attempt is a very good passing team.  But here’s the question: is it “better” or “more impressive” to be responsible for 33.3% of a very bad passing game or 30.0% of a very good passing game? [continue reading…]

{ 1 comment }

2017 AV-Adjusted Team Age: Overall

On Monday, we looked at the AV-adjusted average age of each team’s offense in 2017.

On Tuesday, we did the same for defense.

Today, let’s look at the average age of each team overall in 2017. For reference, here are last year’s results. You won’t be surprised to see Cleveland grade out as the youngest team in 2017 by over a full year. The Browns also failed to win a game, so youth didn’t work out for that team.

But the second-youngest team in football was the Jacksonville Jaguars, who nearly won the AFC. The Jaguars held a lead in the AFC Championship Game, before losing to the third-oldest team in the NFL… the Patriots.

The table below shows the average age of each team last season. [continue reading…]

{ 0 comments }

2017 AV-Adjusted Team Age: Defense

Yesterday, we looked at the age-adjusted offenses from 2017. Today we do the same for defenses, just like we did last year. Here’s how I opened that column:

Being young isn’t by itself a virtue: the Browns ranked in the bottom 5 in points allowed, yards allowed, net yards per attempt allowed, net yards per rush allowed, turnovers forced, and first downs allowed. But Cleveland was, by far, the youngest defense in the NFL last season.

In 2016, the Browns defense had an average AV-adjusted age of just 25.2; the Falcons were the second-youngest defense at 25.8. In 2017, the Falcons again had an average AV-adjusted defense that was just 25.8 years old. But the Browns? That number dropped to just 24.5! The Browns defense was even younger than the Browns offense, and was by far the youngest unit in all of football: [continue reading…]

{ 0 comments }

2017 AV-Adjusted Team Age: Offense

After each of the last six years, I’ve presented the AV-adjusted age of each roster in the NFL. Measuring team age in the NFL is tricky. You don’t want to calculate the average age of a 53-man roster and call that the “team age” because the age of a team’s starters is much more relevant than the age of a team’s reserves. The average age of a team’s starting lineup isn’t perfect, either. The age of the quarterback and key offensive and defensive players should count for more than the age of a less relevant starter. Ideally, you want to calculate a team’s average age by placing greater weight on the team’s most relevant players.

My solution has been to use the Approximate Value numbers from Pro-Football-Reference.com, and to calculate age using each player’s precise age as of September 1 of the year in question.  Today, we will look at offenses; tomorrow, we will crunch these same numbers for team defenses. The table below shows the average AV-adjusted age of each offense, along with its total number of points of AV. In 2017, the Browns, Jaguars, and Texans were the three youngest offenses, with Cleveland really standing out. [continue reading…]

{ 1 comment }

On Friday, I looked at each team’s offensive pass identity. Today, the reverse: a look at defensive pass identities.

The Jacksonville Jaguars were one of the best teams in the NFL last year. Jacksonville had the 3rd-best points differential in the NFL in 2017 after 1 quarter (+41), the 5th-best after 2 quarters (+86), the 4th-best through 3 quarters (+109), and tied for the 3rd-best points differential overall. Unsurprisingly, Jacksonville had the 4th best average Game Script last season, which means you should expect the Jaguars to be run-heavy and Jacksonville’s opponents to be pass-heavy.

On the offensive side, things held to form: Jacksonville rushed on 49.4% of plays, the highest ratio in the NFL last season. But on defense, that wasn’t the case: teams passed on only 56.4% of plays against the Jaguars last year! Consider that opponents passed on 65.4% and 62.3% of plays against the Eagles and Vikings, teams that finished 3rd and 5th in Game Script last season.

On the other side, the Tennessee Titans.  Last season, the Titans were an average team, finishing with a slightly negative Game Script. And yet teams passed on them like they were the Patriots! In fact, opponents passed against New England on 61.6% of plays and against the Titans on 61.7% of plays.  The Titans Game Script was 0.27 standard deviations below average, while the opponent pass ratio was 1.42 standard deviations above average. As a result, the Titans have a Defensive Pass Identity of +1.69, making them the defense teams were most likely to pass against. [continue reading…]

{ 0 comments }

Ray Lewis Enters The Hall Of Fame

Tonight, the 2018 Pro Football Hall of Fame class will be inducted. It’s a great class, with Ray Lewis, Randy Moss, Brian Urlacher, Terrell Owens, and Brian Dawkins as the five modern-era selections.,joined by Jerry Kramer and Robert Brazile from the senior’s committee and Bobby Beathard as the Contributor selection.

Here’s what I wrote about Lewis when he was announced:

You won’t be on an island if you suggest that Lewis is the best inside linebacker in NFL history. Lewis scores well in pretty much every metric possible. When it comes to Approximate Value, what Ray Lewis did was unbelievable. He made 13 Pro Bowls, which is also absurd. The Ravens went on a magical run to win the Super Bowl in his final year, and at the time he retired, he was arguably the best player to retire after winning the Super Bowl.

[continue reading…]

{ 0 comments }

The Patriots like to pass the ball, even when ahead. Which they usually are.

In June, I published the Game Scripts results from every game of the 2017 season. A team’s Game Script is simply the average points differential over every second of every game. The largest Game Script of the season came in the Rams/Seahawks game in Seattle last year that the Rams won by a score of 42-7. Just as impressive as the final score was how Los Angeles got up on Seattle early, which is how a team gets a very high Game Script: LA was up 13-0 after the first quarter and 34-0 at halftime, and finished with a Game Script of +23.4. This means, on average, the Rams lead by 23.4 points over the course of the 3600 seconds in that game.

Not surprisingly, LA only passed on 36.8% of plays in that game. In general, as Game Script goes up, Pass Ratios go down. In 2017, for every point of Game Script, a team would be expected to pass about 0.72% less often. A team with a Game Script of 0 would be expected to pass on 57.6% of plays; if the Game Script was -10, it would be expected to pass on 64.8% of plays, at -5, 61.2%, at +5, 54.0%, and at +10, 50.4%.

Last year, the Dolphins were the most pass-happy team in the NFL. Miami finished the year with 602 pass attempts, 33 sacks, and just 360 runs; in other words, the Dolphins passed on 63.8% of all plays last year. If you take the calculate the average pass ratio for the Dolphins in each game, Miami has a 63.9% pass ratio (I have decided to use an average of the average approach for this post, rather than an average of the gross). That was 1.74 standard deviations above average last year, since the average pass ratio was 57.6% and the standard deviation was 3.6%. However, the Dolphins had an average Game Script of -5.27, which was 1.65 standard deviations below average. The average Game Script, by definition, is 0, and the standard deviation last year was 3.20.

So Miami wasn’t particularly pass-happy once you account for Game Script. But you know who was? The team with the Hall of Fame quarterback, Hall of Fame tight end, and star young wide receiver. And in addition to Tom Brady, Rob Gronkowski, and Brandin Cooks, three of New England’s top four running backs are known just as much (if not more) for their receiving prowess than their rushing ability: Dion Lewis, who caught 91% of his targets last year, Rex Burkhead, who had 264 rushing yards and 254 receiving yards, and James White, who had 56 receptions and just 43 carries.

By traditional numbers, New England ranked 16th in the league in pass ratio. But the Patriots are the Patriots, a team that generally plays with the lead. New England finished the year with a Game Script that was +1.66 standard deviations above average and a pass ratio that was 0.29 standard deviations above average. Add those two numbers, and New England’s Pass Identity was +1.95, easily the strongest in the league. The table below shows the results from every team last season. [continue reading…]

{ 1 comment }

The 1991 Eagles had a very bad passing offense. Philadelphia was one of four teams to finish with an ANY/A below 4.00, wasting a legendary defense along the way. You may have already known that, but here’s something you may not have known: Jim McMahon was Philadelphia’s starting quarterback that season, and he had a good season, ranking 12th in ANY/A and 13th in passer rating.

So yes, Philadelphia’s starting quarterback was an above-average passer despite Philadelphia’s passing attack being terrible. How did that happen? Well, it’s pretty simple: McMahon was responsible for 61% of the Eagles pass attempts that year, but also 66% of the team’s completions, 71% of the passing yards, 71% of the passing touchdowns, and only 47% of the sacks and just 41% of the interceptions. McMahon averaged 5.59 ANY/A; the rest of the Eagles passers averaged 0.77 ANY/A! That’s not a typo:

 
No. Player Age Pos G GS QBrec Cmp Att Cmp% Yds TD TD% Int Int% Y/A Y/C Y/G Rate Sk Yds NY/A ANY/A Sk% 4QC GWD
9 Jim McMahon 32 QB 12 11 8-3-0 187 311 60.1 2239 12 3.9 11 3.5 7.2 12.0 186.6 80.3 21 128 6.36 5.59 6.3 1 2
16 Jeff Kemp 32 qb 7 2 1-1-0 57 114 50.0 546 5 4.4 5 4.4 4.8 9.6 78.0 60.1 12 61 3.85 2.86 9.5 2 2
8 Brad Goebel 24 qb 5 2 0-2-0 30 56 53.6 267 0 0.0 6 10.7 4.8 8.9 53.4 27.0 6 37 3.71 -0.65 9.7
10 Pat Ryan 36 4 0 10 26 38.5 98 0 0.0 4 15.4 3.8 9.8 24.5 10.3 4 21 2.57 -3.43 13.3
12 Randall Cunningham 28 qb 1 1 1-0-0 1 4 25.0 19 0 0.0 0 0.0 4.8 19.0 19.0 46.9 2 16 0.50 0.50 33.3
41 Keith Byars 28 FB 16 16 0 2 0.0 0 0 0.0 1 50.0 0.0 0.0 0.0 0 0 0.00 -22.50 0.0
Team Total 27.2 16 10-6-0 285 513 55.6 3169 17 3.3 27 5.3 6.2 11.1 198.1 63.2 45 263 5.21 3.64 8.1 3 4

Thought of another way, non-McMahon passers had 226 dropbacks.  Using McMahon’s average of 5.59 ANY/A, we would “expect” McMahon to have produced 1,263 Adjusted Net Yards on those dropbacks.  In reality, other Eagles passers produced just 175 Adjusted Net Yards on those dropbacks, in large part due to 16 interceptions on 202 pass attempts.  This means McMahon “would have” produced 1,088 more Adjusted Net Yards than his backups.

That’s… a lot.  In fact, it’s the second-most in history using the following methodology:

  • 1) Calculate the ANY/A for each passer on each team.  So for 1991 McMahon, it’s 5.59.
  • 2) Calculate the ANY/A for the rest of that team’s passers for each passer.  For 1991 McMahon, it’s 0.77.
  • 3) Subtract the result in step 2 from the number in step 1. This leaves us with 4.82 in the case of ’91 McMahon.
  • 4) Multiply the result in step 3 by the smaller number of (a) that passer’s number of dropbacks and (b) the total number of dropbacks by the rest of the team.  In ’91 McMahon’s case, we use (b), which is 226, to get a result of 1,088.

The biggest difference in NFL history wasn’t McMahon, but Dan Fouts on the 1983 Chargers.   He averaged 7.32 ANY/A and threw 347 passes.  His backup, Ed Luther, averaged 3.77 ANY/A and threw 287 passes.  Fouts threw 20 TDs and 15 INTs, while Luther had 7 TDs and 17 INTs!  Non-Fouts passers in 1983 on San Diego had 308 dropbacks and averaged 3.66 ANY/A, exactly half of Fouts’ average!  Therefore, Fouts had 1,130 Adjusted Net Yards above expectation that season.

Three players from 2017 make the top 75 using this methodology, and my hunch is you could guess them pretty easily.  Then again, this formula isn’t supposed to shock you: it’s just a way of measuring which teams had a really good passer play about half a season, and really bad passers the rest of the season.

RkPlayerYearTeamANY/AOth ANY/ADiffDBOth DBValue
1Dan Fouts1983SDG7.323.663.673543081130
2Jim McMahon1991PHI5.590.774.823322261088
3Jesse Freitas1948CHR5.9-0.146.041671741009
4Joe Ferguson1976BUF7.040.996.05162254980
5Dave Krieg1988SEA6.872.884240225899
6Marc Bulger2002STL7.673.73.97226455897
7Tom Flores1966OAK8.131.996.14306144884
8Aaron Rodgers2013GNB85.132.87311304874
9Dave Smukler1936PHI1.99-10.7112.6968102863
10Donovan McNabb2005PHI6.143.123.02376285861
11Damon Huard2006KAN7.493.783.71260231857
12Bill Nelsen1966PIT10.873.567.3112289818
13John Friesz1996SEA6.873.273.6223309803
14Bill Kenney1987KAN6.241.914.33295185802
15Jake Plummer2003DEN6.632.374.26316188801
16Earl Morrall1959DET6.80.965.84137191800
17Jay Cutler2011CHI6.251.984.27337185790
18Seneca Wallace2008SEA6.0233.02256254768
19Nick Foles2013PHI9.185.633.55345209742
20Vinny Testaverde1995CLE6.572.44.16409178741
21Tony Banks1999BAL5.462.482.97353249741
22Frank Filchock1939WAS11.223.098.1489112724
23Dave Krieg1994DET7.414.243.17226259716
24Earl Morrall1963DET7.53-1.599.1232878712
25Bob Celeri1951NYY5.721.983.74238190710
26Neil O'Donnell1995PIT6.662.833.83431185708
27Dick Shiner1969PIT4.10.783.32233210697
28Pat Haden1981RAM4.011.013295232696
29Phil Simms1987NYG6.123.262.86317243695
30Deshaun Watson2017HOU7.194.133.06223356682
31Boomer Esiason1997CIN8.324.833.48193357672
32Bill Kenney1984KAN5.953.722.23300326669
33Warren Moon1988HOU7.152.64.55306146664
34Tim Couch2000CLE5.072.112.95225298664
35Jim McMahon1984CHI7.633.34.34153273664
36Ace Parker1946NYY6.851.085.77115159664
37Erik Kramer1997CHI50.164.84502136659
38Doug Williams1978TAM4.411.183.22200213644
39Bobby Thomason1955PHI7.153.383.77171229644
40Jeff Blake1994CIN5.873.422.46325261641
41Scott Hunter1977ATL4.410.463.95162175640
42Billy Kilmer1968NOR5.06-0.095.15315124639
43Craig Morton1970DAL7.221.395.83227109636
44Marc Bulger2005STL6.344.312.03313332634
45Jug Girard1949GNB2.41-2.75.11175124633
46Dutch Clark1936DET3.9-4.998.897175631
47Case Keenum2016LAR5.062.442.62345240630
48Mike Pagel1984IND4.271.542.73240229626
49Norm Van Brocklin1952RAM6.11.065.04205124625
50Derek Anderson2008CLE4.541.642.9297215624
51Tom Flores1960OAK5.712.772.93252211619
52Jay Schroeder1985WAS5.442.682.76224340619
53Tommy Kramer1984MIN4.862.52.35260337612
54Vinny Testaverde1993CLE6.363.892.47247276611
55Lynn Dickey1984GNB60.735.26433115605
56Marc Bulger2009STL4.652.352.3261326600
57Aaron Rodgers2017GNB5.993.682.31260353599
58Rodney Peete2002CAR5.12-1.086.241296595
59Bill Nelsen1965PIT4.86-2.197.0527084592
60Bill Kenney1985KAN6.143.023.12366188587
61Craig Morton1980DEN4.941.753.18327183583
62Charlie Batch2001DET5.123.191.93374301582
63Billy Joe Tolliver1998NOR6.283.522.76210382580
64Jeff Garcia1999SFO5.552.722.83390203574
65Sammy Baugh1949WAS6.42.294.12255139572
66Josh McCown2015CLE6.454.641.81315347570
67Frank Reich1996NYJ4.93.151.75345325569
68Jim McMahon1987CHI5.963.522.44232309567
69Jim Kelly1987BUF5.480.215.27446107564
70Jimmy Garoppolo2017SFO7.624.593.03186464563
71Michael Vick2010PHI7.294.522.76406204563
72Bob Snyder1938RAM4.21-2.236.4487158560
73Sammy Baugh1945WAS9.39-2.7412.1318246558
74Steve Pelluer1988DAL5.511.354.16456134557
75Matt Moore2009CAR7.113.343.76147351553
{ 0 comments }
Previous Posts