≡ Menu

Why Great Passing Isn’t Becoming More Important

Yesterday is one of my favorite posts — with just one picture, you can see why NFL teams have become more pass-heavy over the last 70 years. It is not debatable that the NFL is more pass-happy now than it used to be: teams really are throwing more often than ever before.

However, what is debatable is whether or not the increase in quantity makes passing more important than ever before. The correlation between ANY/A and winning percentage doesn’t show that passing matters more now than it did in the ’70s. This is because passing efficiency is more compressed now than it used to be, which arguably makes having a great quarterback less important now than ever before.

Lest you think that claim is crazy, note that the starting quarterback for every Super Bowl champion in the ’70s is now in the Hall of Fame: Johnny Unitas (with a hat tip to Earl Morrall), Roger Staubach, Bob Griese (with a hat tip to Earl Morrall), Griese, Terry Bradshaw, Bradshaw, Ken Stabler, Staubach, Bradshaw, and Bradshaw. Heck, 6 of the 10 losing quarterbacks in those games are Hall of Famers: Fran Tarkenton three times, Staubach twice, and Griese, with Craig Morton appearing twice, too.

The graph below shows the standard deviation among all teams in Adjusted Net Yards per Attempt (the single best measure of passing efficiency) for each team since the merger.  As you can see, the variance is declining, which means the best passing teams aren’t standing out quite as far from average as they used to: [continue reading…]

{ 1 comment }

In 2017, NFL teams completed 10,856 passes. They also threw 17,488 passes and took 1,195 sacks (totaling 18,683 dropbacks). That means NFL teams completed passes on 58% of all dropbacks — let’s call this adjusted completion percentage, since unlike regular completion percentage, it includes sacks in the denominator.

NFL teams also rushed 13,755 times relative to those 18,683 dropbacks. That means NFL teams passed (including sacks) on 58% of all plays. Let’s call this number the league pass ratio.

The fact that the adjusted completion percentage and pass ratio were the same in 2017 was not a coincidence. In 1981, the league-wide adjusted completion percentage was a lot lower at 51%.  That year, the league-wide pass ratio was also 51%.

In 1971, the adjusted completion percentage was 47 percent, while the pass ratio was 46 percent.

In 1962, the adjusted completion percentage was 49% and the pass ratio was 49%.

In other words, the adjusted completion percentage — which measures how often a pass play results in a completion — and the frequency with which teams pass are highly correlated and also nearly identical.  The graph below shows, in dark blue, the league average adjusted completion percentage, and in red, the league average pass ratio, for each year since 1950. [continue reading…]

{ 1 comment }

As we expected, five quarterbacks were selected in the first round of the 2018 Draft.

Where does the first QB go in the average draft? What about the fifth? Let’s investigate, by looking at all drafts since the first modern draft in 1967.

The first quarterback, on average, was selected with the 9th overall pick from 1967 to 2017.  But that’s heavily skewed: the median selection from ’67 to ’17 was the 3rd overall pick, and the modal selection was the first overall pick (22 times, and now 23).

The graph below shows where the first quarterback was drafted in each draft since 1967:

[continue reading…]

{ 0 comments }

2018 First Round Draft Trades

As I did last season, here is a recap of the trades from the first round of the 2018 NFL Draft.

1)

Bucs trade: 7th overall, 255th overall
Bills trade: 12th overall, 53rd, and 56th

This was not a cheap trade for the Bills: Buffalo traded 127 cents on the dollar on the JJ Chart and 167 cents on the dollar on the FP chart.  Buffalo traded up for a QB, of course: Wyoming’s Josh Allen (College Stats). The Bills paid a premium to get their quarterback, but this was no surprise.  Buffalo entered the draft with a ton of draft capital, and it was no secret that the Bills wanted a quarterback.  This trade made sense from that perspective, but it doesn’t mean Buffalo didn’t pay a lot to get their man (particularly given the next trade).

2)

Raiders trade: 10th overall
Cardinals trade: 15th overall, 79th overall, 152nd overall

Arizona wanted a quarterback, and Rosen might have been the best quarterback in the entire draft.  The Cardinals were surely ecstatic to see Rosen fall to 10, and pounced on him.  Even better, Arizona didn’t pay much in the way of premiums: the Cardinals paid less than 100 cents on the dollar (98, to be exact) on the JJ chart, and 135 on my chart, to move up for Rosen.

3)

Packers trade: 14th overall
Saints trade: 27th overall, 147th overall, and 2019 1st round pick

New Orleans moves up 13 spots and sends… a fifth round pick and a future first! If you value the future first round pick as equivalent to say, the 24th overall pick (and don’t have a time value of money discount), the Saints paid 132 cents on the dollar on the JJ chart, and 173 cents on the dollar on my chart.  If you value the future first as the 16th overall pick (and don’t have a time value of money discount), they spent 156 cents on the dollar on the JJ chart and 187 cents on the dollar on the Football Perspective chart.

Thought of another way, using my chart, if we value the 2019 1st round pick as equal to the 26th overall pick, the Saints gave up the equivalent of the 2nd overall pick! That was quite a lot to draft UTSA defensive end Marcus Davenport, who you may recall from his performance in the 40-yard dash.  The Saints are clearly in win-now mode, and are willing to pay a premium to squeeze out every ounce of talent on the 2018 team. [continue reading…]

{ 0 comments }

Browns Appear Ready To Roll The Dice On Baker Mayfield

There is no such thing as safe quarterback prospect, at least in this year’s draft.  There are five marquee prospects, with scouts and draftniks coming away with very different views on them. They are, of course

For months, it seemed like Darnold and Rosen were the top two prospects, Allen (huge size, great arm, poor accuracy) and Mayfield (great stats, efficient, but undersized and a B12 QB) were the wildcards, and Jackson was the real wildcard (Heisman Trophy winner, great stats, unmatched athleticism, but questions about his pro QB ability).

And now, with the draft hours away, we still don’t know much. Jackson probably will be the fifth quarterback taken. Allen, who as recently as a week ago was becoming the favorite to go first overall, will probably be the third or fourth man taken. Allen, on most boards on #DraftTwitter, is the worst of the group, but it’s always been impossible to tell what NFL scouts actually think of him (not to mention NFL non-scouts). Darnold and Allen almost seem cut from a video game: they are your prototypical successful Pac-12 QBs who are smart with good arms and size. They also don’t seem to excite too many people, although the upside is certainly there with Darnold (still just 20 years old) and Rosen (probably the smartest of the bunch).

And then you have Mayfield.

[continue reading…]

{ 0 comments }

The broad jump isn’t the sexiest of drills, but it is another good way to measure a player’s all-around athletic ability. As a rule of thumb, the drill is biased in favor of lighter players (who can jump farther since they weigh less), but it’s also biased towards taller players, who have longer legs. Therefore, to adjust for weight and height, we use the following formula:

Broad Jump = 84.14 + 1.0766 * Height (Inches) – 0.1940 * Weight (Pounds)

Virginia Tech linebacker Tremaine Edmunds is expected to be a high first round pick, but his brother Terrell — a safety with the Hokies — was the combine champion at this event.  Standing 6’2, 220 pounds, Edmunds has prototypical safety size and is an elite athlete.  He had the 5th-best weight adjusted vertical, as he jumped a combine-high 41.5 inches.  In the broad jump, he would be expected to leap 121.1 inches based on his height and weight; in reality, he jumped 134 inches, or 12.9 inches above expectation.  That was the best mark at the 2018 combine.

The full results, below: [continue reading…]

{ 1 comment }

Penn State RB Saquon Barkley is your bronze champion. The star athlete ranked 3rd in the bench press after adjusting for weight and height, with his 29 reps tied for the most by any running back. And he ranked 3rd in the 40-yard dash after adjusting for weight; his 4.40 time was the second fastest among running backs, and the only player faster weighed 35 fewer pounds.

And today, you’ll see that Barkley ranked third in the vertical jump, too. The best-fit formula for projecting the vertical jump is as follows:

Projected VJ = 46.38 – 0.0597 * weight (pounds)

At 233 pounds, Barkley would be expected to have a 32.5 inch vertical jump. In reality, he jumped 41 inches, or 8.5 inches above expectation. That was the third-best mark at the combine, but only the 2nd best among Nittany Lions. That’s because Penn State TE Mike Gesicki jumped 41.5 inches at a whopping 247 pounds, or 9.9 inches above expectation.  The 40/240 club — jumping at least 40 inches while weighing at least 240 pounds — is a small one, and Gesicki stands out as being an elite athlete.

But it’s hard to compete with Barkley, who was dominant at the combine in the bench press, the 40, and the vertical jump. The full list, below: [continue reading…]

{ 1 comment }

In 2013, Cordarrelle Patterson led the NFL in kickoff return average at 32.4, with 1,393 yards and 2 TDs on 43 kickoff returns.

In 2015, Patterson again led the league in return average at 31.8, this time with 1,019 yards and two scores on 32 returns.

In 2016, Patterson repeated as kickoff returner champion, averaging 31.7 yards per return on 25 returns.

In 2017, Patterson was on the verge of a three-peat. Through 14 games, Patterson was averaging 28.3 yards per kickoff return, giving him a slight lead on Rams returner Pharoh Cooper.

And over the last two weeks of the season, Cooper saw his kickoff return average drop, while Patterson had one more return for 29 yards. Therefore, Patterson must have threepeated in the category of average kickoff return, right?

Well, not exactly. Through 14 games, Patterson had 18 returns, or 1.29 per team game. He finished the year with 19 returns, or 1.19 per team game. The problem is that the minimum number of kickoff returns to qualify for the league crown is 1.25 per team game. So Patterson failed to qualify by one return; if he had returned one additional kickoff for even 11 yards, he would have three-peated.

Patterson had 19 of the Raiders 34 kickoff returns. The real problem is the era: we are no longer in an era where the minimum should be 1.25 kickoff returns per team game. Why? Last year, just 12 players qualified! In 2010, there were 39 players who qualified, but in 2017, the limit would have needed to be dropped to single digits to get 39 players qualifying for that crown.

So what happened? Well, before the 2011 season, the NFL moved the kickoff from the 30 to the 35-yard line, which resulted in more touchbacks and fewer kickoff returns. And before the 2016 season, the NFL moved the starting field position after a touchback from the 20 up to the 25-yard line. Combined, those two changes have had quite the impact on the number of kickoff returns. The graph below shows the number of kickoff returns had by the average team in each season since 1950, with non-16 game seasons prorated to 16 games. [continue reading…]

{ 0 comments }

The 2013 Draft Was As Bad As You Thought It was

The 2013 Draft was not supposed to be a very good one. All you need to know: an offensive tackle from a MAC school, Eric Fisher, was the number one pick in a draft that was considered weak at the top.  You might think that pick was a bust, but… by 2013 standards, it was not.  Fisher has been a five-year starter and sneaks into the top 10 in AV from players in that draft!  That in itself is pretty remarkable, as Fisher hasn’t sniffed a Pro Bowl, but in a weak class, being a five-year starter at an important position let him rack up the AV.

The top player from that draft has been RB Le’Veon Bell, with two OL (David Bakhtiari and Travis Frederick) and a player about to join his third team (Sheldon Richardson) the next three players by AV.

How does the 2013 Draft compare to other drafts through five years? Because of the different number of picks in each draft, I decided to only examine the first 32 picks in each draft. The graph below shows the cumulative AV (through 5 seasons, regardless of whether they switched teams) provided by all players selected in the top 32 of each draft. [continue reading…]

{ 1 comment }

ANY/A, Rushing Yards, and Winning Percentage

Recency bias and ever-escalating statistics has led many modern fans to claim that the passing game today is more important than ever. That’s not really true.

But I decided to run another experiment (and check the 2017 data) on the importance of the passing game. I measured the correlation coefficient between winning percentage and Adjusted Net Yards per Attempt in 2017; it was 0.71, which indicates a very strong positive relationship. This is what you would expect: as ANY/A increases, so does winning percentage. Last year, the Saints, Patriots, Chargers, Rams, and Chiefs were the top 5 teams in ANY/A, and they combined for 54 wins and a 0.675 winning percentage. The bottom 5 teams in ANY/A? Cleveland, Denver, Green Bay, Baltimore, and Miami, who combined for just 26 wins and a 0.325 winning percentage.

So ANY/A was correlated with winning percentage in 2017, but that’s not too unusual. From 1974 to 1977, the correlation between the two measures was 0.75 or higher each year. There’s some random variation each year, but on average, the correlation coefficient has been about 0.66. Take a look: [continue reading…]

{ 3 comments }

The 2018 NFL Schedule

The color-coded schedule is back!

Download the Excel file here

Some notes:

As usual, the games are color-coded based on time: Thursday (the Thanksgiving slate is week 12, with Detroit/Chicago as the early game, Dallas/Washington in the afternoon, and Atlanta/New Orleans at night) games are in light red, Saturday games are in gray, Sunday games at 1PM have no color, Sunday afternoon games are in orange, Sunday night games are in green, and Monday night games are in blue.

There are four international games: in week 6, the Seahawks and Raiders (as the home team) play in London at 1PM Eastern. In weeks 7 and 8, the Titans and Chargers (home team) and then Eagles and Jaguars (home team) play in London at 9:30 AM on the east coast. In week 11, the Chiefs and Rams (home team) play in Mexico City on Monday Night Football. That game is color-coded in blue for Monday Night, but with yellow font for international. Yes, my schedule grid has an easter egg.

There are 17 MNF games. In week 1, the Jets and Lions are the early Monday Night game at 7:10, with the Rams and Raiders kicking off that night at 10:20. There is no Monday Night game in week 17.

There are two Saturday games, both in week 15: the Texans at the Jets and the Browns at the Broncos. No times have been set just yet. In addition, there will be two games on Saturday in week 16, but those will be announced during the season.

{ 0 comments }

Last year, Auburn defensive end Carl Lawson was your bench press champion. He finished ever so slightly ahead of Myles Garrett, and while Garrett was the first overall pick in the 2017 Draft, Lawson was a fourth rounder. But in 2017, Lawson led all rookies with 8.0 sacks, while Garrett finished second with 7.0 sacks (he did lead all rookies with 0.63 sacks per game). So does the bench press mean much? Who knows, but that won’t stop me from crunching the data from the 2018 combine.

The best-fit formula to project bench press reps for the 2017 Combine was:

Expected BP reps = 17.401 -0.3354 * Height (Inches) + 0.1075 * Weight (Pounds)

I used that formula to run through the 2018 combine numbers. The result? Georgia RB Nick Chubb was your bench press champion. Penn State RB Saquon Barkley, who ranked 3rd in yesterday’s results on the 40-yard dash, had another third-place finish. The full results, below.

RkNameCollegePOSWeight (lbs)Height (in)Exp BPBench PressDiff BP
1Nick ChubbGeorgiaRB2277118.02911.0
2Kylie FittsUtahDE2637620.23110.8
3Saquon BarkleyPenn StateRB2337218.32910.7
4Natrell JamersonWisconsinFS1987214.52510.5
5Dane CruikshankArizonaSS2067315.1259.9
6Braden SmithAuburnOG3157825.1359.9
7B.J. HillNorth Carolina StateDT3117625.3359.7
8Malik JeffersonTexasILB2367517.6279.4
9Will HernandezTexas-El PasoOG3277427.7379.3
10Christian SamArizona StateILB2447418.8289.2
11Tegray ScalesIndianaILB2307218.0279.0
12Quenton NelsonNotre DameOG3257726.5358.5
13Leon JacobsWisconsinOLB2467518.7267.3
14Andrew BrownVirginiaDE2967623.7317.3
15Davontae HarrisIllinois StateCB2007214.8227.2
16Colby GossettAppalachian State (NC)OG3117725.0327.0
17Foley FatukasiConnecticutDT3187626.1336.9
18Ogbonnia OkoronkwoOklahomaDE2537320.1276.9
19Taven BryanFloridaDT2917623.2306.8
20Anthony MillerMemphisWR2017115.2226.8
21Ola AdeniyiToledoDE2487419.2266.8
22JMon MooreMissouriWR2077514.5216.5
23Jordan WhiteheadPittsburghFS1957114.6216.4
24Genard AveryMemphisILB2487319.6266.4
25Lavon ColemanWashingtonRB2157116.7236.3
26Mike HughesCentral FloridaCB1917114.1205.9
27Chris WarrenTexasRB2477419.1255.9
28Hercules MataAfaWashington StateOLB2547320.2265.8
29Derwin JamesFlorida StateSS2157515.4215.6
30Marquis HaynesMississippiOLB2357517.5235.5
31Sony MichelGeorgiaRB2147116.6225.4
32Trevor DanielTennesseeP2307317.6235.4
33Trevon YoungLouisvilleDE2587619.6255.4
34Kentavius StreetNorth Carolina StateDE2807422.7285.3
35Anthony WinbushBall State (IN)OLB2497319.7255.3
36Kyzir WhiteWest VirginiaSS2167415.8215.2
37James LooneyCaliforniaDE2877523.1284.9
38Kenny YoungUCLAILB2367318.3234.7
39Davon GraysonEast Carolina (NC)WR1997314.3194.7
40Harold LandryBoston CollegeOLB2527519.3244.7
41Michael JosephDubuque (IA)CB1817312.4174.6
42Christian KirkTexas A&MWR2017015.5204.5
43Jerome BakerOhio StateOLB2297317.5224.5
44Josh JacksonIowaCB1927313.6184.4
45Taron JohnsonWeber State (UT)CB1807212.6174.4
46Wyatt TellerVirginia TechOG3147625.7304.3
47Tre FlowersOklahoma StateSS2007513.7184.3
48Bilal NicholsDelawareDT3067624.8294.2
49DaShawn HandAlabamaDE2977623.8284.2
50Dorian ODanielClemsonOLB2237316.9214.1
51Chris CovingtonIndianaOLB2457418.9234.1
52James HearnsLouisvilleOLB2397517.9224.1
53Kendrick NortonMiami (FL)DT3147526.0304.0
54Dallas GoedertSouth Dakota StateTE2567719.1233.9
55Mike GesickiPenn StateTE2477718.1223.9
56Godwin IgwebuikeNorthwesternFS2057215.3193.7
57Kamryn PettwayAuburnRB2337218.3223.7
58Keishawn BierriaWashingtonILB2307417.3213.7
59John Franklin-MyersStephen F. Austin (TX)DE2837622.3263.7
60Sam JonesArizona StateOG3057724.4283.6
61JaVon Rolland-JonesArkansas StateOLB2537419.8233.2
62Bradley ChubbNorth Carolina StateDE2697620.8243.2
63Joshua KaluNebraskaFS1957313.9173.1
64Jalyn HolmesOhio StateDE2837722.0253.0
65Darius JacksonJacksonville State (AL)OLB2427518.3212.7
66Chase EdmondsFordham (NY)RB2056916.3192.7
67Matt DickersonUCLADE2927623.3262.7
68Shaquem GriffinCentral FloridaOLB2277317.3202.7
69Josh AdamsNotre DameRB2137415.5182.5
70Damon WebbOhio StateSS1957114.6172.4
71Parry NickersonTulane (LA)CB1807212.6152.4
72Marcus DavenportTexas-San AntonioDE2647819.6222.4
73Mark WaltonMiami (FL)RB2027015.6182.4
74D.J. CharkLouisiana StateWR1997513.6162.4
75Siran NealJacksonville State (AL)SS1997214.6172.4
76Sean ChandlerTempleFS1907213.7162.3
77Brandon FacysonVirginia TechCB1977413.8162.2
78Shaun Dion HamiltonAlabamaILB2287217.8202.2
79Troy ApkePenn StateSS1987413.9162.1
80Garret DooleyWisconsinOLB2487518.9212.1
81Brian AllenMichigan StateC2987325.0272.0
82Chris HerndonMiami (FL)TE2537619.1211.9
83Trey QuinnSouthern Methodist (TX)WR2037115.4171.6
84Lowell LotuleleiUtahDT3157426.4281.6
85Joel IyiegbuniweWestern KentuckyILB2297317.5191.5
86Dylan CantrellTexas TechWR2267516.5181.5
87KC McdermottMiami (FL)OT3117824.7261.3
88Cole MadisonWashington StateOG3087724.7261.3
89Carlton DavisAuburnCB2037314.7161.3
90David WellsSan Diego StateTE2567818.8201.2
91Danny JohnsonSouthern (LA)CB1857013.8151.2
92Justin ReidStanfordFS2047314.8161.2
93Nick NelsonWisconsinCB2087115.9171.1
94Allen LazardIowa StateWR2277716.0171.0
95Jojo WickerArizona StateDE2967524.1250.9
96Frank RagnowArkansasC3127725.1260.9
97Roc ThomasJacksonville State (AL)RB1987015.2160.8
98Uchenna NwosuSouthern CaliforniaOLB2517519.2200.8
99Oren BurksVanderbiltOLB2337517.3180.7
100Marcus AllenPenn StateFS2027414.3150.7
101Kahlil MckenzieTennesseeDT3147725.3260.7
102Keke CouteeTexas TechWR1817013.4140.6
103Leighton Vander EschBoise StateOLB2567619.4200.6
104Dorance ArmstrongKansasDE2577619.5200.5
105Jason CabindaPenn StateILB2397318.6190.4
106Marcell HarrisFloridaSS2087215.6160.4
107Deshon ElliottTexasSS2057414.6150.4
108Kurt BenkertVirginiaQB2187515.7160.3
109Grant HaleyPenn StateCB1906914.7150.3
110Azeem VictorWashingtonILB2407318.7190.3
111Andre SmithNorth CarolinaILB2377218.7190.3
112Byron PringleKansas StateWR2037314.7150.3
113Holton HillTexasCB2007513.7140.3
114Chris CampbellPenn StateCB1947313.8140.2
115Tremaine EdmundsVirginia TechOLB2537718.8190.2
116Jaylen SamuelsNorth Carolina StateTE2257117.8180.2
117Max RedfieldIndiana (PA)SS2057315.0150.0
118Dominick SandersGeorgiaFS1937214.0140.0
119Alex CappaHumboldt State (CA)OT3057824.0240.0
120Josey JewellIowaILB2347318.118-0.1
121Trey WalkerLouisiana-LafayetteSS2007414.114-0.1
122Jordan WilkinsMississippiRB2167316.116-0.1
123Anthony AverettAlabamaCB1857213.113-0.1
124Jack CichyWisconsinILB2387418.218-0.2
125Chris JonesNebraskaCB1957214.214-0.2
126Jaire AlexanderLouisvilleCB1927114.214-0.2
127Scott QuessenberryUCLAC3107625.225-0.2
128Olubunmi RotimiOld Dominion (VA)DE2737621.321-0.3
129J.C. JacksonMarylandCB1937114.314-0.3
130Peter KalambayiStanfordOLB2527519.319-0.3
131Will ClappLouisiana StateC3117625.325-0.3
132Tony BrownAlabamaCB1987214.514-0.5
133Avonte MaddoxPittsburghCB1806913.613-0.6
134Darius LeonardSouth Carolina StateOLB2347417.717-0.7
135Dee DelaneyMiami (FL)CB1947313.813-0.8
136Durham SmytheNotre DameTE2537718.818-0.8
137D.J. MooreMarylandWR2107215.815-0.8
138Martinas RankinMississippi StateOT3087625.024-1.0
139Tanner CarewOregonLS2437319.018-1.0
140Ryan IzzoFlorida StateTE2567719.118-1.1
141Royce FreemanOregonRB2297118.217-1.2
142Nick DelucaNorth Dakota StateILB2517519.218-1.2
143Steven MitchellSouthern CaliforniaWR1897014.213-1.2
144Jarvion FranklinWestern MichiganRB2397119.318-1.3
145Duke DawsonFloridaCB2087016.315-1.3
146Ade ArunaTulane (LA)DE2627819.418-1.4
147Tyler ConklinCentral MichiganTE2547519.618-1.6
148Justin JacksonNorthwesternRB1997214.613-1.6
149Ray-Ray MccloudClemsonWR1906914.713-1.7
150Andre ChachereSan Jose StateCB2007214.813-1.8
151Justin JonesNorth Carolina StateDT3097425.824-1.8
152Mason ColeMichiganC3077624.923-1.9
153Derrick NnadiFlorida StateDT3177327.025-2.0
154Mike MccrayMichiganOLB2437618.016-2.0
155Mark AndrewsOklahomaTE2567719.117-2.1
156Marcell AtemanOklahoma StateWR2167615.113-2.1
157John KellyTennesseeRB2167017.115-2.1
158Dimitri FlowersOklahomaFB2487419.217-2.2
159Kalen BallageArizona StateRB2287317.415-2.4
160Ryan NallOregon StateRB2327417.515-2.5
161Armani WattsTexas A&MFS2057115.613-2.6
162Akrum WadleyIowaRB1947014.812-2.8
163Dalton SchultzStanfordTE2447717.815-2.8
164Kyle HicksTexas ChristianRB2047015.913-2.9
165Derrius GuiceLouisiana StateRB2247018.015-3.0
166Braxton BerriosMiami (FL)WR1846914.011-3.0
167Donnie ErnsbergerWestern MichiganFB2417518.215-3.2
168Chris WorleyOhio StateILB2387418.215-3.2
169Quadree HendersonPittsburghWR1926815.212-3.2
170Chris LacyOklahoma StateWR2057514.311-3.3
171Deon CainClemsonWR2027414.311-3.3
172Bo ScarbroughAlabamaRB2287317.414-3.4
173Justin CrawfordWest VirginiaRB1997115.011-4.0
174Davin BellamyGeorgiaOLB2557719.015-4.0
175Jordan ThomasMississippi StateTE2657720.116-4.1
176Troy FumagalliWisconsinTE2477718.114-4.1
177James DanielsIowaC3067525.121-4.1
178Rashaad PennySan Diego StateRB2207117.213-4.2
179Geron ChristianLouisvilleOT2987723.619-4.6
180Simmie CobbsIndianaWR2207515.911-4.9
181Michael GallupColorado StateWR2057315.010-5.0
182Will DisslyWashingtonTE2627620.115-5.1
183Kameron KellySan Diego StateFS2007414.19-5.1
184Sean WelshIowaOG3067525.120-5.1
185Zaycoven HendersonTexas A&MDT2987225.320-5.3
186Donte JacksonLouisiana StateCB1757112.47-5.4
187Joshua FrazierAlabamaDT3217626.421-5.4
188Kerryon JohnsonAuburnRB2137116.511-5.5
189Rashaan GauldenTennesseeFS1937313.78-5.7
190Demario RichardArizona StateFB2186917.712-5.7
191Austin CorbettNevadaOG3067624.819-5.8
192Jordan LasleyUCLAWR2037314.78-6.7
193Richie JamesMiddle Tennessee StateWR1837013.66-7.6
194Tyrell CrosbyOregonOT3097724.817-7.8
195Taylor HearnClemsonOG3207626.318-8.3
196Jamil DembyMaineOG3197626.217-9.2
197K.J. MaloneLouisiana StateOG3037624.515-9.5
198Orlando BrownOklahomaOT3458027.714-13.7

What stands out to you? Other than Orlando Brown finishing at the bottom for the second day in a row.

{ 1 comment }

UTSA defensive end Marcus Davenport is a likely first round pick who should be one of the more interesting stories of the draft’s opening night. He is also, pound for pound, the fastest man in the draft.

Last year, I used the following formula to project estimated 40-yard dash times based on weight:

Estimated 40-yard dash time = 3.283 + 0.00606 x weight (lbs)

Davenport weighted 264 pounds in Indianapolis, which would give him a projected time of 4.88 seconds.  But Davenport ran the 40 in a blistering 4.58 seconds, a remarkable 0.30 seconds faster than expected for a man of his size.

Georgia linebacker Lorenzo Carter weighed in at 250 pounds, and he ran the 40 in just 4.50 seconds! That’s also 0.30 seconds faster than the weight-influenced expectation of 4.80 for a man of his size. Davenport and Carter ran the two fastest 40-yard dashes after adjusting for weight at the combine. Coming in third? Perhaps the first non-QB off the board in the 2018 Draft, Penn State RB Saquon Barkley. [continue reading…]

{ 5 comments }

DeAndre Hopkins had a All-Pro year for the Houston Texans, who went 4-12 in a season defined by injuries. But week in, week out, the Texans could rely on Hopkins. In fact, he led the team in receiving yards in 13 of the first 15 games of the season, before sitting out the final week 17 game.

On the other side of the ledger, we have the Browns. Cleveland had 8 different players (Corey Coleman, Rashard Higgins, Duke Johnson, Ricardo Louis, Kasen Williams, David Njoku, Isaiah Crowell, and Seth Devalve) lead the team in receiving yards during its first 9 games!  Coleman led the team in receiving yards in games 10 and 11, and then Josh Gordon returned and led the Browns in receiving yards in 4 of the final 5 games of the season. Cleveland was one of just three teams that didn’t have a player lead the team in receiving yards in more than 4 games: [continue reading…]

{ 0 comments }

The 2017 Cleveland Browns went 0-16, a season the franchise would like to forget. The team’s best offensive player was running back Isaiah Crowell, who shouldered a very large percentage of the team’s rushing workload – at least among running backs. Quarterback DeShone Kizer finished second on the team in rushing yards, while backup running back Duke Johnson was the team’s leader in targets, receptions, and receiving yards — and it wasn’t particularly close.

One thing that was notable about Crowell’s season: among Browns running backs, Crowell was the leader in rushing yards in all 16 games. Four other teams had one player lead the team’s running backs in rushing in 15 of 16 games: the Rams with Todd Gurley, the Steelers with Le’Veon Bell, the Chiefs with Kareem Hunt, and the Colts with Frank Gore.  Los Angeles, Pittsburgh, and Kansas City all made the players and rested starters in week 17; Gurley, Bell, and Hunt led their teams in rushing in each of the first 15 team games of the season.  As for Indianapolis, Gore led the team in rushing each week with one notable exception: against the 49ers, Marlon Mack rushed 9 times for 91 yards, while Gore had 14 carries for only 48 yards against his former team.  Save that for the revenge game narrative.

We talk a lot about how running back by committee is retaking the league after the stud running back era of the mid-’00s.  Last year, for 15 of the league’s 32 teams, one running back led the team in rushing in 75% of their team’s games.  I’m not quite sure whether this is the best or even the right way to measure RBBC, but I do think it’s a useful balancing act against other, typical measures.

The table below shows, for each team, how many games one RB led all team running backs in rushing: [continue reading…]

{ 0 comments }

Twenty Years of Alabama Drafts

Over the last 20 drafts, there have been 101 players selected from the University of Alabama: [continue reading…]

{ 0 comments }

From 1973 to 1980, #88 on the Cowboys, Drew Pearson, was 22-29 years old. During that time, he:

  • Made 3 Pro Bowls and earned 3 AP first-team All-Pro honors
  • Ranked 3rd in receiving yards
  • Ranked 3rd in receptions
  • Ranked tied for 11th in receiving touchdowns
  • Played on a team that ranked 11th in pass attempts (mostly 26 teams)
  • Won a Super Bowl

From 1988 to 1995, #88 on the Cowboys, Michael Irvin, was 22-29 years old. During that time, he:

  • Made 5 Pro Bowls and earned 1 AP first-team All-Pro honor
  • Ranked 3rd in receiving yards
  • Ranked 6th in receptions
  • Ranked 7th in receiving touchdowns
  • Played on a team that ranked 18th in pass attempts (30 teams)
  • Won three Super Bowls

From 2010 to 2017, #88 on the Cowboys, Dez Bryant, was 22-29 years old. During that time, he:

  • Made 3 Pro Bowls and earned 1 AP first-team All-Pro honor
  • Ranked 8th in receiving yards
  • Ranked tied for 12th in receptions
  • Ranked 2nd in receiving touchdowns
  • Played on a team that ranked 21st in pass attempts (32 teams)

Bryant continued the rich tradition of Cowboy wide receivers wearing 88 to turn into stars.  He also may continue another Cowboys wide receiver tradition: being very, very good, but not quite Hall of Fame good.  In addition to Pearson, consider another Hall of Fame outsider: [continue reading…]

{ 0 comments }

There is no more polarizing quarterback prospect in this year’s draft than Wyoming’s Josh Allen. The buzz is getting louder that the Browns will select Allen with the first overall pick; the more analytically inclined observers think that would be a disaster. In some minds, Allen doesn’t even project as a first round pick.

Allen has a significant amount of bust potential but traditional quarterback size and one of the greatest arms you’ll ever see. That has naturally led to some comparisons to two of the biggest draft busts in recent memory: Ryan Leaf and JaMarcus Russell.

But a comparison to Leaf, Russell, and don’t make much sense. That’s because those guys were stars in college. Here is what Leaf did in his final season: he was extremely efficient despite easily leading the Pac-10 in passing attempts.  He averaged 9.7 yards per pass and lapped the Pac-10 in passing yards and touchdowns, ranking second in efficiency only to another future first round pick:

And Russell? Well, he led the SEC in Y/A and AY/A and also completion percentage in his final season.  He had fantastic rate stats and gross stats playing in the toughest conference in football, on top of being an incredible physical specimen.

[continue reading…]

{ 0 comments }

You know who the best player was in the 2000 Draft: Tom Brady, who has a career AV of 171. Brian Urlacher (118) is the only other player with a career AV of over 100.

I looked at the 46 drafts from 1967 (the first AFL-NFL common draft) through 2012 (there’s no clear cut-off of when to stop, but 2012 is about as late as you can push it). Of those 46 drafts, the top overall pick had the most AV in 6 drafts, and in another 7 drafts, the top AV came from the 2nd or 3rd overall pick. In half of these drafts, the top AV came from a top-15 pick, while in four of 46 drafts, it came from a player outside of the top 100.

The graph below shows, for each year, the draft pick that produced the most career AV.

And here’s the full list in table form: [continue reading…]

{ 1 comment }

Perhaps the best of many Minnesota teams to not win it all

With Kirk Cousins now in town, Minnesota is perhaps the most talented team in the NFL. But the Vikings are in a loaded NFC, with the defending Super Bowl champion Eagles, a Saints team that was the most efficient in football in 2017 and was seconds away from beating the Vikings in Minnesota in the playoffs, and a dreamy team in Los Angeles.  Oh, and Aaron Rodgers is back, making another NFC North title no sure thing.

Four years ago, Andrew Healy wrote about the most/least lucky teams when it comes to winning rings. At the time, the Eagles were the most unlucky franchise, but Philadelphia has since won a Super Bowl!  The Vikings were the second most unlucky team, while the Giants and Steelers were the two luckiest teams.

I like Andrew’s methodology and I’m not going to improve on it today, but wanted to run a simpler and quicker study.  In each seasons since the Super Bowl era, count how many games above .500 each team was in each season.  Seasons with .500 or worse records were given a zero.  So the Vikings were +10 in 2017 (13-3), 0 in 2016 (8-8), +6 in 2015 (11-5), 0 in 2014 (7-9), and so on. Since 1966, Minnesota has been +162, with +70 of that coming from 1966 to 1978. [continue reading…]

{ 0 comments }

An interesting article from Pro Football Weekly this week discusses that running backs are becoming more valuable in the draft, now that teams are going younger and cheaper at the position. After all, if you want a stud running back for cheap, you can only do it in the draft: we saw Ezekiel Elliott and Leonard Fournette each go fourth overall in the past two years, and it wouldn’t be a surprise to see Penn State RB Saquon Barkley go in that same position this year.

In addition, the article correctly points out that there were 30 running backs drafted last year, the most in any season since 1996.

In my mind, there are three essential components driving this turnaround: teams want to use running backs when they’re younger and still relatively fresh, they want them when they’re cheaper, and most importantly, with more teams employing some semblance of a strategic committee approach to their backfield hierarchy, they need more players at the position to ensure very little drop-off in performance from one back to the next.

However, that’s about where the argument ends. For starters, let’s look at draft capital spent on running backs during the common draft era: [continue reading…]

{ 2 comments }

Are Good Drafting Teams Also Bad At The Draft?

The Seahawks dominated the 2012 NFL Draft. Seattle drafted the best player, Russell Wilson, in the third round. The second most valuable pick of the draft was, by almost any measure, linebacker Bobby Wagner, a Hall of Fame candidate selected in the second round. The Seahawks even had one of the two or three best picks of the seventh round, in J.R. Sweezy.

And yet with its first pick in the draft, Seattle swung and missed on edge rusher Bruce Irvin, who played and started fewer games with the Seahawks than Sweezy.

The Redskins and Bucs had similar stories. Washington rolled snake eyes when it drafted RG3, although one could argue (depending on why you think he failed in D.C.) that his disappointing tenure with the Redskins wasn’t a fault of scouting. But the Redskins drafted Kirk Cousins in the 4th round and Alfred Morris in the 6th round — it was an extremely impressive draft once you forget the team’s first pick. Tampa Bay drafted a man without a position, safety/linebacker Mark Barron, with the seventh overall pick, and he lasted just 37 games with the team before being traded for 4th and 6th round picks. But the Bucs selected Doug Martin and Lavonte David with the team’s next two picks, and safety Keith Tandy was a good find (mostly on special teams) in the sixth round.

On the other side, you have the Panthers and Steelers. Carolina hit a home run with Luke Kuechly in the first round, but the Panthers next three picks have started just 37 games. The Panthers non-Kuechly portion of the draft was saved with Josh Norman in the sixth round, but even he only had one great year in Carolina.

Pittsburgh drafted an All-Pro in guard David DeCastro late in the first round, but the team’s next seven picks were disappointments. The Steelers final pick was OT Kelvin Beachum, a successful late round pick who started for two years in Pittsburgh. [continue reading…]

{ 1 comment }

On Thursday, I went on Baskin & Phelps on 92.3 The Fan in Cleveland to discuss the Browns 2018 draft strategy, and whether it still makes sense for a team like the Browns to trade down.

You can listen to the full segment here.

{ 0 comments }

The Rams Are Putting Together A Very Dreamy Team

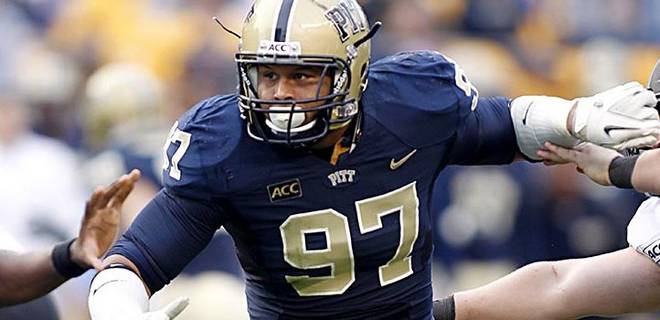
The player with the 12th-highest cap hit on the 2018 Rams. I wonder why?

This offseason, the Rams have traded for three high-profile players: WR Brandin Cooks (13 points of AV last year), CB Marcus Peters (13 points of AV in 2016, 5 points of AV last year), and CB Aqib Talib (14 points of AV in 2016, 9 points of AV last year).  Los Angeles also signed DT Ndamukong Suh (12 points of AV in 2016, 7 points last year).

That’s some top-level talent, at least on paper.  Suh was an AP first-team All-Pro in 2010, 2013, and 2014; the two All-Pro corners in 2016 by the Associated Press, Pro Football Writers Association, and the Sporting News were Talib and Peters. And Cooks is one of just three players to average 1,100 receiving yards and 8 touchdowns over the last three seasons.

And these four stars are joining perhaps the most star-studded team in the NFL:  the Rams had six first-team All-Pros as selected by the Associated Press last year: RB Todd Gurley, LT Andrew Whitworth, and DT Aaron Donald, along with special teamers Greg Zuerlein, Johnny Hekker, and Pharoh Cooper.  Oh, and by the way: QB Jared Goff led the NFL in Adjusted Net Yards per Attempt last season. Los Angeles is in position to spend in free agency in part because the team’s stars are cheap: the Rams drafted Donald in 2014 (with the team’s second first round pick, after drafting the biggest bust with its first selection), Gurley in 2015, and Goff in 2016, so all three players are being paid well below market value.

So, will the Rams really be as good in real life as they appear on paper?  Los Angeles is adding four new players who had AVs of at least 12 points either last year or the year before.  It’s been 23 years since a team did that, and that team was… the 1994 San Francisco 49ers.  That offseason, they added CB Deion Sanders (AV of 12 in 1993), DE Richard Dent (AV of 12 in 1993), LB Ken Norton (AV of 15 in ’93), and LB Rickey Jackson (AV of 13 in ’93). The 49ers also added C Bart Oates (AV of 10 in ’93). The 49ers already had an incredible offense, and with a better defense — and a better performance against Dallas in the NFCCG — San Francisco finally won another Super Bowl.

In recent years, some other teams have added 4 players with 10 points of AV in the prior year (or two years prior). This includes the 2014 Broncos team that nearly won the Super Bowl but would win it a year later; Denver added DE/LB DeMarcus Ware, C Will Montgomery, S T.J. Ward, and … CB Aqib Talib.

The 2011 Eagles — aka The Dream Team — added CB Nnamdi Asomugha, WR Steve Smith (the bad one), DE Jason Babin, and CB Dominique Rodgers-Cromartie, in addition to backup QB Vince Young, who coined the name.

The 2009 Chiefs added QB Matt Cassel, LB Mike Vrabel, WR Chris Chambers, and G Mike Goff.

The 2008 Jets added G Alan Faneca, QB Brett Favre, LB Calvin Pace, and DT Kris Jenkins.

And the 2002 Redskins added LB Jeremiah Trotter, LB Jessie Armstead, OL Larry Moore, and WR Willie Jackson.

The only other teams in modern history: the ’96 Ravens (Eric Turner, Rob Burnett, Tony Jones, and Leroy Hoard), the ’94 Chiefs (Greg Kragen, Eric Martin, Jerrol Williams, and Mark Collins), and ’85 Bills (Joe DeLamielleure, Joe Cribbs, Mike Pruitt, and Vince Ferragamo).

Los Angeles is going all-in on its 2018 roster, which is admirable in many ways. It sure feels like Los Angeles is adding an unusual amount of blue chip talent, and based on these results, the Rams are in pretty rare company.

How do you think the Rams will fare?

{ 1 comment }

Yesterday, I wrote that we are living in the golden age of NFL rookies.  I don’t think it’s controversial to state that — even after adjusting for era — five of the best six seasons by a rookie QB from 1970 to 2017 all came from active quarterbacks: Ben Roethlisberger in 2004, Matt Ryan in 2008, Russell Wilson and RG3 in 2012, and Dak Prescott in 2016.  Note that this doesn’t even include Andrew Luck in 2012 (who actually got more ORotY votes than Wilson) because he had mediocre efficiency numbers, or Deshaun Watson in 2017 because he was limited to just seven games, or Vince Young 06, Andy Dalton 2011, Cam Newton 2011, and Jameis Winston in 2015, who, along with Marino, Wilson, Griffin, Luck, and Prescott, are the only rookie quarterbacks to make the Pro Bowl since the merger. Or Sam Bradford, who won AP Offensive Rookie of the Year, something no quarterback other than Marino did from 1971 to 2003.

So, what gives? The graph below shows all rookie passers since 1970 to start at least 8 games and throw at least 150 passes. On the X-Axis, the year; on the Y-Axis, the passer’s ANY/A+, which is on a scale where 100 equals NFL league average, 115 represents one standard deviation above average, and 130 represents two standard deviations above average. [continue reading…]

{ 0 comments }

In December 2008, I wrote about the wonderful rookie seasons that Matt Ryan and, to a lesser extent, Joe Flacco, were having. I concluded that Ryan might very well finish with the greatest rookie season of all time. The only two rookie seasons (excluding “rookie” seasons that did not come immediately following the player’s final collegiate season) that came close since the merger were Dan Marino in 1984 and Ben Roethlisberger in 2004, and Ryan had them both beat on quantity (Marino started just 9 games, while Roethlisberger played for the most run-heavy team in the league).

Then, 2012 happened, when Russell Wilson, Andrew Luck, and RG3 all had great rookie seasons. Luck took a team from 2-14 to 11-5, set a rookie record for passing yards that still stands, and led the NFL with seven game-winning drives. He also was arguably the least-impressive of the trio. Griffin led the NFL in yards per attempt and in yards per carry. Wait just re-read that sentence again and let it sink in how remarkable that is. And then there was Wilson, who posted a 100.0 passer rating, led Seattle to an 11-5 record, and set a still-standing rookie record with 30 touchdowns.

In 2016, Dak Prescott basically out-Ryan’ed Ryan. His team went 13-3, Prescott set a rookie record with a 104.9 passer rating and 7.86 ANY/A. He had a 23/4 TD/INT ratio while also ranking 4th in NY/A.

And then last season, Deshaun Watson took the league by storm over seven games. Yes, it was only 7 games, but he produced 21 touchdowns and averaged 8.3 yards per attempt and a 103.0 passer rating. He also averaged 7.5 yards per carry and was certainly gearing up to be in the discussion for greatest rookie seasons in quarterback history.

[continue reading…]

{ 1 comment }

Yesterday, I looked at how much the NFL was relying on highly-drafted passers. The answer: quite a bit, as 50% of passes were thrown by a quarterback drafted in the top 32 or top 18 in each of the last three years.

That is certainly significant, but it’s not groundbreaking, either. Allow me to transport you back to 1972. The NFL had 26 teams, and 14 of those teams had a starting quarterback drafted in the top 10 or earlier! This includes Archie Manning (Saints), John Hadl (Chargers), Jim Plunkett (Patriots), Craig Morton (Cowboys), Norm Snead (Giants), Joe Namath (Jets), Roman Gabriel (Rams), Terry Bradshaw (Steelers), Mike Phipps (Browns), Len Dawson (Chiefs), Dan Pastorini (Oilers), Steve Spurrier (on the 49ers along with top-5 pick John Brodie), Marty Domres (Colts), and Earl Morrall (on the Dolphins along with top-5 pick Bob Griese). [1]Complicating things a bit was before 1967, there were two drafts: one by the NFL, and one by the NFL. Hadl was drafted 10th overall in the NFL Draft, and in the third round of the AFL Draft. Morton … Continue reading

The non-top 10 picks that year that were starters included Fran Tarkenton, Ken Anderson, Daryle Lamonica, Billy Kilmer, and Johnny Unitas. It may not have been a great passing year because of the rules in place at the time, but it sure had a lot of great quarterbacks. This was an era of Hall of Fame quarterbacks, even if 1972 just missed both Bart Starr and Dan Fouts.

On the other end of the spectrum is the 2001 season. An undrafted Jon Kitna, playing for the Bengals, led the NFL in pass attempts. Brad Johnson (Tampa Bay), was third in attempts; Aaron Brooks (Saints) and Rich Gannon (Raiders) rounded out the top 5, and neither was drafted in the first three rounds.

Kurt Warner (Rams, undrafted), Chris Weinke (Panthers, 106th pick), Trent Green (Chiefs, 222nd), Doug Flutie (Chargers, 285th), and Jeff Garcia (49ers, undrafted) all had 500+ pass attempts. Mark Brunell (Jaguars, 118), Elvis Grbac (Ravens, 219), Jay Fiedler (Dolphins, undrafted), Tom Brady (Patriots, 1999) and Jim Miller (Bears, 178) were starters, too. And Matt Hasselbeck (Seahawks, 187) and Alex Van Pelt (Bills, 216) led their teams in pass attempts, too. And backups in the NFC North (Ty Detmer, Shane Matthews, and Mike McMahon) combined for nearly a full season, too, and all were late round or undrafted quarterbacks.

If you sort each passer by draft order, you can see which draft pick is necessary to cross the 50% threshold. In 1972, you only had to go to the 10th pick; in other words, half of all passes that year came from players selected in the top 10 of the NFL or AFL Draft. In 2001, you had to go all the way down to pick 106. Over the last few years, the average is just north of the 20th overall pick.

The graph below shows the median passer (by draft slot) in each year since the merger: [continue reading…]

References

References
1 Complicating things a bit was before 1967, there were two drafts: one by the NFL, and one by the NFL. Hadl was drafted 10th overall in the NFL Draft, and in the third round of the AFL Draft. Morton was drafted 5th overall in the NFL Draft, and in the tenth round of the AFL Draft. Snead was a 2nd overall NFL pick, and a 5th round AFL selection.  I have used their NFL Draft choices in all instances, because I think that better reflects their prospective ability: they were low AFL draft picks because the AFL teams didn’t think they had a great chance at getting the player.  Hadl went to San Diego because the Chargers would let him play quarterback, while the Lions wanted him at running back. Gabriel was a top-two pick in both drafts. Namath was the first overall pick in the AFL Draft, and fell in the NFL Draft because the league didn’t think they could sign him.
{ 0 comments }

In 2017, there were seven former number one overall picks who were their team’s main quarterback: Eli Manning, Matthew Stafford, Alex Smith, Cam Newton, Jared Goff, Jameis Winston, and Carson Palmer. An eighth, Sam Bradford, was going to be the Vikings starter, but he was injured early in the season.

Three more starting QBs were second overall picks: Marcus Mariota, Carson Wentz, and Mitch Trubisky. And another three were top five picks (Matt Ryan, Blake Bortles, and Philip Rivers).

Had former 24th overall pick Aaron Rodgers played a full season, it’s likely that half of all passes thrown in 2017 would have come from players drafted 24th overall or earlier. With the Rodgers injury, the next passer (in terms of draft status) was Paxton Lynch (26th pick), who only threw 45 passes. Players drafted 26th or earlier were responsible for 49% of all passes in 2017. To cross the 50% mark, you need to drop down to 32nd overall, which brings in Drew Brees. Players drafted 32nd overall or earlier were responsible for 52% of all passes in 2017.

That number is down slightly from 2016, in large part because Sam Bradford and Andrew Luck combined for over 1,000 attempts in 2016 and just 43 last year. The NFL also lost over 500 combined attempts from Robert Griffin and Ryan Tannehill — as a result, in 2016, quarterbacks drafted 18th overall (Joe Flacco) or earlier were responsible for 52% of all passing attempts.

The Flacco line was also the line of demarcation in 2015, which was boosted by having Peyton Manning, Luck, Bradford, and Tannehill as starters relative to 2017. Depending on how this year’s draft goes and how early those quarterbacks start, there’s a good chance that the Flacco line is once again the median mark.

In fact, 2018 could have the 12th overall pick as the median mark, assuming good health (which, of course, is a terrible thing to assume).  But let’s assume that three out of Sam Darnold, Josh Rosen, Josh Allen, and Baker Mayfield wind up as top 12 picks and starting quarterbacks, and let’s place them on the Browns, Jets, and Bills.   That would mean 18 of 32 starters would be top 12 picks.  We would also see 22 of the league’s 32 starters be top-18 draft picks, up from 16 a year ago.

How do we get there? [continue reading…]

{ 1 comment }

Which Team Lost The Most Between 2016 and 2017?

The 2016 Bills had a pretty serious amount of roster turnover, particularly among players who went to new teams (rather than due to injury or because they were out of the league). Some, like wide receivers Marquise Goodwin, Robert Woods, and Sammy Watkins, had more success with their new teams. Others, like defenders Stephon Gilmore, Corey Graham, and Zach Brown, were better off in Buffalo.

There were 19 players who were on the 2016 Bills and played for a different team in 2017. In total, those players produced 62 points of AV in 2016 in Buffalo, and then 55 points of AV in 2017 not in Buffalo. The full list, below:

PlayerPos2016 Team2016 AVV2017 Team2017 AVDiff
Marquise GoodwinWRbuf4sfo84
Robert WoodsWRbuf6ram82
Sammy WatkinsWRbuf4ram62
Nickell Robey-ColemanCBbuf2ram31
Kevon SeymourCBbuf1car21
Ronald DarbyCBbuf4phi40
Mike GillisleeRBbuf4nwe40
Garrison SanbornCbuf1tam10
EJ ManuelQBbuf1rai10
Lerentee McCrayLBbuf1jax10
Jim DrayTEbuf0crd00
Bryson AlbrightLBbuf0crd00
Leger DouzableDTbuf3sfo2-1
Michael OlaTbuf1sdg0-1
Justin HunterWRbuf2pit0-2
Stephon GilmoreCBbuf8nwe5-3
Corey GrahamDBbuf5phi2-3
Cyrus KouandjioOTbuf4den1-3
Zach BrownOLBbuf11was7-4

With 62 points of lost AV, no team lost more than the Bilsl last year. But that doesn’t always mean much: the Rams were third with 52 points of lost AV, and the Bills and Rams both made the postseason. Even looking at 2017 AV isn’t necessarily going to tell us much: the switching players produced 55 points outside of Buffalo, the most by former players of any team last year. Another way to look at it is to see how these players did outside of their old teams. And here, Bills players did worse outside of Buffalo, at -7 points of net AV. You might be surprised, tho, that I’m not sure if this tells us much, either: the Patriots and Jaguars were two of the four teams to see their former players produce 10+ points more AV in their new homes. For New England, Jacoby Brissett, Jabaal Sheard, LeGarrette Blount, Jimmy Garoppolo, Logan Ryan, and Barkevious Mingo all produced at least 4 points of AV in 2017 on new teams. The same is true of Kelvin Beachum, Hayes Pullard, Tyson Alualu, Luke Joeckel, Prince Amukamara, and Davon House with respect to the Jaguars. But it’s not like Jacksonville or New England was any worse for the wear.

The table below shows the lost AV for each team, along with the AV produced by those players in their new homes in 2017, and the net difference. [continue reading…]

{ 0 comments }

The 2017 49ers Turned Over Half Their Starts

The 2016 49ers were not very good, finishing 2-14 with both wins coming against a bad Rams team. So perhaps it isn’t too surprising that San Francisco — with a new GM (John Lynch) and new HC (Kyle Shanahan) — decided to turn over most of the roster.

Each team has 352 starts to give out each year (22 spots over 16 games). For San Francisco, 176 of them came from players who weren’t on the active roster in 2016, and 176 came from players who were. Take a look: [continue reading…]

{ 0 comments }