≡ Menu

Season in review: AFC and NFC East

This season, I published power rankings after each week where I stated my updated projected number of wins for each team. The point of those posts was to put in writing my thoughts at that time, so that once the season was over, I could look back and see how I did. Over the next two weeks, that’s exactly what we’re going to do.

The picture below graphs my projections for each team for each week of the season. I’ve also added the Vegas futures win totals for each team from the pre-season as the first data point in each graph and the final number of regular season wins for each team as the final data point. My projected win totals for each week N come following the conclusion of week N (i.e., my week 1 power rankings were released after week 1).

AFC East

New England Patriots

Pre-season Projection: 12 wins
Maximum wins: 13 (after weeks 1 and 14)
Minimum wins: 10 (after weeks 6 and 7)
Week 1 comment: Incredible offensive weapons, an improved defense and a cupcake schedule. Only injuries on the offensive line or to Tom Brady could derail them.

The Patriots started hot with a big win over the Titans, but managed to lose nail-biters to the Cardinals and Ravens the next two weeks. A loss in Seattle — which was an upset, at the time — dropped them to 3-3 and my projected total to just 10 wins. An overtime win over the Jets the following week was unimpressive and didn’t cause me to bump them, but I kept steadily increasing their win total after that.

In the end, it was another monster statistical season for Brady and the Patriots. New England broke a record for offensive first downs and finished with the third most points scored in a season. I was a little bumpy in my New England projections, but they ended up landing right on the Vegas number.

New York Jets
Pre-season Projection: 8.5 wins
Maximum wins: 9 (after weeks 1 and 2)
Minimum wins: 6 (first after week 8)
Week 1 comment: The additions of Quinton Coples and LaRon Landry were easy to mock, but these two could make the Jets defense a top-three unit. So far, so good. Right tackle Austin Howard exceeded expectations by infinity against Mario Williams, and his play this year will be tied to the Jets success on offense.

The Jets best game of the season came in week 1, which inspired a glimmer of early-season hope. In the end, Coples and Landry had strong seasons, but the loss of Darrelle Revis and the disappointing years by Calvin Pace, Bryan Thomas, and Aaron Maybin prevented the Jets from having a complete defense. Mark Sanchez regressed, and injuries to Santonio Holmes, Dustin Keller, and Stephen Hill didn’t help the offense. Rex Ryan lost control of the team, again, and the Jets struggled against good teams early before disappointing against bad teams late. For the second straight year, the Jets lost their final three games of the season, and it appears like they will fire the offensive coordinator again, too.
[continue reading…]

{ 1 comment }

In 2011, the Broncos scored 309 points and allowed 390 points. Despite being outscored by 81 points, the Tim Tebow express still made it into the post-season. In June, I speculated that the 2012 Broncos might set the record for the largest increase in pass completions in one year, and they did just that on Sunday. They also moved into fourth place on another list.

With 481 points and 289 points allowed, Denver outscored its opponents by 192 points in 2012. Peyton Manning and Von Miller have turned the Broncos into one of the best teams in the league a year after they were one of the worst (at least, as measured by points differential). Denver improving their points differential by a whopping 273 points this year relative to 2011, the fourth largest increase in football history.

RankYearTeamPFPADiffN-1 PFN-1 PAN-1 DiffImpr
11999St. Louis Rams526242284285378-93377
21929New York Giants3128622679136-57283
32001Chicago Bears338203135216355-139274
42012Denver Broncos481289192309390-81273
51998Minnesota Vikings556296260354359-5265
61975Baltimore Colts395269126190329-139265
72004San Diego Chargers446313133313441-128261
82006New Orleans Saints41332291235398-163254
91965Chicago Bears409275134260379-119253
102008Baltimore Ravens385244141275384-109250
111955Washington Redskins24622224207432-225249
121976New England Patriots376236140258358-100240
131963Oakland Raiders36328281213370-157238
141997New York Jets34828761279454-175236
151923Columbus Tigers119358424174-150234
161987Indianapolis Colts30023862229400-171233
171991Cleveland Browns293298-5228462-234229
181967New York Giants369379-10263501-238228
191969Atlanta Falcons2762688170389-219227
202010Detroit Lions362369-7262494-232225
211976Chicago Bears25321637191379-188225
222001Cleveland Browns285319-34161419-258224
231999Indianapolis Colts42333390310444-134224
242000New Orleans Saints35430549260434-174223
252010St. Louis Rams289328-39175436-261222
{ 1 comment }

Trent Richardson thinks this guy was an average running back in losses.

Trent Richardson thinks this guy was an average running back in losses.

Yesterday, I noted that Adrian Peterson is averaging nearly two more yards per rush in losses than wins. He’s also averaging a nearly identical number of rushing yards per game in wins and losses.

As you’re about to see, that’s pretty rare. We all know that wins are correlated with rushing yards, so it should come as no surprise that running backs generally gain more rushing yards in wins than in losses.

I looked at all games, including playoffs, from 1960 to 2011, for all players with at least 3,000 rushing yards over that time period. The table below lists the following information for each player:

— His first year (or 1960, if he played before 1960) and his last year (or 2011, if still active)
— All the franchises he played for (which you can search for in the search box)
— His number of career wins, and his career rush attempts, rushing yards, rushing yards per carry, and rushing yards per game in wins
— His number of career losses, and his career rush attempts, rushing yards, rushing yards per carry, and rushing yards per game in losses

The table is sorted by rushing yards per game in wins. Again, for players like Jim Brown or Peterson, they are included but only their stats from 1960 to 2011 are shown. The table only shows the top 50 players, but the search feature works for the entire table, which includes 281 players. In addition, you can click on the drop arrow and change the number of rows shown.

As always, the table is fully sortable. If you click twice on the far right column, you see the career leaders in rushing yards per game in losses. You probably aren’t surprised to see Barry Sanders at the top, but the presence of the running back formerly known as Dom Davis up there is a bit surprising. Steven Jackson is one of the few players who have averaged over 70 rushing yards per game in losses, which jives with the sixth post in Football Perspective history. In addition, Jackson (at least through 2011) and LaDainian Tomlinson form an interesting example of Simpson’s Paradox: Jackson has a higher career rushing yards per game average in both wins (93.9 to 89.9) and losses (71.1 to 63.2), while Tomlinson has the higher career average overall (78.6 to 78.3).

RkPlayerYearsTeamsPosWRsh_WYd_WYPC_WYd/G_WLRsh_LYd_LYPC_LYd/G_L
1Jim Brown1960--1965cleFB55117665905.6119.82538417064.4468.2
2Terrell Davis1995--2001denRB58141568674.85118.42844418804.2367.1
3Barry Sanders1989--1998detRB75167085265.11113.784148371294.8184.9
4Eric Dickerson1983--1993ram-clt-rai-atlRB74177684114.74113.778136855724.0771.4
5O.J. Simpson1969--1979buf-sfoRB4395048185.0711292144263514.469
6Earl Campbell1978--1985oti-norRB50120954094.47108.270111344183.9763.1
7Adrian Peterson2007--2011minRB3879240025.05105.33868530184.4179.4
8Chris Johnson2008--2011otiRB3677237764.89104.92842619414.5669.3
9Clinton Portis2002--2010den-wasRB58128160514.72104.359101940864.0169.3
10Arian Foster2009--2011htxRB2042820774.85103.91628213054.6381.6
11Emmitt Smith1990--2004dal-crdRB1353036131984.3597.8108172267433.9262.4
12Jamal Lewis2000--2009rav-cleRB74165371934.3597.263101938403.7761
13Walter Payton1975--1987chiRB1132460109754.4697.186155863834.174.2
14Larry Johnson2003--2011kan-cin-was-miaRB4081338424.7396.14362724133.8556.1
15Edgerrin James1999--2009clt-crd-seaRB99225194694.2195.66299536293.6558.5
16Billy Sims1980--1984detRB3060328614.7495.43255423784.2974.3
17Curtis Martin1995--2005nwe-nyjRB96223591344.0995.182146557623.9370.3
18Frank Gore2005--2011sfoRB4793944224.7194.15574333664.5361.2
19Jamaal Charles2008--2011kanRB1621815046.9943429016055.5347.2
20Steven Jackson2004--2011ramRB3776934734.5293.980138856884.171.1
21Shaun Alexander2000--2008sea-wasRB73150666074.3990.55985034104.0157.8
22LaDainian Tomlinson2001--2011sdg-nyjRB104204893464.5689.976125748063.8263.2
23Corey Dillon1997--2006cin-nweRB72139164604.6489.786134752893.9361.5
24Rudi Johnson2001--2008cin-detRB4190136724.0889.65262923633.7645.4
25Eddie George1996--2004oti-dalRB90209478633.7687.46097733543.4355.9
26Wilbert Montgomery1977--1985phi-detRB55101647664.6986.75465225133.8546.5
27Fred Taylor1998--2010jax-nweRB89158876744.8386.272107546344.3164.4
28Jamal Anderson1994--2001atlRB3776731894.1686.24763224233.8351.6
29Gale Sayers1965--1971chiRB2942624925.8585.93651021224.1658.9
30Barry Foster1990--1994pitRB3570429974.2685.62327512304.4753.5
31Curt Warner1983--1990sea-ramRB55113347044.1585.54863623893.7649.8
32Matt Forte2008--2011chiRB3566129854.5285.32739513983.5451.8
33Cookie Gilchrist1962--1967buf-den-miaFB3462528714.5984.43137213813.7144.5
34William Andrews1979--1986atlRB4374936094.8283.94258624394.1658.1
35Marshall Faulk1994--2005clt-ramRB99177483074.6883.989122745743.7351.4
36John Henry Johnson1960--1966pit-otiFB-HB3258926824.5583.83843517183.9545.2
37Tony Dorsett1977--1988dal-denRB1212237101374.5383.868100139853.9858.6
38Jerome Bettis1993--2005ram-pitRB111233392743.9883.593134550623.7654.4
39Priest Holmes1997--2007rav-kanRB61109350774.6583.24972933164.5567.7
40Ricky Watters1992--2001sfo-phi-seaRB91182375524.14836396337203.8659
41Jim Nance1965--1973nwe-nyjRB3057124554.381.86268025853.841.7
42Robert Smith1993--2000minRB63103951464.9581.74151722624.3855.2
43George Rogers1981--1987nor-wasRB53100943264.2981.64577231284.0569.5
44Jim Taylor1960--1967gnb-norFB81146865764.4881.23140115823.9551
45Travis Henry2001--2007buf-oti-denRB3667229064.3280.75281631803.961.2
46Willie Parker2004--2009pitRB5597744364.5480.72740314133.5152.3
47Ray Rice2008--2011ravRB4579236274.5880.62227411944.3654.3
48Maurice Jones-Drew2006--2011jaxRB4577636164.6680.45072232864.5565.7
49Deuce McAllister2001--2008norRB5091340174.480.34754322404.1347.7
50Thurman Thomas1988--2000buf-miaRB1302373103784.3779.87184331383.7244.2
51Terry Allen1991--2001min-was-nwe-nor-ravRB69130355044.2279.86589032633.6750.2
52Fred Jackson2007--2011bufRB2539319805.0479.24042418144.2845.4
53Jonathan Stewart2008--2011carRB2841422175.3679.23531412954.1237
54Franco Harris1972--1984pit-seaRB1362553106824.1878.55577629243.7753.2
55John Riggins1971--1985nyj-wasRB103204880883.9578.579111942603.8153.9
56Tiki Barber1997--2006nygRB80127762694.9178.480105446324.3957.9
57Lydell Mitchell1972--1980clt-sdg-ramRB58110344724.0577.14964522803.5346.5
58Ricky Williams1999--2011nor-mia-ravRB81148662214.1976.8709673868455.3
59Greg Bell1984--1990buf-ram-raiRB3559626414.4375.55068426763.9153.5
60Marshawn Lynch2007--2011buf-seaRB3159223373.9575.44356823384.1254.4
61Stephen Davis1996--2006was-car-ramRB72123454224.3975.36380731013.8449.2
62LeSean McCoy2009--2011phiRB2842721004.9275202259964.4349.8
63Domanick Williams2003--2005htxRB122268983.9774.82854422974.2282
64Hoyle Granger1966--1972oti-norRB2744320134.5474.63835815304.2740.3
65DeAngelo Williams2006--2011carRB3855728335.0974.64345122775.0553
66Rodney Hampton1990--1997nygRB56104841223.9373.65182629693.5958.2
67Ahman Green1998--2009sea-gnb-htxRB89141665454.6273.56375931814.1950.5
68Earnest Jackson1983--1988sdg-phi-pitRB3154422794.1973.54451518883.6742.9
69Lawrence McCutcheon1973--1981ram-den-sea-bufRB75124354624.3972.83842216934.0144.6
70Freeman McNeil1981--1992nyjRB71113251094.51727578233644.344.9
71Rashard Mendenhall2008--2011pitRB3764626434.0971.4172289544.1856.1
72Warrick Dunn1997--2008tam-atlRB98161869964.3271.492116743713.7547.5
73Cedric Benson2005--2011chi-cinRB5092535683.8671.44564724463.7854.4
74Natrone Means1993--1999sdg-jaxRB55100439173.971.23954919483.5549.9
75Gary Brown1991--1999oti-sdg-nygRB4061928414.59713542414763.4842.2
76Michael Turner2004--2011sdg-atlRB76113053914.7770.93837614573.8838.3
77Christian Okoye1987--1992kanRB447803120470.93544717713.9650.6
78Karim Abdul-Jabbar1996--2000mia-cle-cltRB3365123393.5970.93138811883.0638.3
79Garrison Hearst1993--2004crd-cin-sfo-denRB76121053854.4570.95568128404.1751.6
80Joe Morris1982--1991nyg-cleRB63110344604.0470.85044816783.7533.6
81Johnny Johnson1990--1994crd-nyjRB2442816853.9470.24761823933.8750.9
82Thomas Jones2000--2011crd-tam-chi-nyj-kanRB88154161543.9969.999126249503.9250
83Chuck Muncie1976--1984nor-sdgRB5181735544.3569.76585436644.2956.4
84Chuck Foreman1973--1980min-nweRB77132453184.0269.13842614093.3137.1
85Ottis Anderson1979--1992crd-nygRB94163064893.986980103342174.0852.7
86Larry Csonka1968--1979mia-nygRB91138762234.4968.46469125873.7440.4
87Randy McMillan1981--1986cltRB2028213654.8468.36669524843.5737.6
88John Brockington1971--1977gnb-kanRB3663724563.8668.25465123083.5542.7
89Ryan Grant2007--2011gnbRB4567030524.5667.82231312914.1258.7
90Willis McGahee2004--2011buf-rav-denRB66104244154.2466.96185933593.9155.1
91Ron A. Johnson1969--1975cle-nygRB3762924263.8665.64153317293.2442.2
92Joe Cribbs1980--1988buf-sfo-miaRB5583435804.2965.14952319613.7540
93Marcus Allen1982--1997rai-kanRB145222194334.2565.191106841573.8945.7
94Antowain Smith1997--2005buf-nwe-oti-norRB75124848723.9656167425593.842
95Larry Brown1969--1976wasRB69117144413.7964.43546417803.8450.9
96Kevin Jones2004--2008det-chiRB2232614154.3464.34146917613.7543
97Floyd Little1967--1975denRB4573828803.9646782031873.8947.6
98Wendell Tyler1977--1986ram-sfoRB7193145104.8463.54655024434.4453.1
99Ricky Bell1977--1982tam-sdgRB253971588463.53846215913.4441.9
100Abner Haynes1960--1967kan-den-mia-nyjHB4860130465.0763.56043915923.6326.5
101Cadillac Williams2005--2011tam-ramRB3350520944.1563.55056819933.5139.9
102Clem Daniels1960--1968kan-rai-sfoRB5168932364.763.54940116694.1634.1
103Pete Johnson1977--1984cin-sdg-miaRB64102839953.8962.45053818793.4937.6
104Leonard Russell1991--1996nwe-den-ram-sdgRB3154919343.5262.45161520393.3240
105Bam Morris1994--1999pit-rav-chi-kanRB396052423462.13744416363.6844.2
106Rueben Mayes1986--1993nor-seaRB3655522334.02624031412624.0231.6
107Errict Rhett1994--2000tam-rav-cleRB3663522133.4961.54253919303.5846
108Anthony Thomas2001--2007chi-dal-nor-bufRB3962823953.8161.44943115323.5531.3
109James Wilder1981--1990tam-detRB3248119644.0861.486112341603.748.4
110Joseph Addai2006--2011cltRB6294338044.0361.42631012704.148.8
111Marion Butts1989--1995sdg-nwe-otiRB507663067461.35560122623.7641.1
112Matt Snell1964--1972nyjRB4264125734.0161.33543518494.2552.8
113Delvin Williams1974--1980sfo-miaRB5174531154.1861.14758825254.2953.7
114James Brooks1981--1992sdg-cin-cle-tamRB8397650605.18618676731184.0736.3
115Kevin Mack1985--1993cleRB5175331094.13615464524383.7845.1
116Mike Thomas1975--1980was-sdgRB5279631633.9760.82831911483.641
117Neal Anderson1986--1993chiRB6899241304.1660.74960423153.8347.2
118Paul Lowe1960--1969sdg-kanHB6676739985.2160.62822810754.7138.4
119DeShaun Foster2003--2008car-sfoRB4768928334.1160.33332311383.5234.5
120Napoleon Kaufman1995--2000raiRB4651227605.39604646720364.3644.3
121Mike Garrett1966--1973kan-sdgRB6282337124.5159.94147717033.5741.5
122Dave Hampton1969--1976gnb-atl-phiRB3654721443.9259.65558322963.9441.7
123Leroy Kelly1964--1973cleRB92126854654.3159.44953821453.9943.8
124Sam Cunningham1973--1982nweRB5380031333.9259.15261524303.9546.7
125Duce Staley1997--2006phi-pitRB6692338814.258.85262123683.8145.5
126Charlie Garner1994--2004phi-sfo-rai-tamRB6983040354.8658.58278435034.4742.7
127Mike Rozier1985--1991oti-atlRB4565426224.0158.35256020223.6138.9
128Brian Westbrook2002--2010phi-sfoRB8097146604.858.34952922064.1745
129Mark van Eeghen1974--1983rai-nweRB96139355613.9957.94143217143.9741.8
130Julius Jones2004--2010dal-sea-norRB4868427754.0657.84863624723.8951.5
131Marion Barber2005--2011dal-chiRB5978334074.3557.74441415243.6834.6
132James Stewart1995--2002jax-detRB5482831083.7557.65368128954.2554.6
133Eddie Lee Ivery1979--1986gnbRB3540720144.9557.5342448913.6526.2
134Ken Willard1965--1974sfo-crdRB69100339553.9457.35857919633.3933.8
135Mike Pruitt1976--1986cle-buf-kanRB6794438404.0757.37692136053.9147.4
136Marv Hubbard1969--1977rai-detRB6676737734.9257.2242258673.8536.1
137Gerald Riggs1982--1991atl-wasRB6289435443.9657.272111046904.2365.1
138Ronnie Brown2005--2011mia-phiRB4359624484.1156.95058625224.350.4
139Adrian Murrell1993--2003nyj-crd-was-dalRB4463724943.9256.77276528623.7439.8
140Don Perkins1961--1968dalFB-HB5575831074.156.55175430794.0860.4
141Lamar Smith1994--2003sea-nor-mia-carRB5481130433.7556.45856520303.5935
142Mike Anderson2000--2007den-ravRB5871632544.5456.1402509763.924.4
143J.D. Smith1960--1966sfo-dalFB-HB3345118504.156.13641115643.8143.4
144Ted Brown1979--1986minRB5066027994.24565649919073.8234.1
145Dick Bass1960--1969ramFB-HB4759026124.4355.65956725044.4242.4
146Sammy Winder1982--1990denRB80119544433.7255.55242313563.2126.1
147Emerson Boozer1966--1975nyjRB5477429843.8655.35851820924.0436.1
148Ed Podolak1969--1977kanRB4865526304.0254.84742314823.531.5
149Earnest Byner1984--1997cle-was-ravRB111152260643.9854.610275730344.0129.7
150Brandon Jacobs2005--2011nygRB7186238694.4954.53933614414.2936.9
151Roger Craig1983--1993sfo-rai-minRB127165868734.1554.15352921063.9839.7
152Mel Farr1967--1973detRB3137716774.4554.1272929603.2935.6
153Bobby Humphrey1989--1992den-miaRB3342217814.22542234213383.9160.8
154Jim Otis1970--1978nor-kan-crdRB5778230573.9153.65139113353.4126.2
155Chris Warren1990--2000sea-dal-phiRB7087237434.2953.59194840614.2844.6
156Ahmad Bradshaw2007--2011nygRB5256527804.9253.5272469173.7334
157John Stephens1988--1993nwe-gnb-kanRB2841014773.652.85953519633.6733.3
158Gary W. Anderson1985--1993sdg-tam-detRB3642018994.5252.87344915103.3620.7
159Otis Armstrong1973--1980denRB5872130554.2452.73932114084.3936.1
160Mercury Morris1969--1976mia-sdgRB7473738965.2952.6331616824.2420.7
161Kevan Barlow2001--2006sfo-nyjRB3745119464.3152.65058320743.5641.5
162Tom Sullivan1972--1978phi-cleRB2637513593.6252.35148316833.4833
163Reggie Cobb1990--1996tam-gnb-jax-nyjRB2940715143.7252.26267022553.3736.4
164Hewritt Dixon1963--1970den-raiRB-TE5567728614.2352381615533.4314.6
165Altie Taylor1969--1976det-otiRB5471827943.8951.74541714063.3731.2
166Tony Collins1981--1990nwe-miaRB5668228854.2351.55355619623.5337
167Sherman Smith1976--1983sea-sdgRB3540317924.4551.25343117284.0132.6
168Justin Fargas2003--2009raiFB2528712784.4551.16554020913.8732.2
169Edgar Bennett1992--1999gnb-chiRB6489932643.63514737912893.427.4
170Terry Metcalf1973--1981crd-wasRB-WR4649923414.6950.93628212164.3133.8
171Calvin Hill1969--1981dal-was-cleRB96114548844.2750.95439515593.9528.9
172Michael Vick2001--2011atl-phiQB6545932877.1650.65129721657.2942.5
173MacArthur Lane1968--1978crd-gnb-kanRB5260226204.3550.46755118843.4228.1
174Larry Kinnebrew1983--1990cin-bufRB3745818634.0750.44032812873.9232.2
175Gerry Ellis1980--1986gnbRB4647923144.8350.35435014994.2827.8
176Barry Word1987--1993nor-kan-minRB4554122354.1349.7242238593.8535.8
177Johnny Roland1966--1973crd-nygRB4050119683.9349.24742714583.4131
178Herschel Walker1986--1997dal-min-phi-nygRB8496241224.2849.1106102042354.1540
179Curtis Dickey1980--1986clt-cleRB3038314673.8348.95155325454.649.9
180Keith Lincoln1961--1968sdg-bufFB-HB4744022945.2148.83830812554.0733
181Boobie Clark1973--1980cin-otiRB4860123113.8548.1312258373.7227
182Clarence Davis1971--1978raiRB7375935114.6348.1251666253.7725
183Michael Pittman1998--2008crd-tam-denRB6978233154.24488166524993.7630.9
184Tom Woodeshick1963--1972phi-crdRB3134614834.2947.85045619224.2138.4
185Tyrone Wheatley1995--2004nyg-raiRB6781831853.8947.56149218783.8230.8
186Charley Tolar1960--1966otiFB4657621733.7747.24235411833.3428.2
187Frank Pollard1980--1988pitRB5255124484.4447.15044717723.9635.4
188Lorenzo White1988--1995oti-cleRB5461225384.15475952619683.7433.4
189Ron Dayne2000--2007nyg-den-htxRB5469325373.66474232012713.9730.3
190Walter Abercrombie1982--1988pit-phiRB4551621134.09474236914233.8633.9
191Harvey Williams1991--1998kan-raiRB5363224873.9446.95541115283.7227.8
192Don Calhoun1974--1981buf-nweRB5557725324.39463928810443.6326.8
193Greg Hill1994--1999kan-ram-detRB5357924394.2146281967954.0628.4
194Roland Harper1975--1982chiRB3439815543.945.74036415014.1237.5
195Rob Carpenter1977--1986oti-nyg-ramRB7690434493.8245.44835412463.5226
196Dexter Bussey1974--1984detRB5757825714.4545.17662825514.0633.6
197Wray Carlton1960--1967bufHB-FB4347219354.1453833814024.1536.9
198John David Crow1960--1968crd-sfoHB-TE5253923244.3144.74535514254.0131.7
199Mike Alstott1996--2006tamRB89100239483.9444.47946914813.1618.7
200Dalton Hilliard1986--1993norRB6576228643.7644.14438313643.5631
201Joe Washington1977--1985sdg-clt-was-atlRB6467228194.19446254220763.8333.5
202Wilbur Jackson1974--1982sfo-wasRB3637115744.2443.76060823053.7938.4
203Nick Pietrosante1960--1967det-cleFB5052021854.243.73630612414.0634.5
204Mario Bates1994--2000nor-crd-detRB3844016443.7443.35341614393.4627.2
205Les Josephson1964--1974ramRB5855225014.5343.1352006283.1417.9
206Reggie Bush2006--2011nor-miaRB4542919384.5243.13634914384.1239.9
207Rocky Bleier1968--1980pitRB8586136024.1842.4362077403.5720.6
208Chris Brown2003--2009oti-htxRB3230213524.4842.33844217814.0346.9
209James R. Jones1983--1992det-seaFB-TE3742915553.62427557520243.5227
210Charlie H. Smith1968--1975rai-sdgRB6672127513.8241.7221737154.1332.5
211Don Woods1974--1980sdg-sfoRB2933812053.5741.64042518824.4347.1
212Wayne Morris1976--1984crd-sdgRB4749619513.9341.56439914323.5922.4
213LaMont Jordan2001--2009nyj-rai-nwe-denRB5346721804.6741.16046917703.7729.5
214Ernie Green1962--1968cleHB-FB6455626214.7141271346544.8824.2
215Doug Kotar1974--1981nygRB3132412533.8740.45857621273.6936.7
216Dorsey Levens1994--2004gnb-phi-nygRB104102841824.0740.24838014753.8830.7
217Charles White1980--1988cle-ramRB5148720394.19405130310683.5220.9
218Craig Heyward1988--1998nor-chi-atl-ram-cltRB7164728374.38407240715183.7321.1
219Reuben Droughns2001--2008det-den-cle-nygRB5047819934.1739.94745916383.5734.9
220Johnny Hector1983--1992nyjRB5856923064.0539.86348920074.131.9
221Harold Green1990--1998cin-ram-atlRB4744218664.2239.77872025543.5532.7
222Amos Marsh1961--1967dal-detHB-FB3126412224.6339.45241216554.0231.8
223Dave Osborn1965--1976min-gnbRB8288632323.6539.44735213123.7327.9
224Cid Edwards1968--1975crd-sdg-chiRB2923511434.8639.4494181670434.1
225Tom Matte1961--1972cltRB9494237003.9339.44329811473.8526.7
226John L. Williams1986--1995sea-pitFB8173931724.2939.27553119393.6525.9
227Ladell Betts2002--2010was-norRB5248120164.1938.86035613553.8122.6
228Walt Garrison1966--1974dalRB8777733194.2738.1372369754.1326.4
229Michael Bennett2001--2010min-kan-tam-sdg-raiRB4742417884.22386044020084.5633.5
230Wendell Hayes1963--1974dal-den-kanRB625872349437.95840114453.624.9
231Willie Ellison1967--1974ram-kanRB5549020624.2137.52624810164.139.1
232Essex Johnson1968--1976cin-tamRB4839917894.4837.36532914614.4422.5
233Jim Kiick1968--1977mia-denRB8079129723.7637.23431310563.3731.1
234Stump Mitchell1981--1989crdRB5143918904.3137.16451425735.0140.2
235John Fuqua1969--1976nyg-pitRB5752421014.0136.93723910874.5529.4
236Robert Newhouse1972--1983dalRB115103042374.1136.84230411983.9428.5
237Curtis McClinton1962--1968kanFB-TE5851721344.1336.8322429784.0430.6
238Leroy Hoard1990--1999cle-rav-car-minRB7667727964.1336.87039213973.5620
239Merril Hoge1987--1994pit-chiRB5650520274.0136.25435913593.7925.2
240Charlie Harraway1966--1973cle-wasRB6258822403.8136.1342759213.3527.1
241Larry Garron1960--1968nweHB-FB5245718774.1136.1372609193.5324.8
242Correll Buckhalter2001--2010phi-denRB6249022224.5335.8482229594.3220
243Erric Pegram1991--1997atl-pit-sdg-nygRB5856420673.6635.64132714504.4335.4
244Carl Garrett1969--1977nwe-chi-nyj-raiRB5043517524.03356460424784.138.7
245Rickey Young1975--1983sdg-minRB5852820323.85357347216053.422
246Greg Pruitt1973--1984cle-raiRB8861430785.01357157725174.3635.5
247Darrin Nelson1982--1992min-sdgRB7358325454.3734.97648320674.2827.2
248Lenny Moore1960--1967cltRB-WR5846720114.3134.7332479863.9929.9
249Donny Anderson1966--1974gnb-crdRB6859423493.9534.55758922563.8339.6
250Kenneth Davis1986--1994gnb-bufRB7760326564.434.55433313714.1225.4
251Tommy Mason1961--1971min-ram-wasRB6154421023.8634.55542418554.3833.7
252Chester Taylor2002--2011rav-min-chi-crdRB8672629534.0734.37047019324.1127.6
253Tony Nathan1979--1987miaRB8963630474.7934.2452149504.4421.1
254Dominic Rhodes2001--2010clt-raiRB7057823874.1334.14033413063.9132.7
255Timmy Brown1960--1968phi-cltRB5139017244.4233.85346320054.3337.8
256Dick Hoak1961--1970pitRB-WR4341314203.44337963823073.6229.2
257Bill Mathis1960--1969nyjFB-HB6661521643.5232.86041713803.3123
258Earl Gros1962--1970gnb-phi-pit-norFB4434814414.1432.85245516733.6832.2
259Bill Brown1961--1974chi-minRB9689331383.5132.77770924613.4732
260Anthony Johnson1990--2000clt-nyj-chi-car-jaxRB5348217123.5532.37437113893.7418.8
261Jess Phillips1968--1977cin-nor-rai-nweRB6244419804.4631.96145116013.5526.2
262Terry Kirby1993--2002mia-sfo-cle-raiRB6853821564.0131.75130510193.3420
263Ronnie Bull1962--1971chi-phiRB6052018963.6531.64932712483.8225.5
264Norm Bulaich1970--1979clt-phi-miaRB7255222754.1231.64630011953.9826
265John Cappelletti1974--1983ram-sdgRB7767624103.5731.3341836243.4118.4
266Sammy Morris2000--2011buf-mia-nwe-dalRB6544319894.4930.66529410733.6516.5
267Pete Banaszak1966--1978raiRB11386734533.9830.6401856373.4415.9
268Cullen Bryant1973--1987ram-seaRB9571827463.8228.9522449653.9518.6
269Maurice Morris2002--2011sea-detRB7653521694.0528.57637416004.2821.1
270Randall Cunningham1985--2001phi-min-dal-ravQB9848627015.5627.67333424757.4133.9
271Tony Galbreath1976--1987nor-min-nygRB7950421244.2126.99054420213.7222.5
272Matt Suhey1980--1989chiRB8460222573.7526.9592698453.1414.3
273Kordell Stewart1995--2005pit-chi-ravQB7641019924.8626.25420411645.7121.6
274Steve Young1985--1999tam-sfoQB12555032365.8825.96026815975.9626.6
275Steve McNair1995--2007oti-ravQB10047924885.1924.97224514575.9520.2
276Donovan McNabb1999--2011phi-was-minQB10645823915.2222.67422914886.520.1
277Kevin Faulk1999--2011nweRB12565327434.221.95429912894.3123.9
278Preston Pearson1968--1980clt-pit-dalRB11860723803.9220.25837713313.5322.9
279Keith Byars1986--1998phi-mia-nwe-nyjFB-TE11953718933.5315.97931811543.6314.6
280John Elway1983--1998denQB16359822793.81149226615535.8416.9
281Fran Tarkenton1961--1978min-nygQB13139017104.3813.111729219346.6216.5

[continue reading…]

{ 4 comments }

Adrian Peterson’s amazing, except when the Vikings win

Adrian Peterson is having an incredible season. He’s likely to hit the 2,000-yard mark on Sunday, and he’s also chasing Eric Dickerson’s single-season rushing record. But his splits this year are…interesting.

The table below shows Adrian Peterson’s game logs. These display his traditional statistics, along with his Win Probability added, Expected Points Added, and Success Rate, all courtesy of Advanced NFL Stats; finally I have added the Vikings SRS score for that particularly game (on the season, Minnesota has an SRS of +3.0).

G#OppW/LScoreRshYdsYPCTDRecYdsWPAEPASR(%)SRS
1JAXW26-2317844.9230.172.550-12.2
2INDL20-2316603.8020-0.02-2.240-5.7
3SFOW24-1325863.4021-0.1-2.433.318.3
4DETW20-13211024.90200.051.8407.5
5TENW30-717885.2015-0.12-1.533.39.3
6WASL26-3817794.6050-0.061.642.3-5.9
7ARIW21-14231536.7160.120.433.30.8
8TAML17-36151238.214-0.070.743.8-22.9
9SEAL20-301718210.72110.379.552.45.7
10DETW34-24271716.3150.04-0.7254.5
11CHIL10-28181086030-0.030.860-7.8
12GNBL14-2321210101100.4210.443.51.5
13CHIW21-143115452160.242.345.511.2
14STLW36-22242128.8100.216.945.816.8
15HOUW23-625863.404-0.1-525.924.5
Total31418986112151.1225.140.23

A robot and a vegan walk into a bar...

A robot and a vegan walk into a bar...

Peterson has only had two games this season where he averaged fewer than 3.5 yards per carry. Those two games were, without question, the two most impressive wins of the year for the Vikings. Peterson had identical stat lines of 25 carries/86 yards/0 touchdowns in shocking upsets over the 49ers and Texans.
[continue reading…]

{ 2 comments }

Week 16 Power Rankings

What’s the point of power rankings now that there is just one week left in the regular season? If you’ve asked that question, you are implicitly saying that power rankings serve a purpose earlier in the year! If you want to see the playoff picture, I laid that out earlier this week, so I’ll assume you’ll be staying on this post for the snark.

I was on the Seahawks’ bandwagon a couple of weeks earlier than most, but they’re now #1 in Football Outsiders’ DVOA ratings and third in Advanced NFL Stats’ Efficiency Rankings. Seattle is also first in Pro-Football-Reference.com’s SRS Ratings; the Seahawks are second in the NFL in points differential, behind the Patriots, but a much tougher schedule was enough to close the gap there. Now that Richard Sherman is cleared to play in the postseason, Seattle is a legitimate Super Bowl contender. They may not have home field advantage in the playoffs, but they do have my Coach of the Year.

Here’s the week 17 schedule along with my projected winner:

Road Team Home TeamTimeProj Winner
Tampa Bay Buccaneers@Atlanta Falcons1:00 PMAtlanta Falcons
New York Jets@Buffalo Bills1:00 PMBuffalo Bills
Baltimore Ravens@Cincinnati Bengals1:00 PMCincinnati Bengals
Houston Texans@Indianapolis Colts1:00 PMHouston Texans
Chicago Bears@Detroit Lions1:00 PMChicago Bears
Green Bay Packers@Minnesota Vikings1:00 PMGreen Bay Packers
Carolina Panthers@New Orleans Saints1:00 PMCarolina Panthers
Philadelphia Eagles@New York Giants1:00 PMNew York Giants
Jacksonville Jaguars@Tennessee Titans1:00 PMTennessee Titans
Cleveland Browns@Pittsburgh Steelers1:00 PMPittsburgh Steelers
Miami Dolphins@New England Patriots4:25 PMNew England Patriots
Kansas City Chiefs@Denver Broncos4:25 PMDenver Broncos
Oakland Raiders@San Diego Chargers4:25 PMSan Diego Chargers
St. Louis Rams@Seattle Seahawks4:25 PMSeattle Seahawks
Arizona Cardinals@San Francisco 49ers4:25 PMSan Francisco 49ers
Dallas Cowboys@Washington Redskins8:20 PMWashington Redskins

That leaves us with the final week 17 standings:

TeamRecWinsPrvWinDiffRemSOSRemHGComment
Atlanta Falcons13-2141300.5001Mike Smith says the Falcons will play to win this game. I believe him.
Houston Texans12-3131410.6250The best season in Texans history will be secure with a win in Indianapolis in week 17.
Denver Broncos12-3131300.1251The best team in the AFC? With a win at home against Kansas City, the Broncos will finish the year on an 11-game win streak.
New England Patriots11-41212-10.4381A home win against the Dolphins will mark just the second time Bill Belichick's Patriots have gone undefeated in the division.
Green Bay Packers11-4121210.5000Winning in Minnesota is going to be difficult, but the Packers need a win to secure a much-needed bye.
San Francisco 49ers10-4-111.511.510.3131The 49ers can salvage a strong season by winning at home against Arizona; a loss and the team is in a full-fledged free fall.
Seattle Seahawks10-5111100.4061A Super Bowl championship? The coach of the year? The rookie of the year? Seattle might end up with all three in a couple of months.
Chicago Bears9-6101000.2500The Bears rooting for the Packers is one of the weirder twists of week 17.
Indianapolis Colts10-5101000.8751A magnificent season in Indianapolis is capped by the return of Chuck Pagano this weekend.
Baltimore Ravens10-5109-10.5630The Ravens plugged the leak against the Giants, but week 17 against the Bengals will be more like a pre-season game.
Washington Redskins9-610900.6251The Redskins entered the year with the least hype in the NFC East; they may end the year with the division crown.
Cincinnati Bengals9-610910.5631In a meaningless game, I'll take the home team. A.J. Green and Geno Atkins will give the Patriots trouble in round 1.
New York Giants8-791000.2501The only team the last three years to start 6-2 and miss the playoffs? The 2010 Giants. The 2012 Giants may soon join them.
Minnesota Vikings9-69810.7501I doubt they can do it, but if they beat the Packers and Texans in back-to-back weeks, they will have earned their playoff berth.
Dallas Cowboys8-781010.5630Tony Romo is closing in on 5,000 yards, Jason Witten set the single-season record for catches by a tight end, DeMarcus Ware and Anthony Spencer have double digit sacks, and the Cowboys still need to win in Washington to make the playoffs.
Pittsburgh Steelers7-88900.3131It's 2006 and 2009 all over again for the Steelers. Another playoff absence that leaves more questions than answers for Pittsburgh.
St. Louis Rams7-7-17.56.5-10.6880Sam Bradford and the passing game haven't improved significantly, but the defense is above-average. Add some weapons and this team can compete in 2013.
Miami Dolphins7-87700.7500Cameron Wake is having the best season by a player you don't hear about.
Carolina Panthers6-97710.3750Cam Newton ranks 1st in yards per completion, 2nd in Y/A, 6th in NY/A, and 10th in NY/A this year. He's also added over 700 rushing yards.
San Diego Chargers6-976-10.2501In sixteen seasons as head coach, Norv Turner has made the playoffs just four times.
New Orleans Saints7-87600.4381The Saints have allowed the most yards of any team through 15 games in NFL history; they're only 282 yards allowed from the record.
Tampa Bay Buccaneers6-96810.8130Can the Bucs end the season first in rushing yards allowed and last in passing yards allowed?
New York Jets6-967-10.3750Just. End. The. Season.
Buffalo Bills5-106600.4381C.J. Spiller is closing in on the highest YPC average of any player with 1200 yards in league history.
Tennessee Titans5-106610.1251Chris Johnson joined Eddie George and Earl Campbell as just the 7th running back with 6800 rushing yards in his first five seasons.
Cleveland Browns5-1055-10.5630It's been a typical rookie season for Brandon Weeden, which just looks bad in 2012. A difficult decision faces Cleveland management in the offseason.
Arizona Cardinals5-105510.7190From Kevin Kolb to John Skelton to Ryan Lindley to Brian Hoyer. In case you didn't figure it out, it's been a rough year in the desert.
Detroit Lions4-1144-10.6251Calvin Johnson goes for 2,000 yards and Matt Stafford goes for 700 pass attempts as the Lions try to knock the Bears out of the playoffs.
Philadelphia Eagles4-1144-10.6250The Andy Reid era is going to go out with a whimper, with the Eagles losing 11 of their final 12 games.
Oakland Raiders4-114400.3750Terrelle Pryor or Matt Leinart? This is what the Raiders-Chargers rivalry has come to.
Jacksonville Jaguars2-1322-10.3750It's been a rough season in Jacksonville, but the Jaguars did put a scare into the Patriots on Sunday.
Kansas City Chiefs2-1322-10.8130The Chiefs are one loss away from securing the #1 pick. I think Peyton Manning will make sure of that.
{ 2 comments }

Seattle’s HFA

As usual, Aaron Schatz provided some interesting information in his weekly DVOA recap. He was looking into Seattle’s home/road splits, and found that the data support what you already know:

[W]hen you look closer at home-field advantage over a period of several years, almost every team generally has the same home-field advantage, which in DVOA works out to about 8.5% on offense and 8.5% on defense. Teams will see their home-field advantage bounce up and down if you only look at things in eight-game periods that coincide with specific seasons, but if you put together six or seven years of data you are going to end up close to 8.5% difference most of the time. The biggest exception seems to be the four NFC West teams, which over the last decade have enjoyed the four largest home-field advantages in the league. And of those four teams, the biggest exception by far is Seattle.

I don’t doubt that Seattle is a much better team at home than on the road. But here’s the question on my mind today: is Seattle much better at home because, well, they’re much better at home…. or because they simply get more favorable home games than the average team? That might sound like the same thing, but Jason Lisk has done a bunch of research on home field advantage as it relates to climate and distance between the teams.

The table below shows the distance each team has traveled this season. The “road” column represents how many miles the team has traveled when they were the road team while the “home” column shows how many miles their opponents had to travel. Note that I excluded the Patriots/Rams game in London, but instead pro-rated their half-seasons to eight games.

Teamroadhome
San Francisco 49ers2202423317
Oakland Raiders2317722505
Seattle Seahawks2305921130
San Diego Chargers2075520135
Arizona Cardinals1905819569
Miami Dolphins1798118038
New England Patriots1231117764
New York Jets1084617280
Carolina Panthers906714109
Denver Broncos1493313480
St. Louis Rams1298013248
Dallas Cowboys1482613057
Houston Texans1316812705
New Orleans Saints1153912592
average1255812562
Atlanta Falcons876312016
Minnesota Vikings886511633
Tampa Bay Buccaneers1376611493
Buffalo Bills1284511336
Kansas City Chiefs1198710982
Green Bay Packers801310776
Baltimore Ravens891610642
Cincinnati Bengals780110270
Jacksonville Jaguars126079948
Detroit Lions106158659
New York Giants98988416
Chicago Bears99067167
Tennessee Titans94817141
Indianapolis Colts66087090
Pittsburgh Steelers96426792
Cleveland Browns91986784
Washington Redskins72306022
Philadelphia Eagles99925878

Seattle is the most isolated team in the NFL. Now if an expansion team was place in Vancouver or Portland, my guess is that such a team would fare no worse against Seattle than the Giants do against the Eagles or the Jets against the Patriots. But right now, no one is all that close to the Seahawks:

NFL Map

There are also climate issues at play here. Think of the coldest NFL cities — Green Bay, Chicago, Pittsburgh, Cleveland, Buffalo, New England, Denver, Kansas City. They all play in divisions with other cold-weather teams. Meanwhile, the Seahawks are playing teams from California, Arizona, or Missouri in their division. The climates are significantly different. Climate effects are very real but also very complicated, so that’s best left for another day.
[continue reading…]

{ 13 comments }

Who should win Coach of the Year in the NFL?

Let’s get this out of the way. Bruce Arians, or an Arians/Pagano ballot, is going to win Coach of the Year. Period. But who should win it?

Coach of the Year is one of the most difficult awards to predict each year. The award often goes to the coach who most outperforms expectations rather than the coach who does the best coaching job, which is how you end up in situations where Dick Jauron and Jim Haslett were named the best coaches in 2001 and 2000, respectively.

There are no standards or guidelines to help voters determine the Coach of the Year, so every voter is left to his own devices. Today, I’m going to run down my rankings of the top 8 coaches of 2012.

8. John Fox, Denver Broncos

Having Peyton Manning makes coaching easy, but Fox still deserves credit for guiding the Broncos to an excellent season. Denver is going to finish the year on an 11-game winning streak and the Broncos are in the top five in points allowed, yards allowed, net yards per attempt allowed, rushing yards allowed, rushing touchdowns allowed, and rushing yards per carry allowed. Fox has helped turn Von Miller into one of the best two defensive players in the NFL and his hiring of Jack Del Rio to coach the defense has worked beautifully. And while Manning is having a phenomenal year, let’s not forget that it was only three months ago that people were questioning his arm strength and the Broncos were 2-3. Many coaches are doing wonderfully with less, but Fox deserves credit for helping lead Denver to the 2 seed in the AFC.

7. Gary Kubiak, Houston Texans

Gary Kubiak

Gary Kubiak wishes COTY voting took place after the end of November.

It was only three weeks ago that the Texans were 11-1 and the class of the NFL. I wrote earlier this season that Kubiak’s done an excellent job resurrecting his coaching career, and much of that remains true. He’s built this team for half a decade, and he oversaw the additions of J.J. Watt and Wade Phillips to the defense to complement Kubiak’s formidable offense. The Texans are likely going to earn the top seed in the A.F.C., an impressive accomplishment considering Matt Schaub isn’t on the same tier of a Peyton Manning or Tom Brady. Even with a little luster off the team right now, Texans fans could hardly ask for more than home field advantage throughout the playoffs.

So why isn’t Kubiak ranked higher? I’m not sure the Texans are as good as their record and they’ve had a relatively easy schedule. Kubiak’s done an excellent job, but he also hasn’t had to face as much adversity as some other coaches this year. Houston is now one of the most talent-laden rosters in the league, and that makes Kubiak’s success just slightly less impressive.

6. Mike McCarthy, Green Bay Packers

The Packers are 11-4 — they’d have the same record as the Texans if not for the Golden Taint play — despite facing a more difficult schedule than Houston. As is seemingly an annual tradition, the Packers have placed a large number of starters on injured reserve, including right tackle Bryan Bulaga, linebackers Nick Perry, D.J. Smith, and Desmond Bishop, and Cedric Benson (along with two other running backs). Charles Woodson has only played in 7 games, James Starks and Alex Green have been banged up most of the year, and injuries have limited Greg Jennings to just 246 receiving yards this year.

Alex Green is the leading rusher with 464 yards, and he’s plodded to the tune of 3.4 yards per carry, narrowly trailing what Benson (3.5) and Starks (3.6) have produced. An anemic running game, a banged up offensive line, and injuries at receiver and tight end have resulted in Aaron Rodgers having a down season and having taken 46 sacks. Clay Matthews has missed four games and he still has 8.5 more sacks than anyone else on defense.

Yet after all that, the Packers are in line for the #2 seed in the NFC. McCarthy’s team is ranked 7th in both points and points allowed, and Green Bay has responded well in the face of adversity this season. After the painful loss to the Seahawks, would other coaches have been able to keep this team focused? After an emotional loss to the Chuckstrong Colts, you didn’t hear about grumbling in the locker room: instead, Green Bay won five straight games. Since a 38-10 shellacking against the Giants, where they looked lost, the Packers have won four in a row. If McCarthy isn’t a household name, that’s just because he’s the most underrated coach in the NFL. Despite facing numerous setbacks this season, he’s got the Packers right where everyone expected they would be.

[continue reading…]

{ 24 comments }

NYT Fifth Down: Post-week 16

This week at the New York Times I looked at some record-breaking performances from week 16.

Sunday was a record-setting day in the N.F.L. In case you missed it …

  • The rookie Minnesota Vikings kicker Blair Walsh connected on a 56-yard field goal in the second quarter against the Texans, making him the first kicker with nine field goals of 50 yards or longer in a season. Even more impressive: Walsh is 9 of 9 from 50-plus yards this year.
  • Kansas City rushed for 352 yards against the Colts, easily breaking the record for rushing yards gained in a losing effort and also for rushing yards differential in a loss. How do you lose when you rush for so many yards? Brady Quinn threw an interception that was returned for a touchdown and threw another pick in the Colts’ end zone. Another Chiefs drive ended on a fumble inside the Colts’ 20-yard-line. But the turning point of the game may have been when Quinn was stuffed on a fourth-and-1, one of the few times in the game that the Colts’ run defense won the battle at the line of scrimmage.
  • In the same game, Jamaal Charles recorded the 750th carry of his career, giving him enough rushing attempts to be eligible for the career yards-per-carry title. Jim Brown averaged 5.22 yards per carry during his Browns career. That’s now second highest among running backs in N.F.L. history. Charles has a mind-boggling 5.82 average gain over his five-year career.
  • Brown might take a back seat to another running back this season. Buffalo’s C.J. Spiller has averaged 6.48 yards per carry this year on 183 carries, the highest single-season average of any player with that many carries. The previous record holder was Brown, who averaged 6.40 yards per rush in 1963.
  • It’s been another remarkable season for Atlanta’s Tony Gonzalez, but he actually was nudged out of the record books this weekend. In 2004, Gonzalez set the single-season record for receptions by a tight end with 102, but Dallas’s Jason Witten caught his 103rd pass of the season in overtime against the Saints on Sunday.
  • The Seattle Seahawks have outscored their last three opponents, 150-30. That 120-point margin of victory is the largest differential in a three-game span in 70 years. In 1942, the Chicago Bears won three straight games and did it with a combined 127-7 score; the year before, Chicago outscored its opponents, 136-14, over a three-game stretch.

Mega Record for Megatron

Of course, the most noteworthy individual record to fall this past weekend was Jerry Rice’s single-season receiving record of 1,848 yards. Calvin Johnson needed only 15 games to break the record Saturday night, and with 1,892 yards, he has a good chance of becoming the first N.F.L. receiver to hit the 2,000-yard mark.

With 225 yards against the Falcons, he also became the first player to gain 100 receiving yards in eight straight games and to collect 10 receptions in four straight games. For Johnson, it was his fifth career game (including the postseason) with at least 200 receiving yards, tying him with Lance Alworth and Rice for the most 200-yard games since 1960.

Detroit has averaged 47 pass attempts per game, and will set the single-season record for attempts on its 12th pass attempt Sunday. Most of those passes have come from the right arm of Matthew Stafford, who threw 663 passes in 2011, (now) the fourth-highest number ever. On his seventh pass in Week 17 against the Bears, he’ll set the record, and he needs just 15 passes to become the first quarterback with 700 pass attempts in a season.

You can check out the full post here.

{ 1 comment }

Merry Christmas

The North Pole is that way, dude

The North Pole is that way, dude.

Merry Christmas from Football Perspective! Most people know that Jay Cutler is from Santa Claus, Indiana, but did you know that that Arizona offensive lineman Daryn Colledge is from the North Pole? Well, at least from the one in Alaska.

Former Oregon State lineman Johan Asiata had a cup of coffee with the Bears two years ago, and he’s one of two players in NFL history from Christchurch, New Zealand (Riki Ellison is the other). Wes Ours was from Christian, Kentucky and Wayne McClure was from Merryvile, Tennesssee, while Kyle Rudolph is one of seven players with that last name in league history.

On a more relevant note, today is the 41st anniversary of one of the best games in NFL history. On December 25th, 1971, the Miami Dolphins defeated the defending Kansas City Chiefs in double overtime. The win prevented Len Dawson from going for his 2nd Super Bowl title in three years and helped Don Shula reach the first of three consecutive Super Bowls.

Hopefully you are celebrating the day with your loved ones today. Thanks for being a part of Football Perspective. I’ll close with this list, courtesy of PFR: There are also 63 players in NFL history born our Christmas day, including a Hall of Famer and one of the best quarterbacks not currently in Canton.

Happy Holidays!

Passing Rushing Receiving
Rk Pos Born From To AP1 PB St AV G Cmp Att Yds TD Lng Int Sk Yds Att Yds TD Lng Rec Yds TD Lng
1 Ken Stabler QB 1945 1970 1984 1 4 11 94 184 2270 3793 27938 194 88 222 281 2514 118 93 4 18
2 Larry Csonka RB 1946 1968 1979 2 5 11 73 146 1891 8081 64 54 106 820 4 65
3 William Andrews RB 1955 1979 1986 0 4 5 68 87 0 1 0 0 0 0 1 2 1315 5986 30 33 277 2647 11 86
4 Hanford Dixon DB 1958 1981 1989 2 3 9 68 131
5 Roland Lakes DT-DE-T-DT 1939 1961 1971 0 0 10 58 154
6 Dave Parks SE-TE-WR 1941 1964 1973 1 3 9 51 118 0 1 0 0 0 0 0 0 4 -10 0 10 360 5619 44 83
7 Norm Bulaich RB 1946 1970 1979 0 1 5 50 120 814 3362 30 67 224 1766 11 80
8 Marcus Trufant DB 1980 2003 2012 0 1 8 50 135
9 Chris Naeole G 1974 1997 2007 0 0 9 48 154
10 Dick Barwegan G 1921 1947 1954 4 4 7 37 92
11 Howard Twilley WR-FL 1943 1966 1976 0 0 5 36 120 212 3064 23 44
12 Corey Widmer LB-DT 1968 1992 1999 0 0 4 33 114
13 Shawn Andrews G-T 1982 2004 2010 1 2 3 28 63
14 Harry Jagielski DT-T 1931 1956 1961 0 0 2 27 36
15 Chris Fletcher DB 1948 1970 1976 0 0 4 26 76
16 Pete Jaquess DB 1940 1964 1970 0 1 3 26 85
17 Roy Hord G 1934 1960 1963 0 0 3 24 53
18 Jeff Rohrer LB 1958 1982 1987 0 0 3 22 83
19 Bob Scholtz C-G-T 1937 1960 1966 0 0 3 21 81
20 Rod Sherman WR-FL 1944 1967 1973 0 0 4 18 83 4 20 1 13 105 1576 5 55
21 Torrin Tucker T-G 1979 2003 2005 0 0 2 11 36
22 Tom Drougas T-G 1949 1972 1976 0 0 1 10 65
23 Craig Veasey DT 1966 1990 1995 0 0 0 8 69
24 Demaryius Thomas WR 1987 2010 2012 0 0 1 6 35 0 1 0 0 0 0 0 0 3 6 0 5 132 2044 14 71
25 Marlon Forbes DB 1971 1996 1999 0 0 0 5 63
26 Reggie Rembert WR 1966 1991 1993 0 0 0 5 28 36 437 1 27
27 Gordon Bell RB 1953 1976 1978 0 0 0 4 30 90 319 2 26 32 259 0 20
28 Kerlin Blaise G 1974 1999 2003 0 0 0 4 38
29 Robbie Jones LB 1959 1984 1987 0 0 0 4 60
30 Hank Rivera DB 1938 1962 1963 0 0 0 3 12
31 Stuart Anderson LB 1959 1982 1985 0 0 0 2 40
32 Bill Briggs DE 1943 1966 1967 0 0 0 2 23
33 Trevor Insley WR 1977 2001 2001 0 0 0 2 11 14 165 1 26
34 Greg L. Robinson T 1962 1986 1987 0 0 0 2 6
35 Josh Baker TE 1986 2011 2011 0 0 0 1 11 3 27 1 17
36 Patrick Brown T 1986 2011 2012 0 0 0 1 16
37 Scott Curry T 1975 1999 1999 0 0 0 1 5
38 Buck McPhail FB-K 1929 1953 1953 0 0 0 1 12 53 138 0 30 10 38 0 45
39 Limas Sweed WR 1984 2008 2009 0 0 0 1 20 7 69 0 17
40 Thomas Williams LB 1984 2008 2011 0 0 0 1 15
41 Nate Abrams E 1897 1921 1921 0 0 2 0 1
42 Ermal Allen QB-DB 1918 1947 1947 0 0 0 0 12 4 13 88 0 0 0 7 11 0 0
43 Napoleon Barrel C 1885 1923 1923 0 0 2 0 7
44 Norm Barry BB-HB 1897 1921 1922 0 0 3 0 12
45 John Barsha FB 1898 1920 1920 0 0 0 0 3
46 Milt Crain FB 1921 1944 1944 0 0 0 0 10 26 78 0 8 1 16 0 16
47 Lon Evans G-T 1911 1933 1937 2 0 4 0 57
48 Harry Flaherty LB 1961 1987 1987 0 0 0 0 2
49 Dick Hanson T 1949 1971 1971 0 0 0 0 3
50 Mike Hudson DB 1963 1987 1987 0 0 0 0 3
51 Julie Koshlap B 1917 1945 1945 0 0 0 0 1
52 Mel Maceau C 1921 1946 1948 0 0 0 0 37
53 Joe Majors DB 1936 1960 1960 0 0 0 0 1
54 Joe Mickles RB 1965 1989 1990 0 0 0 0 10
55 Gery Palmer T 1950 1975 1975 0 0 0 0 2
56 Leon Pennington LB 1963 1987 1987 0 0 0 0 3
57 Hosea Rodgers FB 1921 1949 1949 0 0 1 0 12 0 1 0 0 0 0 131 494 5 0 7 97 0 0
58 Jim Sanford T 1898 1924 1924 0 0 0 0 1
59 Don Silvestri K 1968 1995 1996 0 0 0 0 28
60 Marty Slovak TB-DB 1916 1939 1941 0 0 0 0 27 57 109 638 4 48 18 141 396 1 14
61 John Starnes P 1962 1987 1987 0 0 0 0 1
62 Frank Walton G 1911 1934 1945 0 0 1 0 25
63 Bill Wexler C 1904 1930 1930 0 0 0 0 1
{ 1 comment }

Playoff Picture: Who needs what in week 17

With week 16 in the books, it’s time to take a look at the playoff picture. In the AFC, it’s simple: we know the six teams that will be in the post-season. In the NFC, there are two spots still remaining and five teams trying to claim them. In both conferences, there will be battles for byes in week 17.

AFC

The 12-3 Houston Texans are suddenly in a freefall, and could drop from the presumptive number one seed to having to win in the first round of the playoffs. If Houston loses in Indianapolis, the Texans are vulnerable to being caught by either Denver (home against Kansas City) or New England (home against Miami), or both. There’s likely no middle ground, since the Broncos and Patriots are big favorites, meaning it’s the #1 seed or no bye for Houston. Still, Houston is likely to get the top seed in the AFC. After all, the Colts did just struggle mightily to handle the worst team in the NFL.

Denver can secure a bye by beating Kansas City or having the Dolphins beat the Patriots, and would earn home field advantage throughout the playoffs with a win and a Colts victory. The likely result for Denver is the #2 seed

The Patriots are third in the pecking order with four losses. They could drop to the #4 seed with a loss and a Ravens victory over Cincinnati, but that doesn’t mean much: a home game against Indianapolis won’t scare New England and might even be an easier matchup than facing A.J. Green and Geno Atkins. The real drama is whether Denver or Houston falls, giving New England a chance for a bye or even home field. While the Patriots could end up being slotted from 1 to 4 in the AFC, expect each of the top three seeds to take care of business, and New England to finish as the #3 seed.

Pagano will likely see his old friends in two weeks

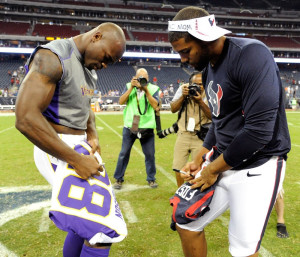
Pagano as defensive coordinator of the Ravens.

Because the Browns defeated the Bengals, the Ravens hold the tiebreaker over Cincinnati. Both teams split with Pittsburgh, and would split with each other if Cincinnati defeats Baltimore on Sunday, but Baltimore’s sweep of Cleveland would give them the division even if they lose to Cincinnati in week 17. Baltimore has little to play for in Cincinnati; the irony is that if Baltimore defeats the Bengals and the Patriots lose, the two teams would face off again in the first round of the playoffs in Baltimore. Still, the likely scenario is Baltimore staying at the 4 seed and hosting the Colts in the first round of the playoffs.

The Colts are the feel good story of the year, and Chuck Pagano comes back to coach the team this weekend. It’s actually a meaningless game for Andrew Luck and the Colts on Sunday, as they can’t improve their playoff positioning. In fact, they can only hurt it: a victory over Houston in week 17 means, assuming the Patriots defeat the Bengals in the first round of the playoffs, that the Colts would face the Broncos instead of the Texans in the second round. In any event, we know that the Colts are the 5 seed and unless the Patriots lose and the Ravens win, will travel to their old stomping grounds in Baltimore in the first round of the playoffs. Expect that to be a very emotional game and for the Ravens crowd to give a warm #Chuckstrong welcome to their former defensive coordinator.

NFC

Matt Ryan and the Falcons have clinched the #1 seed in the NFC. For all the bashing Atlanta seems to take, they might end up winning three more games than any other team in the conference. However, the most likely opponent in the first round of the playoffs is Seattle, which would be a fascinating contrast in styles. The Falcons will face the winner of the 4/5 game or the 6 seed, but since the 6 seed will likely play in San Francisco, and the Seahawks look much better than either the Redskins or the Cowboys, my money is on Seattle-Atlanta in round two.

Brett Favre is honestly surprised the Packers haven't secured a bye yet.

Brett Favre is honestly surprised the Packers haven't secured a bye yet.

Green Bay is the frontrunner to win the #2 seed and secure the other bye in the conference. The NFC East winner is out, so the #2 seed comes down to either the Packers or the NFC West winner. Green Bay gets the #2 spot with a win, or with losses by both the Seahawks and 49ers. I wouldn’t count on that. Winning in Minnesota is not going to be easy — Adrian Peterson will be chasing Eric Dickerson’s rushing record and the Vikings are in a “win and you’re in” scenario themselves — but I’d still make Aaron Rodgers and the Packers the favorites. If the Packers lose in Minnesota, their punishment is a first round visit from the Vikings.

San Francisco can still finish as the #2, #3, or #5 seeds. The 49ers get a bye if the Packers lose and the 49ers win, but more likely, San Francisco defeats Arizona and ends up as the #3 seed in the NFC. The 49ers could also get the #3 seed with a loss if the Seahawks lose at home against the Rams, but good luck with that. If San Francisco loses at home to Arizona, the 49ers will likely get what they deserve — the fifth seed and a trip to either Washington or Dallas in the first round of the playoffs.

The NFC East will be decided in Washington on Sunday. If the Redskins win, which would be my prediction, Washington will win the division at 10-6. The ‘Skins have another out, as they could get the 6 seed even if they lose to the Cowboys. At 9-7, Washington would have the tiebreaker over Minnesota based on head-to-head record, so if the Vikings and Bears lose to Green Bay and Detroit, Washington is in the playoffs. Assuming the Redskins make the post-season, Luck would be joined by fellow rookies Robert Griffin III and Russell Wilson in the playoffs, an NFL first.

TO taught Sherman what to do when you arrive at the Cowboys 50-yard line.

TO taught Sherman what to do when you arrive at the Cowboys 50-yard line.

Meanwhile, the Cowboys face your basic ‘win and you’re in’ scenario. At 8-8 they can’t make the playoffs, so it’s just a question of whether they can defeat the Redskins and claim the NFC East. The other interesting thing to keep an eye on: Tony Romo is only 315 yards away from hitting the 5,000-yard mark, although he trails both Drew Brees and Matthew Stafford in the race for the passing crown.

By defeating San Francisco on Sunday night, the Seahawks clinched the #5 seed in the NFC. While the Bears and Vikings could get to 10 wins, Seattle defeated both teams, so Seattle’s fate is secure as no worse than the 5th seed and is rewarded with a trip to either Washington or Dallas in the first round of the playoffs.

That leaves just the sixth seed up for grabs. If the Vikings defeat the Packers, they’d get the #6 seed and likely travel to Lambeau Field in the first round of the playoffs. No word on whether Brett Favre would be in attendance. Minnesota has the tiebreaker over the Bears because Green Bay swept Chicago, while in this scenario, the Vikes would end up 4-2 in the division. Chicago therefore needs Minnesota to lose and to win in Detroit to get the #6 seed. If both teams lose, the Redskins then would slot into the 6 seed even if they lose.

You might notice we’re missing a certain team from New York. Well, the Jets have struggled this season, and the Mark Sanchez/Tim Tebow/Greg McElroy circus has only gotten more depressing. Oh wait, there’s another team in New York, right? Well, the Giants can’t win the division, but could get a wildcard berth. They would need the other teams they’d be battling for the final spot — Chicago, Minnesota, and Dallas — to lose to Detroit, Green Bay, and Washington, in addition to taking care of business against the Eagles. The longshot there would be the Lions defeating Chicago, but otherwise, it’s not a completely far-fetched scenario.

{ 10 comments }

Rankings the kickers, from Tucker to Crosby

Mack Brown knows kicker.

Mack Brown knows kickers.

In the summer of 2009, I wrote a three-part series analyzing every kicker of the last half-century (here are the links to Part I, Part II, Part III). What I did there was analyzed field goal attempts by distance, and then credited a kicker for how many field goals he made over the expected number of successful field goals from each distance.

For example, field goal kickers this year have made 15 of 23 attempts from exactly 50 yards. [1]There is some bias in the data in that only the best distance kickers attempts long field goals, but dealing with that is best left for another day. If we assume that 50-yard kicks are successful 65% of the time, then a made 50-yarder will be worth +0.35 field goals and a missed 50-yarder will be worth -0.65 field goals.

To smooth the data, I used kicks from 2005 to 2011, and I also grouped field goals into four-yard increments. In the off-season, I plan to incorporate stadium, temperature, and other weather effects, but for now, I’ve ignored the (often large) role such elements can play.

The table below shows how many field goals over expectation each kicker made through week 15. I also included a column for extra points, and the final column shows how many points over average each kicker provided, giving them 3 points for each field goal and one point for each extra point over average:

RkNameTmFG MFG AFG %EXP FG MadeFG Ov AVGXP MXP AXP Ov AvgPoints Ov Avg
1Justin TuckerBAL252792.6%20.74.337370.213.1
2Sebastian JanikowskiOAK293290.6%24.74.322220.112.9
3Blair WalshMIN293290.6%25.13.930300.211.8
4Shaun SuishamPIT262796.3%22.43.630300.210.8
5Phil DawsonCLE262796.3%22.53.528280.210.6
6Kai ForbathWAS1515100%11.53.52627-0.89.6
7Dan BaileyDAL272993.1%24332320.29.3
8Jason HansonDET283287.5%25.12.934340.28.8
9Connor BarthTAM232882.1%20.52.537370.27.7
10Greg ZuerleinSTL212972.4%18.72.321210.17.1
11Jay FeelyARI212487.5%18.82.223230.16.8
12Josh ScobeeJAX222491.7%19.62.41516-0.96.2
13Matt BryantATL313686.1%29.31.738380.25.4
14Rian LindellBUF202195.2%18.31.734340.25.2
15Nick NovakSDG151788.2%13.61.427270.24.2
16Alex HeneryPHI252889.3%23.51.52223-0.93.7
17Dan CarpenterMIA222781.5%21.20.826260.12.6
18Ryan SuccopKAN252986.2%24.20.816160.12.4
19Nate KaedingSDG77100%6.20.86602.4
20Josh BrownCIN66100%5.30.75502.2
21Robbie GouldCHI212584%20.50.533330.21.8
22Steven HauschkaSEA222588%20.91.13840-1.81.4
23Mike NugentCIN192382.6%18.60.435350.21.3
24Olindo MareCHI22100%1.80.21100.5
25Graham GanoCAR55100%4.60.41314-0.90.3
26Garrett HartleyNOR151883.3%15.1-0.148480.30.1
27Lawrence TynesNYG333984.6%33.1-0.138380.2-0.2
28Stephen GostkowskiNWE263281.3%26.2-0.260600.3-0.3
29Shayne GrahamHOU263281.3%26.2-0.244440.2-0.5
30Adam VinatieriIND243177.4%24.2-0.231310.2-0.5
31Matt PraterDEN232979.3%23.8-0.846460.3-2.2
32Nick FolkNYJ172277.3%17.8-0.828280.2-2.3
33Rob BironasTEN243080%24.9-0.929290.2-2.4
34Justin MedlockCAR71070%8.3-1.323230.1-3.9
35Billy CundiffWAS71258.3%9.3-2.317170.1-6.7
36David AkersSFO253571.4%28.2-3.240400.2-9.5
37Mason CrosbyGNB172958.6%21.3-4.339390.2-12.8

So Justin Tucker and Sebastian Janikowski have been the most valuable kickers this year — no surprise there, although Tucker is far from a household name. The worst two kickers won’t shock anyone who has watched much of the Packers or 49ers this year, as David Akers and especially Mason Crosby have been constant sources of frustration for their fans.

I’ll note that I am counting blocked field goals just like a regular miss. When I previewed the list to my brother, he was surprised to see Folk ranking 32nd, since he only missed five field goals. Well, two of them were blocked; if you removed those (and blamed them on the line instead of a low trajectory), he would be 17th (although in this one, I am only removing blocks for Folk). I’d also note that two of his other 3 misses hit the uprights, so I’m not surprised to see my brother (or any Jets fan) surprised to see Folk 32nd.

What if we look at expected field goals over average by distance?

RkNameTm19to2223to2627to3031to3435to3839to4243to4647to5051to5455to5859to6263to66FG Ov Avg
1Justin TuckerBAL00.10.10.10.401.60.11.40.6004.3
2Sebastian JanikowskiOAK0.10.10.20.40.40.60.30.70.81.2-0.3-0.24.3
3Blair WalshMIN00.1-0.80.10.70-0.71.12.31.2003.9
4Shaun SuishamPIT0.100.20.40.30.80.81.1-0.10003.6
6Kai ForbathWAS00.100.2001.12.200003.5
5Phil DawsonCLE00.1-0.80.40.410.30.71.40003.5
7Dan BaileyDAL0.10.10.10.50.40.80.50.7-0.20003
8Jason HansonDET000.10.50.10.61.4-0.20.40002.9
9Connor BarthTAM000.10.1-0.60.20.51.40.40.3002.5
12Josh ScobeeJAX0.10.100.30.40.80.11.10-0.4002.4
10Greg ZuerleinSTL000.10.2-1.70.40.81.40.8-0.10.7-0.32.3
11Jay FeelyARI000.20.2-0.3-0.80.31.50.500.702.2
13Matt BryantATL-0.900.20.3-0.31-0.4-0.30.91.2001.7
14Rian LindellBUF0000.5-0.51.200.400001.7
16Alex HeneryPHI0.10.10-0.70.51.20.10.70-0.4001.5
15Nick NovakSDG0.10.100.300.20.50.7-0.1-0.4001.4
22Steven HauschkaSEA0.10.10.10.50.30.40.3-0.3-0.10-0.301.1
17Dan CarpenterMIA000.10.40.11.40.8-1.9-0.20000.8
19Nate KaedingSDG00.10000.40.3000000.8
18Ryan SuccopKAN00-0.9-0.30.3-0.80.80.70.90000.8
20Josh BrownCIN00.100.200000.50000.7
21Robbie GouldCHI0.10.10-0.70.3-0.21.1-0.90.90000.5
25Graham GanoCAR00.100.200.20000000.4
23Mike NugentCIN0.10.10.10.10.4-0.2-0.5-0.200.6000.4
24Olindo MareCHI0000.2000000000.2
26Garrett HartleyNOR0.10.100.2-0.70.20-0.30.4000-0.1
27Lawrence TynesNYG00.2-0.70.3-0.10.4-0.21.1-1.1000-0.1
28Stephen GostkowskiNWE00.10.10.4-0.5-2.21.1-0.20.9000-0.2
30Adam VinatieriIND0.10.100.1-2.30.40.81.2-0.2-0.400-0.2
29Shayne GrahamHOU0.100.20.40.41-0.2-1.6-0.6000-0.2
31Matt PraterDEN0.10.10.1-0.20.10-0.6-1.31.4-0.400-0.8
32Nick FolkNYJ0.1-0.900.3-0.60.2-0.600.8000-0.8
33Rob BironasTEN00.10.10.30.8-0.4-1.5-0.30.5-0.400-0.9
34Justin MedlockCAR0000.30-0.8-0.2-0.60000-1.3
35Billy CundiffWAS000-1.80.4-0.40.300-0.4-0.30-2.3
36David AkersSFO000.3-0.60.7-1.8-0.9-0.3-1.1-0.400.8-3.2
37Mason CrosbyGNB00.10.1-0.7-0.7-0.2-1.51.2-1.7-0.800-4.3

Greg Zuerlein — or Greg the Leg, Young GZ, or Legatron, if you prefer — has cooled off since his hot start. He’s hit 3 of the successful field goals from 56+ yards this season, but all three came in September. Mason Crosby comes out as the worst kicker, and some have defended him because he’s mostly missed long field goals. While that’s somewhat true, this metric adjusts for distance, so he’s struggling even when you consider the difficulty of the kick.

Crosby is 1 for 8 when attempting field goals from 50+ yards, but the average kicker would have been successful on 4.2 field goals. He’s also missed from 32, 38, 42, 43, and 44 yards, and comes out as the worst kicker in the 43-to-46 range. David Akers tied an NFL record with a 63-yarder this year, but otherwise, he’s had a rough season. He’s missed six field goals from inside of 43 yards.

References

References
1 There is some bias in the data in that only the best distance kickers attempts long field goals, but dealing with that is best left for another day.
{ 2 comments }

I’ve been on a major QB kick lately, and there’s no reason to stop now. Today, I want to look at a method that might tease out a quarterback’s “true talent” better than if we simply use his raw stats from the season.

Three years ago, our colleague Jason Lisk had a post on the old PFR Blog about which rate stats stay consistent when a QB changes teams. Basically, he grabbed QBs who were still in their primes and changed teams, looking at how their key rate stats correlated from one year to the next. Here’s what Jason found:

[…]I looked at the correlation coefficient for our group of 48 passers, for the year N advanced passing score compared to the year N+1 advanced passing score in each category. This should tell us whether the passers who were good in a performance area (or bad) tended to be the ones who remained good in that performance area the following season, even with the uncertainty of team changes (some positive, some negative for the quarterback).

Sack Percentage:  0.31
Completion Percentage: 0.25
Yards Per Attempt:  0.20
Touchdown Percentage: 0.12
Interception Percentage: 0.10

What do those correlations mean, exactly? Well, take sack percentage as an example. In general, a correlation of 0.31 means you can expect 31% of a QB’s difference from the mean to be repeated next year when he changes teams. In other words, you have to regress the QB’s sack rate 69% towards the mean to get the true rate that “belongs” to him. If the average sack rate is 6.1%, and a QB has a rate of 4.0% (like, say, Drew Brees this year), his “true” sack rate is probably something like 5.4% — 31% of the distance between .061 and .040.

The same concept applies to the other stats listed above. Tony Romo’s observed 66.7% completion percentage is really more like 62.5% after regressing to the mean, and so forth. Do that for every QB who had a reasonable number of attempts this year, and you get these rate stats:

PlayerTmGGSAttA-Sk%A-Cmp%A-YPAA-TD%A-INT%R-Sk%R-Cmp%R-YPAR-TD%R-INT%
Matthew StaffordDET14146294.359.56.82.72.45.560.77.04.02.6
Drew BreesNOR14145744.062.07.66.33.15.461.47.24.52.7
Tony RomoDAL14145685.366.77.53.92.85.962.57.24.22.7
Andrew LuckIND14135646.254.67.13.53.26.159.57.14.12.7
Carson PalmerOAK14145624.460.97.13.92.55.661.17.14.22.6
Tom BradyNWE14145603.963.47.65.41.15.461.77.24.42.5
Matt RyanATL14145394.468.57.85.02.65.663.07.24.32.7
Peyton ManningDEN14145113.967.97.96.12.05.462.87.24.42.6
Brandon WeedenCLE14144985.057.26.62.83.45.760.27.04.02.7
Philip RiversSDG14144888.164.36.74.53.16.762.07.04.22.7
Joe FlaccoBAL14144876.559.17.14.12.16.260.77.14.22.6
Eli ManningNYG14144873.060.47.44.13.15.161.07.14.22.7
Sam BradfordSTL14144826.860.26.83.72.36.360.97.04.22.6
Matt SchaubHOU14134764.064.77.54.62.15.562.07.24.32.6
Aaron RodgersGNB14144748.766.77.66.81.76.962.57.24.52.6
Andy DaltonCIN14144727.562.57.05.53.06.561.57.14.42.7
Josh FreemanTAM14144694.354.87.45.32.65.559.67.14.32.7
Ryan FitzpatrickBUF14134445.961.76.65.03.46.061.37.04.32.7
Christian PonderMIN14144256.663.15.93.32.86.261.66.94.12.7
Ryan TannehillMIA14144245.858.76.92.42.86.060.57.04.02.7
Cam NewtonCAR14144237.258.28.24.32.46.460.47.34.22.6
Mark SanchezNYJ14144187.354.86.43.14.16.559.66.94.12.8
Ben RoethlisbergerPIT11113985.764.17.35.51.56.061.97.14.42.6
Jay CutlerCHI13133778.559.77.04.53.76.860.87.14.22.8
Russell WilsonSEA14143536.962.97.65.92.56.361.67.24.42.7
Robert Griffin IIIWAS13133517.466.48.35.11.16.562.57.34.32.5
Michael VickPHI993167.958.56.93.52.86.660.57.04.12.7
Blaine GabbertJAX10102787.358.36.03.22.26.560.46.94.12.6
Matt CasselKAN982776.458.16.52.24.36.260.47.04.02.8
Jake LockerTEN992695.657.67.03.33.35.960.37.14.12.7
Matt HasselbeckTEN852216.062.46.23.22.36.161.56.94.12.6
Nick FolesPHI652176.559.46.22.31.86.260.76.94.02.6
Alex SmithSFO9921710.070.08.06.02.37.363.47.34.42.6
Chad HenneJAX842168.551.96.73.72.36.858.87.04.22.6
John SkeltonARI762016.954.25.61.04.56.459.46.83.82.8
Kevin KolbARI6518312.959.66.44.41.68.260.86.94.22.6
Brady QuinnKAN861599.159.75.81.33.87.060.86.83.92.8
Colin KaepernickSFO1151548.365.68.44.51.36.862.37.34.32.5
Ryan LindleyARI631416.651.14.30.04.36.358.66.53.72.8

(“A-” before a stat means the actual observed rate; “R-” means the regressed rate.)

Now we just need to reconstruct the player’s raw passing line as though he posted those rate stats instead of his actual rates. Cmp%, YPA, TD%, and INT% are easy (just multiply by attempts), and Sack% can be derived via simple algebra:

Sacks_new = (-reg_sk% * Attempts) / (reg_sk% – 1)

(Sack yards can be assumed by multiplying raw sack yards per sack by the new sack total.)

Finally, we plug the new totals into the Adjusted Net Yards Per Attempt formula, and we have a QB stat that is sort of like baseball’s Fielding Independent Pitching (FIP), which also seeks to reduce the noise and teammate interactions in a pitcher’s ERA by reducing his performance to only those elements he has control over — strikeouts, walks, and home runs.

Here are the 2012 leaders in QB-FIP (along with their regressed totals):

RkPlayerAgeTmGGSCmpAttYdsTDIntSkSkYdsQB-FIP
1Peyton Manning36DEN141432151136972313291916.22
2Tom Brady35NWE141434656040272414322146.20
3Robert Griffin III22WAS13132193512568159241666.15
4Colin Kaepernick25SFO1159615411307411766.11
5Ben Roethlisberger30PIT111124639828361710251416.11
6Matt Ryan27ATL141433953938932314322256.11
7Eli Manning31NYG141429748734762013261656.09
8Drew Brees33NOR141435257441182616332376.08
9Josh Freeman24TAM141427946933502012271816.08
10Aaron Rodgers29GNB141429647434022112351976.06
11Cam Newton23CAR141425642330861811292036.05
12Russell Wilson24SEA14142173532539169241486.05
13Alex Smith28SFO99138217157510617976.04
14Matt Schaub31HOU141329547634072012272286.01
15Tony Romo32DAL141435556840712415352555.97
16Andy Dalton25CIN141429047233362113331765.94
17Joe Flacco27BAL141429548734532013322095.93
18Carson Palmer33OAK141434356239802315332545.92
19Ryan Fitzpatrick30BUF141327244431011912291515.89
20Andrew Luck23IND141333656439902315372305.89
21Matthew Stafford24DET141438262944132517372565.88
22Jake Locker24TEN991622691900117171085.88
23Michael Vick32PHI991913162223138221245.84
24Sam Bradford25STL141429448233802013322165.82
25Brandon Weeden29CLE141430049834772014301985.80
26Ryan Tannehill24MIA141425742429871711272055.78
27Chad Henne27JAX8412721615119616945.78
28Philip Rivers31SDG141430248834222113352215.77
29Matt Cassel30KAN98167277192811818975.75
30Jay Cutler29CHI131322937726611610281875.74
31Christian Ponder24MIN141426242529121711281645.70
32Nick Foles23PHI65132217150096141025.70
33Matt Hasselbeck37TEN85136221152596141055.70
34Mark Sanchez26NYJ141424941829031712291785.68
35Blaine Gabbert23JAX10101682781907117191385.61
36Kevin Kolb28ARI6511118312708516965.61
37Brady Quinn28KAN869715910866412705.50
38John Skelton24ARI7611920113658614895.46
39Ryan Lindley23ARI6383141921549725.15
Lg Average5.92
{ 3 comments }

These guys are pretty good.

These guys are pretty good.

After posting about SRS-style quarterback ratings on Monday, I was thinking about other things we can do with game-by-game data like that. In his QBGOAT series, Chase likes to compare QBs to the league average, which makes a lot of sense for all-time ratings — you want to reward guys who are at least above-average in a ranking like that. However, if we want seasonal value, perhaps average is too high a baseline.

Over at Football Outsiders, Aaron Schatz has always compared to “replacement level”, borrowing a concept from baseball. I like that approach, but replacement level can be hard to empirically determine. So for the purposes of this post, I wanted to come up with a quick-and-dirty baseline to which we can compare QBs.

To that end, I looked at all players who were not their team’s primary passer in each game since 2010. Weighted by recency and the number of dropbacks by each passer, they performed at roughly a 4.4 Adjusted Net Yards Per Attempt level. This is not necessarily the replacement level, but it does seem to be the “bench level” — i.e., the ANYPA you could expect from a backup-caliber QB across the league.

Using 4.4 ANYPA as the baseline, we get the following values for 2012:

QuarterbackQBYAB
Tom Brady1888.1
Peyton Manning1708.2
Matt Ryan1453.4
Drew Brees1441.8
Aaron Rodgers1337.4
Robert Griffin III1226.6
Matt Schaub1205.1
Josh Freeman1140.1
Cam Newton1128.2
Tony Romo1120.2
Ben Roethlisberger1082.8
Carson Palmer1011.9
Eli Manning1002.9
Joe Flacco914.8
Russell Wilson890.5
Matthew Stafford834.1
Andy Dalton756.9
Andrew Luck691.6
Sam Bradford616.3
Alex Smith558.5
Colin Kaepernick506.5
Ryan Fitzpatrick481.1
Philip Rivers447.7
Ryan Tannehill409.6
Brandon Weeden320.4
Michael Vick317.5
Jake Locker316.9
Jay Cutler293.8
Chad Henne217.4
Kirk Cousins156.8
Nick Foles152.5
Shaun Hill151.9
Matt Hasselbeck134.0
Kevin Kolb121.4
Blaine Gabbert92.2
Christian Ponder91.0
Mohamed Sanu87.7
Kyle Orton62.8
Matt Moore52.5
Derek Anderson30.1
Matt Flynn23.7
Dan Orlovsky17.6
Greg McElroy11.4
Tyrod Taylor9.2
Rusty Smith9.1
Chase Daniel5.6
Tyler Thigpen2.7
Graham Harrell-1.6
Terrelle Pryor-4.4
Matt Leinart-5.1
David Carr-5.9
Tim Tebow-6.3
Mark Sanchez-13.3
Charlie Batch-17.8
Kellen Clemens-22.4
Ryan Mallett-45.9
Byron Leftwich-46.6
Matt Cassel-47.7
Brad Smith-50.0
T.J. Yates-55.1
Jason Campbell-88.4
Brady Quinn-146.4
John Skelton-309.2
Ryan Lindley-382.0

If we weigh each game by how recent the results took place, we get this list:

QuarterbackWgtd QBYAB
Tom Brady1527.6
Drew Brees1205.4
Peyton Manning1202.0
Matt Ryan1129.8
Aaron Rodgers1109.4
Tony Romo961.1
Cam Newton936.6
Matt Schaub900.3
Robert Griffin III869.5
Eli Manning795.5
Ben Roethlisberger793.9
Josh Freeman790.3
Carson Palmer760.4
Russell Wilson722.9
Matthew Stafford687.5
Joe Flacco666.3
Andy Dalton520.4
Andrew Luck479.9
Sam Bradford459.9
Colin Kaepernick443.0
Alex Smith399.3
Philip Rivers384.9
Ryan Fitzpatrick324.0
Ryan Tannehill313.1
Brandon Weeden266.5
Michael Vick249.9
Jay Cutler236.8
Jake Locker192.4
Chad Henne178.7
Kirk Cousins158.7
Nick Foles150.5
Matt Hasselbeck133.1
Shaun Hill84.4
Kevin Kolb70.6
Matt Moore64.8
Kyle Orton59.8
Mohamed Sanu47.4
Matt Flynn47.4
Blaine Gabbert39.9
Dan Orlovsky26.3
Tim Tebow16.3
Derek Anderson16.3
Greg McElroy10.3
Chase Daniel5.1
Rusty Smith4.8
Tyrod Taylor4.0
Tyler Thigpen-0.8
Graham Harrell-1.4
Matt Leinart-2.8
David Carr-3.3
Terrelle Pryor-4.4
Charlie Batch-7.6
Kellen Clemens-14.0
Matt Cassel-24.2
T.J. Yates-29.7
Brad Smith-33.2
Byron Leftwich-38.3
Christian Ponder-39.4
Ryan Mallett-44.6
Jason Campbell-51.1
Mark Sanchez-91.0
Brady Quinn-113.4
John Skelton-263.6
Ryan Lindley-340.5

This kind of thing isn’t exactly the most advanced stat in the world, but it’s pretty good if you want to sort QBs into general groups based on how good they are (the assumption being that a player who never plays is implicitly a bench-level player by definition).

{ 2 comments }

Week 15 Power Rankings

With only two weeks left in the regular season, it’s time to change the format of my projected standings. At this point, we might as well just predict each of the remaining 32 games. So here goes:

WeekDayVisitorHomeTimeWinner
16SatAtlanta FalconsDetroit Lions8:30 PMAtlanta Falcons
16SunOakland RaidersCarolina Panthers1:00 PMCarolina Panthers
16SunNew Orleans SaintsDallas Cowboys1:00 PMDallas Cowboys
16SunTennessee TitansGreen Bay Packers1:00 PMGreen Bay Packers
16SunMinnesota VikingsHouston Texans1:00 PMHouston Texans
16SunNew England PatriotsJacksonville Jaguars1:00 PMNew England Patriots
16SunIndianapolis ColtsKansas City Chiefs1:00 PMIndianapolis Colts
16SunBuffalo BillsMiami Dolphins1:00 PMMiami Dolphins
16SunWashington RedskinsPhiladelphia Eagles1:00 PMWashington Redskins
16SunCincinnati BengalsPittsburgh Steelers1:00 PMPittsburgh Steelers
16SunSan Diego ChargersNew York Jets1:00 PMNew York Jets
16SunSt. Louis RamsTampa Bay Buccaneers1:00 PMTampa Bay Buccaneers
16SunCleveland BrownsDenver Broncos4:05 PMDenver Broncos
16SunNew York GiantsBaltimore Ravens4:25 PMNew York Giants
16SunChicago BearsArizona Cardinals4:25 PMChicago Bears
16SunSan Francisco 49ersSeattle Seahawks8:20 PMSeattle Seahawks
17SunTampa Bay BuccaneersAtlanta Falcons1:00 PMTampa Bay Buccaneers
17SunNew York JetsBuffalo Bills1:00 PMBuffalo Bills
17SunBaltimore RavensCincinnati Bengals1:00 PMCincinnati Bengals
17SunHouston TexansIndianapolis Colts1:00 PMHouston Texans
17SunChicago BearsDetroit Lions1:00 PMChicago Bears
17SunGreen Bay PackersMinnesota Vikings1:00 PMGreen Bay Packers
17SunCarolina PanthersNew Orleans Saints1:00 PMCarolina Panthers
17SunMiami DolphinsNew England Patriots1:00 PMNew England Patriots
17SunPhiladelphia EaglesNew York Giants1:00 PMNew York Giants
17SunJacksonville JaguarsTennessee Titans1:00 PMTennessee Titans
17SunCleveland BrownsPittsburgh Steelers1:00 PMPittsburgh Steelers
17SunDallas CowboysWashington Redskins1:00 PMDallas Cowboys
17SunKansas City ChiefsDenver Broncos4:15 PMDenver Broncos
17SunOakland RaidersSan Diego Chargers4:15 PMSan Diego Chargers
17SunSt. Louis RamsSeattle Seahawks4:15 PMSeattle Seahawks
17SunArizona CardinalsSan Francisco 49ers4:15 PMSan Francisco 49ers

I’m short on time this week, so let’s move on to the weekly Power Rankings.

[As always, the number of wins I’m projecting each team to finish the season with is in column 3. The fourth column – PWIN – shows how many wins I projected last week, and the difference column represents how many wins I added or subtracted this week. The “RSOS” column stands for the remaining SOS for the team, based on the number of projected wins I’m giving to each of their opponents. The “RHG” column stands for remaining home games.]

TeamRecWinsPrvWinDiffRemSOSRemHGComment
Houston Texans12-2141310.5631One game away from clinching the #1 seed in the AFC. That's huge -- they won't need to beat both Denver and New England to get to their first Super Bowl.
Atlanta Falcons12-2131300.3751A statement win for the Falcons? Unfortunately for Atlanta, regular season games have little upside for them.
Denver Broncos11-3131300.2192I'm still projecting the Broncos to win 13 games. More interestingly, will Peyton Manning become the first player since Ken Anderson to win MVP and Comeback Player of the Year in the same season?
New England Patriots10-41213-10.2811Tom Brady leads the league in ANY/A; if it holds, he will win the ANY/A crown for the third time in his last five full seasons.
Green Bay Packers10-4121110.4381One of the underreported stories of the year: Aaron Rodgers is having a bad year by his lofty standards; he ranks 15th in NY/A after ranking 1st last year.
San Francisco 49ers10-3-111.510.510.51Most non-topical 49ers comment ever: I am really excited to see what LaMichael James does in the playoffs.
Seattle Seahawks9-5111100.5632The 49ers comeback may end up hurting the Seahawks more than the Patriots. Three road games is a tall order for what may be the best team in the NFC.
Chicago Bears8-6101000.2810Last year the Bears started 7-3, but Jay Cutler got hurt and Chicago finished 8-8. This year Chicago started 7-1 but now needs help to make the playoffs.
Indianapolis Colts9-5101000.51For the 2011 Colts, week 16 was when the worst team in the league won at home against an AFC South playoff team. Andrew Luck needs to make sure the same result doesn't happen in 2012.
New York Giants8-6101000.4061The Ravens started 9-2, the Giants started 6-2. This game has morphed from a potential SB preview to a 'which team can sink the fastest' battle.
Dallas Cowboys8-610910.4691Did you know that Tony Romo is on pace to throw for around 4900 yards this year and leads the NFL in 4th quarter comebacks?
Baltimore Ravens9-5910-10.5941That offense without Cam Cameron looked an awful lot like that offense with Joe Flacco from the last five years.
Pittsburgh Steelers7-79900.4382Ben Roethlisberger started the season white hot -- the Steelers need him to finish that way if 2012 won't be considered a lost year.
Washington Redskins8-69900.4381Will Robert Griffin III play this weekend? Washington can probably beat the Eagles without him, but I don't love the idea of Kirk Cousins going up against the Cowboys in week 17.
Cincinnati Bengals8-69810.5631This team has the feel of an 8-8 team, and if they don't want to end up that way, they're going to have to beat one of the big brothers of the AFC North.
Tampa Bay Buccaneers6-88710.6091Tampa Bay is 2-7 in one-score games, arguably the worst such record in the league.
Minnesota Vikings8-68710.8131Adrian Peterson is more likely to break Eric Dickerson's record than the Vikings are to make the playoffs.
New York Jets6-878-10.3751The Mark Sanchez era is over, for now. It's only six games too late, and now the Jets won't be able to really find out what they have in either Tim Tebow or Greg McElroy.
Miami Dolphins6-87700.5631Not a terrible inaugural season for Joe Philbin, especially after how things looked after Hard Knocks.
Carolina Panthers5-97610.3131Cam Newton and the Panthers just keep winning.
St. Louis Rams6-7-16.57.5-10.5940Sam Bradford did not have a great season, but he showed enough improvement considering the lack of weapons around him to give Rams fans hope.
San Diego Chargers5-967-10.3441Norv Turner can't save his job with wins over the Jets and Raiders, right? Right?!
New Orleans Saints6-86600.5311Drew Brees still leads the league in both passing touchdowns and interceptions. For the second year in a row.
Buffalo Bills5-96600.4381An embarrassing performance against Seattle; Canadians aren't going to become Bills fans anytime soon.
Tennessee Titans5-96510.4381Did Titans fans enjoy that win over the Jets? They couldn't have, right?
Cleveland Browns5-956-10.6880While it seems like the Browns have made some progress this year, will they be rebuilding in 2013?
Arizona Cardinals5-95410.6721I like what Aaron Schatz said on twitter: They should put Larry Fitzgerald in the Pro Bowl just so he can play with a real quarterback at least once this year
Detroit Lions4-1045-10.7192Calvin Johnson is going to break Jerry Rice's record, but fans should take the achievement with a grain of salt considering the record number of Lions pass attempts.
Philadelphia Eagles4-1045-10.5941Even Andy Reid has to know he only has two more games left with the Eagles, right?
Oakland Raiders4-104400.4060Will we see more of Terrelle Pryor this week?
Jacksonville Jaguars2-1223-10.5631Jaguars should have the #2 pick locked up, and hope for a "slip" by the Chiefs in the next two weeks.
Kansas City Chiefs2-1223-10.7191A miserable season in Kansas City is about to come to an end.
{ 3 comments }

Looking back: The most surprising games of the year

Five weeks ago, I looked at the most surprising results of the season. It’s time to update that post now that most of the season is in the books.

First, we need to rank the teams. The table below shows each team’s current Simple Rating System rating through week 15. As a reminder, the SRS is simply the sum of a team’s margin of victory and strength of schedule.

RkTeamGMOVSOSSRS
1New England Patriots1413.4-0.213.3
2San Francisco 49ers149.91.711.7
3Seattle Seahawks149.81.210.9
4Denver Broncos1410.1-0.79.4
5Atlanta Falcons148-17
6New York Giants144.91.76.6
7Chicago Bears145.40.86.2
8Houston Texans148.1-26.1
9Green Bay Packers143.71.65.3
10Washington Redskins142.213.2
11Baltimore Ravens142.9-0.82.1
12New Orleans Saints140.71.11.8
13Cincinnati Bengals144.4-2.81.7
14Minnesota Vikings140.80.51.3
15Dallas Cowboys14-0.81.70.9
16Carolina Panthers14-1.62.10.5
17Tampa Bay Buccaneers140.4-0.20.2
18Pittsburgh Steelers141.2-1.9-0.7
19St. Louis Rams14-4.33-1.3
20Miami Dolphins14-1.1-1-2.1
21San Diego Chargers14-0.9-1.5-2.4
22Detroit Lions14-3.10.6-2.5
23Arizona Cardinals14-5.62.5-3.1
24New York Jets14-4.60.8-3.8
25Cleveland Browns14-2.6-2.2-4.7
26Indianapolis Colts14-3.5-2.3-5.8
27Buffalo Bills14-6.9-0.1-6.9
28Philadelphia Eagles14-8.71-7.7
29Tennessee Titans14-7.9-0.7-8.7
30Oakland Raiders14-10.4-1.3-11.7
31Jacksonville Jaguars14-11.7-1.5-13.2
32Kansas City Chiefs14-12.3-1.3-13.6

Eli does not like being surprised.

Half the time, Eli does not like being surprised.

Now that we have each team’s SRS score, it’s easy to come up with a projected game score. For example, since Miami has an SRS of -2.1 and Tennessee has an SRS of -8.7, this means the Dolphins are 6.5 points (rounding error) better than the Titans. Therefore, if Tennessee played at Miami, we would expect Miami to win by 9.5 points.

Well, Tennessee did travel to Miami, but the Titans won the game 37-3. Ouch. Instead of a 9.5-point win, the Dolphins suffered a 34-point loss. Therefore, this game was shocking to the tune of -43.5 points from the standpoint of the Dolphins. That makes it the most surprising game of the year.

Such a method is obviously going to be slanted towards blowouts. What if we wanted to just know which results were the most shocking? If you sort the table below by EXP_MOV — that’s the expected score — and type in “Loss” in the search box, you can see the biggest upsets.

According to the SRS, there were two huge upsets this year that only look more surprising in retrospect. The Patriots should have beaten the Cardinals by 19.4 points in Foxboro, but somehow lost in the final seconds. Meanwhile, the Saints at home against the Chiefs projected as an 18.4-point New Orleans win; it ended up being a Kansas City overtime victory.
[continue reading…]

{ 4 comments }

NYT Fifth Down: Post-week 15

A double post at the New York Times this week.

Did you know that Alex Smith is seven attempts away from qualifying for eligibility for certain rate-based statistics? If Jim Harbaugh wants to game the system — and this is Harbaugh — he could ptobably that Smith breaks the completion percentage record, set by Drew Brees in 2011.

I also looked at how the playoff field will be very familiar this year:

With two weeks remaining in the N.F.L. regular season, seven teams have clinched a playoff berth and several more can clinch this weekend. Chances are, two weeks from now, the teams in the playoffs will look pretty familiar to N.F.L. fans.

In the A.F.C. in 2011, the Patriots, the Ravens, the Texans and the Broncos won the East, North, South and West Divisions. New England, Houston and Denver have already clinched their divisions in 2012, and even the free-falling Ravens are still the favorites to win the A.F.C. North. That would give the conference four repeat division winners, a first since the league moved to the four-division format in 2002.

Last year, the Pittsburgh Steelers and Cincinnati Bengals were the two wild-card teams. Well, those two teams are currently battling for a wild-card spot, and it would be a surprise if both teams are left out of the playoffs. That would leave one spot in the A.F.C., which is most likely going to go to the Indianapolis Colts. The Colts did not make the playoffs in 2011 — in fact, the team had the worst record in the league — but they did make the playoffs every year from 2002 to 2010.

From 2009 to 2011, half of the conference — the Ravens (6), Jets (6), Patriots (5), Steelers (4), Colts (4), Broncos (2), Texans (2), and Bengals (2) — played in 31 of the A.F.C.’s 33 playoff games, and barring the miraculous (the 6-8 Dolphins are technically still alive), that won’t change this year. The last time a Tom Brady-led team didn’t make the playoffs was in 2002; the last time Peyton Manning’s team missed out on the postseason was in 2001. In the A.F.C., some things never change.

The N.F.C. features only slightly more turnover. Green Bay is going to the playoffs for the fourth straight season while Atlanta will be there for the fourth time in the five-year Matt Ryan/Mike Smith“>Mike Smith era. San Francisco has a good chance of securing a first-round bye for the second year in a row. That leaves just three remaining spots.

Seattle, winner of a playoff game just two years ago, is likely to be back in the postseason as well. The Giants, winners of two of the last five Super Bowls, will make the playoffs if they win their final two games. Chicago and Dallas are no strangers to the playoffs, and one might make it again this year. The real “surprise” teams in the N.F.C. are Minnesota — which did go to the N.F.C. championship game three years ago — and Washington. Andrew Luck and Robert Griffin III were the first two picks in the draft and may power their teams to the playoffs this year. When it comes to the 2012 season, that qualifies as unpredictable.

Your weekly updates on Adrian Peterson and Calvin Johnson

At this point, it’s getting impossible to write a statistical column without talking about Adrian Peterson“>Adrian Peterson. The Vikings gained just 322 yards against the Rams on Sunday, but Adrian Peterson“>Adrian Peterson ran for 212, accounting for 66 percent of the Minnesota offense. It was the fourth time this season — and in the last two months — that Peterson has rushed for at least 8 yards per carry on 15-plus carries; since 1960, only Barry Sanders (5) and Peterson have accomplished such a feat in a season.

In one of the most incredible stats of this or any year, Peterson has rushed for 1,313 yards in his last eight games, the most by a player in an eight-game stretch since at least 1960. From 1960 to 2011, only four men rushed for 1,200 yards in that span. In 1977, Walter Payton rushed for 1,221 yards over an eight-game stretch; three years later, Earl Campbell rushed for 1,245 yards in half a season. In 2005, Kansas City’s Larry Johnson gained 1,244 rushing yards in the last eight games of the year. Before Peterson, Eric Dickerson held the record for rushing yards in an eight-game stretch; Dickerson rushed for 1,292 yards in the last five games of the ’84 season and the first three games of 1985.

For more on Peterson and Calvin Johnson, along with some interesting week 15 stats, check the full article here.

{ 0 comments }

Checkdowns: Biggest failed comebacks

Brady joins Marino on the failed comebacks list

Brady joins Marino on the failed comebacks list.

[UPDATE: There was an error earlier in this post. I believe it is fixed now.]

On Sunday Night, the Patriots trailed 31-3 halfway through the third quarter. But that’s when Tom Brady got hot, and New England tied the game with 6:43 left in the 4th quarter. At that moment, many fans probably had visions of the Oilers-Bills playoff game, where Buffalo came back from a 32-point deficit to win.

And while there are a lot of famous comebacks, the failed comeback is much less memorable. But in fact, this was the 4th time a team trailed by 28 points in the game only to tie or take the lead in the 4th quarter… but ultimately lose.

The table below shows all games prior to 2012 where a team trailed by at least 21 points, was trailing entering the 4th quarter, came back to tie or take the lead in the 4th quarter, but then still lost. The table is listed from the perspective of the eventual winner and shows the final points for and points allowed in the game, along with the biggest lead and the largest fourth-quarter deficit the winning team faced despite the large early lead.

YearDateBoxscoreTmOppPFPABgLdDef
199409/25/1994BoxscoreMINMIA3835280
194409/24/1944BoxscoreGNBCHI4228280
200710/21/2007BoxscoreTENHOU383625-1
200412/12/2004BoxscoreSFOARI3128250
198012/07/1980BoxscoreCINBAL343325-2
198710/25/1987BoxscoreGNBDET343324-2
198101/02/1982BoxscoreSDGMIA413824-7
199609/22/1996BoxscoreNWEJAX2825220
201012/13/2010BoxscoreBALHOU3428210
200910/11/2009BoxscoreARIHOU2821210
200901/10/2010BoxscoreARIGNB5145210
200809/14/2008BoxscoreGNBDET482521-1
200612/17/2006BoxscoreCHITAM3431210
200410/10/2004BoxscoreMINHOU3428210
200311/30/2003BoxscoreNWEIND3834210
199912/12/1999BoxscoreKANMIN3128210
199812/06/1998BoxscoreSFOCAR3128210
199511/19/1995BoxscoreDENSDG3027210
199309/12/1993BoxscoreNORATL3431210
199301/03/1994BoxscorePHISFO3734210
199111/17/1991BoxscoreNYJNWE2821210
199010/07/1990BoxscoreCINRAM3431210
198909/10/1989BoxscoreNWENYJ272421-3
198611/20/1986BoxscoreRAISDG3731210
198301/08/1984BoxscoreWASSFO2421210
198011/23/1980BoxscoreNYJHOU3128210
197909/09/1979BoxscoreWASDET2724210
197511/30/1975BoxscoreWASMIN313021-6
196011/06/1960BoxscoreBALGNB3824210
194910/23/1949BoxscoreNYGCHI3528210
194511/04/1945BoxscoreWASCRD2421210

Note that this excludes games this game between Green Bay and Pittsburgh from 1951, where the Packers held a 28-point lead and won, but actually trailed entering the 4th quarter.

{ 1 comment }

Here’s a quick set of quarterback ratings I was messing around with, based on Doug’s Simple Rating System. The basic setup: I took every passer-game (Att > 0) since the 2010 season, weighting for recency according to Wayne Winston’s method. I ran the data through the SRS to adjust for the quality of opponent pass defenses, creating a predicted Net YPA rate for each passer in each game via the following formula:

Predicted NYPA = League Constant + Home-Field Advantage + Passer Rating – Opponent Pass D Rating

The league constant in this case was a Net YPA of 6.24; the homefield component (which was positive while at home, negative on the road, and 0 in Super Bowls) was 0.05. Minimize the sum of squared errors between predicted and actual NYPA for each passer-game (weighted by recency and how many dropbacks the passer had in the game), and you’ve got a set of opponent-adjusted, recency-weighted QB ratings.

Throwing out the Brett Favres and Curtis Painters of the world who haven’t been active this year, here are the full ratings:

PlayerWgtd DrpbksNYPA Rating
Mohamed Sanu0.660.94
Brian Hoyer0.29.80
Shaun Hill8.85.13
Derek Anderson2.93.96
Kirk Cousins47.22.37
Chase Daniel1.22.02
Matt Flynn13.21.74
Tom Brady467.01.23
Kyle Orton20.71.16
Russell Wilson266.00.95
Robert Griffin III257.70.92
Peyton Manning382.90.78
Drew Brees472.30.75
Matt Ryan440.80.73
Colin Kaepernick147.40.72
Eli Manning399.10.64
Cam Newton359.50.64
Tony Romo468.30.54
Aaron Rodgers394.90.50
Kellen Clemens9.70.45
Matt Schaub376.30.39
Alex Smith176.10.39
Charlie Batch66.10.37
Josh Freeman395.00.28
Ben Roethlisberger324.60.23
Carson Palmer445.60.15
Matthew Stafford521.20.10
Joe Flacco410.40.00
Rusty Smith3.3-0.03
Tyrod Taylor2.5-0.10
Andrew Luck433.0-0.11
Jake Locker192.4-0.11
Sam Bradford399.1-0.15
Josh McCown4.7-0.17
Matt Moore36.9-0.18
Tarvaris Jackson26.4-0.20
Ryan Tannehill320.8-0.20
Rex Grossman27.3-0.21
Jordan Palmer0.0-0.27
Michael Vick231.4-0.30
Brandon Weeden367.1-0.40
Andy Dalton395.9-0.40
Dennis Dixon0.1-0.41
Ryan Fitzpatrick374.6-0.43
Jay Cutler307.5-0.43
Philip Rivers419.2-0.49
Drew Stanton0.5-0.56
Matt Hasselbeck181.8-0.58
Chad Henne212.4-0.59
Matt Cassel196.9-0.62
Mark Sanchez318.0-0.69
Dan Orlovsky21.3-0.76
Joe Webb5.3-0.77
Tyler Thigpen6.2-0.88
Colt McCoy24.7-0.90
Tim Tebow28.3-0.96
John Skelton172.9-1.04
Bruce Gradkowski1.4-1.09
Nick Foles205.3-1.16
Blaine Gabbert213.0-1.23
Christian Ponder334.1-1.23
T.J. Yates22.1-1.24
Kevin Kolb132.1-1.38
Jason Campbell55.1-1.46
Brady Quinn147.2-1.49
Charlie Whitehurst3.3-1.91
Byron Leftwich45.4-2.13
Trent Edwards0.4-2.13
Luke McCown2.5-2.14
Jimmy Clausen1.3-2.17
Ryan Mallett3.1-2.26
Caleb Hanie7.9-2.30
Ryan Lindley133.6-2.37
Greg McElroy7.0-2.51
Graham Harrell2.0-2.79
David Carr1.2-4.09
Matt Leinart1.6-4.71
Brad Smith0.7-6.04
Terrelle Pryor1.0-7.09

[continue reading…]

{ 1 comment }

Adjusting team sack rates in the NFL for SOS

I’ve got sacks on the mind today. A few hours ago, I looked at the single-season sack records by various players in both the 3-4 and 4-3. Today I also want to look at things from the team perspective. In 2012, which team is the best at getting to the quarterback? You might think that’s as simple as looking at a list of defensive statistics and sorting by sacks, but I’d like to take a more nuanced approach.

There are two factors that heavily impact a team’s sack rate: the opponents they face and the number of passing plays they defend. Using sack rate instead of sacks helps to solve the latter issue, but we still need an opponent adjustment even if we use sack rate. It’s a bit tricky doing it correctly, because you need to iterate the results just like you do with the SRS. What I mean by that is the sack rate of the Denver defense will need to be adjusted for the sack rate of the Kansas City, Oakland, and San Diego offenses (among other teams), and those will need to be adjusted for the Denver defense (and all the other defenses those teams faced).

Once you properly iterate the results, what are the results? The table below shows the top defenses this year at getting to the quarterback, although note that these numbers exclude the games from week 15. The table shows how many pass attempts each team has faced, the number of actual sacks they have recorded and their actual sack rate; the next column shows the SOS adjustment to the sack rate, with a positive number indicating a difficult strength of schedule (i.e., they’ve faced teams that are difficult to sack). The last two columns show the SOS-adjusted sack rates and total sacks.

RkTeamATTACT SKSK RTSOSADJ SK RTADJ SK
1DEN506397.7%0.9%8.6%43.3
2CIN542437.9%0.5%8.4%45.7
3ARI426348%-0.5%7.4%31.7
4DAL429296.8%0.3%7.1%30.4
5CAR483306.2%0.9%7.1%34.2
6KAN389246.2%0.9%7.1%27.5
7STL489398%-1.2%6.8%33.1
8PHI467286%0.8%6.8%31.6
9HOU533376.9%-0.2%6.7%35.9
10MIA532377%-0.2%6.7%35.7
11GNB524356.7%-0.1%6.6%34.6
12BAL506305.9%0.6%6.6%33.3
13CLE531346.4%0.2%6.6%34.8
14NYG464316.7%-0.1%6.5%30.4
15SFO478326.7%-0.4%6.3%30.3
16PIT434266%0.3%6.3%27.4
17ATL463286%0.3%6.3%29.2
18BUF484316.4%-0.2%6.2%30.2
19CHI498336.6%-0.5%6.1%30.6
20SDG508254.9%1%5.9%30
21TEN481275.6%0.3%5.9%28.3
22SEA475326.7%-1.1%5.7%27
23NWE511285.5%-0.1%5.3%27.3
24NOR496255%0.2%5.3%26.1
25MIN515316%-0.8%5.2%27
26DET490306.1%-1.1%5%24.4
27WAS539234.3%0.7%4.9%26.6
28TAM541244.4%0.5%4.9%26.5
29NYJ446224.9%-0.1%4.8%21.5
30IND470245.1%-0.4%4.7%22.3
31OAK465173.7%0.7%4.3%20.1
32JAX464143%0%3%14

[continue reading…]

{ 3 comments }

Monster

J.J. Swatt.

Houston’s J.J. Watt sacked Andrew Luck three times on Sunday, bringing his season sack total to 19.5. Entering 2012, Bruce Smith was the single-season record holder for sacks by a defensive lineman in a 3-4 scheme with 19 in 1990. The sack has only been an official statistic since 1982, but since the 3-4 only entered the NFL in the mid-’70s, we can be pretty sure that Watt is now the all-time record holder.

The tables below show the single-season leaders by various defensive players in 3-4 and 4-3 schemes from 1982 to 2011.

Let’s start with a look at the most sacks by a 3-4 defensive end:

YearTeamNamePosSacks
1990BUFBruce Smith3-4 DE19
1983SFOFred Dean3-4 DE17.5
1984PHIGreg Brown3-4 DE16
1983MIADoug Betters3-4 DE16
1983SEAJacob Green3-4 DE16
1992NORWayne Martin3-4 DE15.5
1986RAISean Jones3-4 DE15.5
1985NYGLeonard Marshall3-4 DE15.5
1993KANNeil Smith3-4 DE15
1986SDGLee Williams3-4 DE15
1986BUFBruce Smith3-4 DE15
1984KANArt Still3-4 DE14.5
1984SEAJeff Bryant3-4 DE14.5
1983GNBEzra Johnson3-4 DE14.5
1997BUFBruce Smith3-4 DE14
1993BUFBruce Smith3-4 DE14
1992BUFBruce Smith3-4 DE14
1989SDGLee Williams3-4 DE14
1984MIADoug Betters3-4 DE14
1984CLEReggie Camp3-4 DE14
1983PITKeith Willis3-4 DE14

As you can imagine, 3-4 defensive linemen don’t rack up many sacks. Bill Pickel, a nose tackle for the Raiders in the ’80s, recorded 12.5 sacks in both ’84 and ’85, making him the only 3-4 tackle to record more than 12 sacks in a season. Karl Mecklenburg, with 13 sacks for the Broncos in ’85, remains the only inside linebacker in a 3-4 with more than a dozen sacks.

Of course, 3-4 outside linebackers get all the glory in that scheme. San Francisco’s Aldon Smith has 19.5 sacks so far in 2012 with two games remaining, but here were the leaders prior to 2012:

YearTeamNamePosSacks
1986NYGLawrence Taylor3-4 OLB20.5
2008DALDeMarcus Ware3-4 OLB20
1990KANDerrick Thomas3-4 OLB20
2011DALDeMarcus Ware3-4 OLB19.5
1989GNBTim Harris3-4 OLB19.5
1984NWEAndre Tippett3-4 OLB18.5
2008MIAJoey Porter3-4 OLB17.5
1995BUFBryce Paup3-4 OLB17.5
2009DENElvis Dumervil3-4 OLB17
2006SDGShawne Merriman3-4 OLB17
1992SFOTim Harris3-4 OLB17
1991NORPat Swilling3-4 OLB17
1989NORPat Swilling3-4 OLB16.5
1989RAMKevin Greene3-4 OLB16.5
1988RAMKevin Greene3-4 OLB16.5
1985NWEAndre Tippett3-4 OLB16.5
2008PITJames Harrison3-4 OLB16
1992DENSimon Fletcher3-4 OLB16
1990SFOCharles Haley3-4 OLB16
2010DALDeMarcus Ware3-4 OLB15.5
1988NYGLawrence Taylor3-4 OLB15.5
1998CARKevin Greene3-4 OLB15
1989NYGLawrence Taylor3-4 OLB15
1984PITMike Merriweather3-4 OLB15

What about 4-3 defensive ends?

YearTeamNamePosSacks
2001NYGMichael Strahan4-3 DE22.5
2011MINJared Allen4-3 DE22
1984NYJMark Gastineau4-3 DE22
1989MINChris Doleman4-3 DE21
1987PHIReggie White4-3 DE21
1992PHIClyde Simmons4-3 DE19
1983NYJMark Gastineau4-3 DE19
2003NYGMichael Strahan4-3 DE18.5
2002MIAJason Taylor4-3 DE18.5
1986WASDexter Manley4-3 DE18.5
2011PHIJason Babin4-3 DE18
1988PHIReggie White4-3 DE18
1984CHIRichard Dent4-3 DE17.5
1999STLKevin Carter4-3 DE17
1992SDGLeslie O'Neal4-3 DE17
1985CHIRichard Dent4-3 DE17
2011NYGJason Pierre-Paul4-3 DE16.5
2008ATLJohn Abraham4-3 DE16.5
2000MIATrace Armstrong4-3 DE16.5
1999ARISimeon Rice4-3 DE16.5
1998SEAMichael Sinclair4-3 DE16.5
2005OAKDerrick Burgess4-3 DE16
2004INDDwight Freeney4-3 DE16
1998GNBReggie White4-3 DE16
1983STLCurtis Greer4-3 DE16

And 4-3 defensive tackles:

YearTeamNamePosSacks
1989MINKeith Millard4-3 DT18
1986PHIReggie White4-3 DT18
2000NORLa'Roi Glover4-3 DT17
2000TAMWarren Sapp4-3 DT16.5
1997MINJohn Randle4-3 DT15.5
1997SFODana Stubblefield4-3 DT15
1992SEACortez Kennedy4-3 DT14

4-3 outside linebackers rarely rack up huge sack numbers. In fact, Denver’s Von Miller, who has 16 sacks this year, is already the record holder in the official sack era. Derrick Thomas (14.5 sacks in 1992, 13 in 1996) in Kansas City, Washington’s Ken Harvey (13.5 in ’94) and Cleveland’s Jamir Miller (13 in ’01) are the only other 4-3 outside linebackers with more than twelve sacks in a season since 1982. (Of course, Thomas also had a 20-sack season a 3-4 outside linebacker.) Charlie Clemons, with 13.5 sacks in 2001, is the record holder among 4-3 middle linebackers.

{ 2 comments }

Trivia of the Day – Sunday, December 16th

Manning finds the last empty spot on his trophy case.

What do you give to the man who already has everything? How about a Comeback Player of the Year Award?

Right now, the choice for AP Comeback Player of the Year is a two-horse race between Peyton Manning and Adrian Peterson. If Manning wins the award, it will put him in pretty rare territory: he’d be just the fourth player to, over the course of a career, be named by the Associated Press as the Most Valuable Player of the Year, Comeback Player of the Year, and Super Bowl MVP. Can you name the first three?

Below is one hint for each of the three players who have won all three awards.

Trivia hint for Player 1 Show


Click 'Show' for the Answer for Player 1 Show

Trivia hint for Player 2 Show


Click 'Show' for the Answer for Player 2 Show

Trivia hint for Player 3 Show


Click 'Show' for the Answer for Player 3 Show

{ 5 comments }

From the Colorado School of Mines to the NFL

Unless you follow Division II football, you probably aren’t familiar with the name Bob Stitt. He’s the head coach at the Colorado School of Mines, and here is what Bruce Feldman wrote about him in the summer of 2011 in connection with the One-Back Clinic, an annual meeting of a few of the sharpest minds in college football:

Stitt is the 45-year-old head coach at Colorado School of Mines, a Division II school just down the road from the Coors facility in Golden, Co. Stitt is a regular to the one-back clinic and has become pals with [Dana] Holgorsen and the rest of the core crowd. His teams win big despite dealing with high academic requirements… Stitt’s topic is the pistol offense and back-shoulder throws. As you’ll find out, Stitt is a huge believer in the back-shoulder throw. He talks about it the way Jared talks about Subway. “If this stuff works with our guys, it’ll probably work with the guys you have,” he says. “We’re an engineering school, and we only have one major, engineering. Our average ACT score in math is 29.” That line draws the biggest “Oooh!” of the day. . . .

The tricky part of Stitt’s tact — as is the case with many of the things discussed here — is that it’s hard to say just how well these things could be replicated someplace else. “I love coming to this because it reinforces a lot of what we do, ” one coach says. “Sometimes you might get one or two things you can try out from a technique or a practice point.” It’s also pretty good for networking because you never know what position might open a few months from now.

That was only a year and a half ago, but Stitt’s fame has grown considerably since then. He’s become famous in some circles for the Fly Sweep, a play brought to the national state when Holgorsen repeatedly used the Fly Sweep in the Orange Bowl eleven months ago. So what is the Fly Sweep?

On most plays, West Virginia has Geno Smith in shotgun in a fairly standard shotgun spread look. On the Fly Sweep, the Mountaineers would motion a wide receiver/running back, usually Tavon Austin, before the snap, and have him accelerate as he approached the quarterback. When well-executed, the snap would arrive in Smith’s hands for just a fraction of a second before he would pitch the ball forward to Austin, who would be arriving between the center and the quarterback just a second after the ball was snapped. Already in motion and with the ball in his hands, Austin would then be able to use his considerable speed and quickness to get in space and rack up yards against an unprepared defense.

Well, in the Orange Bowl, it was executed perfectly. For four touchdowns. Take a look:

One of the benefits of the play is that it is low risk: if the quarterback/sweep exchange is mishandled, it’s simply an incomplete pass because the quarterback is technically throwing the ball forwards. So why the post today? Well, last week, the Stitt Sweep (my post, I get to pick the name) entered the NFL. I’m not sure if Jay Gruden picked up the play from his time in the Arena Football League or the World Football League — or maybe from just watching last year’s Orange Bowl — but there’s no doubt where the inspiration came from the Bengals first touchdown of the game against the Cowboys. You can see Andy Dalton’s touchdown “pass” to Andrew Hawkins at the 40-second mark of this video.

{ 1 comment }

Checkdowns: Elo-Ratings for NFL teams

So we're going to pretend all my losses were by 1 point?

So we're going to pretend all my losses were by 1 point?

Just a quick Friday night checkdown post. By now, you’re very familiar with the Simple Rating System. I used the SRS to create college football ratings every week this season and used the SRS to grade NFL teams earlier this year. Pro-Football-Reference.com calculates SRS ratings every week and they are always available on their Standings page.

The first S in SRS stands for Simple because the SRS is simply the sum of two variables: a team’s average margin of victory (or points differential) and a team’s strength of schedule.

But what if we only care about wins and losses? Even in that case, we still care about strength of schedule. The BCS mandates that the computer systems used to provide the official BCS ratings ignore margin of victory. Essentially, that’s what I’m doing here. To provide Elo-style ratings for NFL teams, I made each win a one-point win, each loss a one-point loss, and each tie worth 0 points. Therefore, a team’s MOV perfectly matches its record, leaving just the SOS to shuffle the deck.

Is this useful for anything? No. That’s why it’s a Friday night checkdown.

RkTeamGMOVSOSSRSRecord
1Houston Texans130.6920.0110.70411-2-0
2New England Patriots130.5380.1160.65410-3-0
3San Francisco 49ers130.4620.0810.5439-3-1
4Green Bay Packers130.3850.1070.4929-4-0
5Atlanta Falcons130.692-0.2730.4211-2-0
6Denver Broncos130.538-0.1660.37310-3-0
7Chicago Bears130.2310.1210.3528-5-0
8Seattle Seahawks130.2310.1140.3458-5-0
9Indianapolis Colts130.385-0.0530.3329-4-0
10Baltimore Ravens130.385-0.1350.2499-4-0
11New York Giants130.231-0.040.1918-5-0
12St. Louis Rams1300.1750.1756-6-1
13Minnesota Vikings130.0770.0670.1447-6-0
14New York Jets13-0.0770.1720.0956-7-0
15Washington Redskins130.077-0.0030.0747-6-0
16Dallas Cowboys130.077-0.0120.0657-6-0
17Cincinnati Bengals140.143-0.203-0.068-6-0
18Pittsburgh Steelers130.077-0.138-0.0617-6-0
19Miami Dolphins13-0.2310.126-0.1055-8-0
20Buffalo Bills13-0.2310.067-0.1645-8-0
21Arizona Cardinals13-0.3850.203-0.1814-9-0
22Detroit Lions13-0.3850.188-0.1974-9-0
23Tampa Bay Buccaneers13-0.077-0.162-0.2396-7-0
24Tennessee Titans13-0.3850.134-0.254-9-0
25New Orleans Saints13-0.231-0.035-0.2665-8-0
26Cleveland Browns13-0.231-0.125-0.3565-8-0
27Carolina Panthers13-0.3850.014-0.3714-9-0
28San Diego Chargers13-0.231-0.165-0.3965-8-0
29Philadelphia Eagles14-0.429-0.048-0.4764-10-0
30Jacksonville Jaguars13-0.6920.141-0.5512-11-0
31Oakland Raiders13-0.538-0.112-0.6513-10-0
32Kansas City Chiefs13-0.692-0.148-0.842-11-0
{ 2 comments }

What to do on 4th-and-7 in No Man’s Land

You went to Harvard, help me out on this

You went to Harvard, help me out on this.

Twice in close games in the last month, an NFL team has arrived at a three-way junction with seemingly no desirable path. In each case, the team faced a 4th and 7 from so-called ‘no man’s land.’

On November 25th, trailing the Atlanta Falcons 24-23, the Buccaneers had the ball on 4th and 7 from the Atlanta 38-yard line with just over three minutes remaining. Greg Schiano had all his timeouts left but faced a very difficult decision.

On Sunday, with 12 minutes remaining and a 12-7 lead, Chan Gailey’s Bills faced a 4th-and-7 from the St. Louis 34-yard-line. It’s worth noting — in part because it was notable to Gailey — that minutes earlier, Buffalo scored a touchdown but Shawn Powell botched the extra point, preventing Buffalo from going up 13-7. I suppose we could dwell on the fact that up 5 with 20 minutes left in the game after scoring a touchdown is an obvious scenario that calls for going for two, but let’s not do that in this post.

In Tampa Bay, Schiano attempted a 56-yard field goal. In Buffalo, with rain but wind at his back, the Bills sent on the field goal unit but then changed their mind and chose to punt, with the botched snap from minutes earlier apparently being a factor in the decision.

Who was right? Who was wrong? If you think this post is just a bunch of words I needed to type to show off a really cool graphic, you’re right. Take a look at this chart Brian Burke made to tell you what to do on 4th down generally:

At the 35-yard-line facing 4th and 7 is not a desirable situation, but Burke does say you should go for it. If you are a few yards closer to the end zone and it’s 4th and 8, then kicking is the advised course of action, while punting is best reserved for more dire circumstances.

What do teams actually do? This year, 15 times a team has faced a 4th-and-7 from between the 34- and the 38-yard lines. Nine times the team chose to kick the field goal, with teams hitting on 5 of those 9; Nick Folk missed from 52 but made from 54, Josh Brown hit from 52, Matt Prater from 53, Robbie Gould from 54, and Sebastian Janikowski from 55, while Dan Bailey and Janikowski missed from 54. The 9th example was in Tampa Bay, where Connor Barth missed from 56 yards out.

As you might expect if you have watched an NFL game before, coaches who chose not to kick the field goal did not entirely embrace the idea of going for it. Twice the Bills sent Shawn Powell out to punt (net of 29 and 24 yards), twice a team punted the ball out of the end zone (Pat McAfee, Dave Zastudil), and Andy Lee pinned the Rams on their four-yard-line with a 33-yard punt.

There was one coach who chose to go for it. It was Marvin Lewis, that beacon of wisdom in a cavernous field of conservative coaches. In the first quarter, trailing 3-0 to the Chiefs, first Lewis called a fake punt and when the drive stalled on the Kansas City 36, he chose to go for it. Andy Dalton scrambled for 11 yards, the Bengals would score a touchdown three plays later, and Cincinnati would go on to win the game, 28-6.

So what is the right call in the NFL’s version of the Bermuda triangle? The first answer is “it depends.” All these league average stats and theories have caveats which are easy to ignore in obvious situations. In close situations, like this one, all those caveats apply. Is it windy or raining? Are you in a dome? How good is your quarterback? What’s the score? How much time is left? And on and on.

Here are my thoughts for the two examples in this post.

  • Schiano made the wrong call, but probably not for the reason you’re thinking. I’d say Barth had something resembling a 50/50 shot of converting that field goal, but what is the upside if he does? You now have a one-point lead against the Falcons with 3:30 to go and they have the ball. That’s not exactly a desirable scenario. According to Burke, the league average team has a 48% chance of winning if they have 1st and down on their own 22 with 3:30 left and trailing by one point. But this was not a situation involving league average teams. Matt Ryan has led the NFL in 4th quarter comebacks and game-winning drives in two of the last three years. He ranks 10th in ANY/A and 3rd in completion percentage, which might actually matter when your only real goal is gaining 10 yards every four plays. To make matters worse, despite an incredible run defense, Tampa Bay ranks 32nd in both passing yards allowedand net yards per attempt allowed.

    If there were six minutes left, maybe this is a different story, but I think there was too little time left to give up the ball like that. You’ve got Josh Freeman — who ranks 4th in ANY/A — going against a mediocre Falcons pass defense. I’d go for it in that situation, because your best path to victory is to gain 7-10 yards and then bleed the clock before kicking the game-winning field goal. I’ll also add this: to the extent that you want to bank on your opponent’s conservatism, punting is not as bad of an option as you might think. If you can down the punt inside the 10, and feel confident that Atlanta would run it three times, then you’re in pretty good. If successful, you would get the ball back with about 3 minutes left (remember, Tampa Bay had all three timeouts) and basically place yourself in that positive situation the Falcons would have been in if the Bucs hit the field goal, except Tampa would have been about 25 yards closer. Of course, I have no idea how much you can count on your opponent being conservative: that would depend on the opponent.
  • While the clock was the most important variable in the Tampa game, it wasn’t a huge factor in Buffalo. The Bills led by 5 points with 12 minutes to go. In this case, the Bills were at the 34, not the 38, which tilts towards the field goal and away from the punt. On the other hand, there were weather issues at play. In a rare twist, Burke’s calculator essentially has all three options as even, with the Bills having a 77-78% win probability regardless of whether they chose to punt, kick, or go for it. The Bills have a slightly below average passing offense and the Rams a slightly above average passing defense, but neither factor is particular strong. This is one of the closest calls I can think of, as I see good arguments for all three options. The Bills punted and pinned the Rams inside the five, so Chan Gailey won’t face too much criticism.

    But while extending a lead from 5 to 8 points doesn’t sound like much, it actually has a significant impact. Down by 8, you need to do a bunch of things well and then convert a two-point conversion and then win in overtime, and those two events only happen 25% of the time. Down by 5 you just need to do a bunch of things well. The weather is an important factor here — Rian Lindell said the wind was at his back, which maybe makes the weather a nonfactor even if it was raining, cold, and windy. In field goals from the 33-, 34-, or 35-yard line since 2009, NFL kickers have been successful 62% of the time. Again, the conditions are a huge variable here, but I think I would have trusted my kicker in this case.
{ 2 comments }

Week 14 Power Rankings

Richard Sherman exhibits the proper form for 'You Mad Bro?' in sign language.

It’s time to take Seattle seriously. On Sunday, the Seahawks had a “name your score” game, the type of matchup college football powerhouses regularly use to beef up their statistics. The Seahawks defense took over the game, posting the 10th highest fantasy performance ever, but the offense wasn’t too shabby, either. Seattle rushed for 284 yards and 4 touchdowns, and Russell Wilson completed 7 of 13 passes for 148 yards.

Brian Burke now has the Seahawks 4th in his power rankings. Aaron Schatz has Seattle second overall, and even had them first before the Patriots blew out the Texans on Monday Night. Seattle is third according to the SRS, too. Seattle is better on offense than you think: the Seahawks rank 8th in ANY/A and 11th in NY/A and 4th in rushing yards and 5th in rushing first downs. Seattle is 15th in points scored and 14th in PFR’s Expected Points Added, but they’ve done all this despite facing a pretty difficult schedule filled with good defenses.

Defensively, they’re in the top 10 in rushing yards allowed, rushing first downs allowed, rushing touchdowns allowed and EPA. The Seahawks are 4th in NY/A and 2nd in ANY/A allowed, while ranking 7th in turnovers forced, 3rd in yards allowed and 2nd in points allowed.

They’re really good and really balanced. Are they a Super Bowl contender? Absolutely. So what about that 8-5 7-6 record according to Packers fans? Well, Seattle lost by 4 in Arizona, by 6 in St. Louis, by 7 in San Francisco, by 4 in Detroit, and by 3 in Miami. They were leading in the 4th quarter in every game except the 49ers loss (trailed by 4 late in the game) and the Rams loss (intercepted in Rams territory in the final minutes). They’ve lost some close games in the 4th quarter and dominated most of their other opponents. They’re one of the best teams in the NFL. Obviously they’re even better at home, but if New England defeats San Francisco this week, the entire landscape of the NFC playoffs will change.

If the 49ers lose in Foxboro, the Seahawks control their own destiny for the division title since they host the 49ers in week 16. And if the Packers lose one of their final three games, the Seahawks would control their own destiny for the 2 seed, which would mean a bye and a home playoff game — or possibly two, if Matt Ryan and the Falcons lose like everyone expects. Essentially, Seattle fans can dream about this scenario:

— New England wins at home against San Francisco (the Patriots are 5-point favorites)
— Green Bay loses in Chicago (or in Minnesota or at home against the Titans)
— Seattle wins in Toronto, which would be their last road game of the year if…
— Seattle beats San Francisco and St. Louis at home and…
— The Falcons lose to the Giants or 49ers or whichever team they face in the second round of the playoffs

There are a lot of “ifs” and “ands” but they’re in as good a position as I can ever remember an 8-5 team being. Of course, even as the 2 seed they would likely have to beat Green Bay and then either New York or San Francisco to get to the Super Bowl, so I wouldn’t book tickets to New Orleans just yet.

[As always, the number of wins I’m projecting each team to finish the season with is in column 3. The fourth column – PWIN – shows how many wins I projected last week, and the difference column represents how many wins I added or subtracted this week. The “RSOS” column stands for the remaining SOS for the team, based on the number of projected wins I’m giving to each of their opponents. The “RHG” column stands for remaining home games.]

TeamRecWinsPrvWinDiffRemSOSRemHGComment
Atlanta Falcons11-21314-10.4582According to Advanced NFL Stats, the Panthers had a 62% chance of winning against Atlanta.
Houston Texans11-2131300.5632That's your classic 'burn the tape' game. Houston still controls their own destiny for the #1 seed.
Denver Broncos10-3131300.3962Guess what? I still think the Broncos win 13 games this year.
New England Patriots10-3131210.4272But so will the Patriots. We could have three 13-3 teams in the AFC and no one else with more than ten wins.
Green Bay Packers9-4111100.4581Aaron Rodgers leads the league in sacks for the second time in four years.
Seattle Seahawks8-5111010.5002Russell Wilson will get some Rookie of the Year votes if the Seahawks get 11 wins.
San Francisco 49ers9-3-110.511.5-10.5831Aldon Smith is a monster. He's got Michael Strahan's "record" in sight. But at New England and at Seattle are brutal tasks.
Baltimore Ravens9-41011-10.6462When the Ravens were 9-2, I wrote "I still don't believe in this team, because they aren't going to have amazing special teams or amazing 4th and 29 conversions every week."
Chicago Bears8-51011-10.4171The Bears took care of business early in the year, giving themselves some margin for error later on. Finishing against Arizona and Detroit gives them a safety net
Indianapolis Colts9-4101000.6041If it didn't look like they were going to play Baltimore, I'd say picking against the Colts will be the easiest call of the playoffs.
New York Giants8-510910.5831There are no easy games left, but I'm not ready to bet against the Giants.
Pittsburgh Steelers7-6910-10.4792This team suffers so many inexplicable losses, Mike Tomlin has to bear some of the blame.
Dallas Cowboys7-69810.5002Huge game for the Cowboys to beat the Bengals. Wait, if they won, it couldn't have been a huge game, right?
Washington Redskins7-69810.4171NFC East race is going to be fascinating. Robert Griffin III and Kirk Cousins combined for the comeback win to keep Washington alive.
Cincinnati Bengals7-689-10.5001Just when I start to get on their bandwagon, the Bengals did the unthinkable and blew a lead against the Cowboys.
New York Jets6-78710.3751The Jets proved that they can beat the worst teams in the league. The Titans are right on that border, so Monday Night will be interesting.
St. Louis Rams6-6-17.57.500.5211Incredible job by Jeff Fisher this year. Rams can make the playoffs if they run the table.
Tampa Bay Buccaneers6-778-10.5521I did not see that coming; blowing a big lead, at home, against Nick Foles, means this team is farther away than I thought.
Miami Dolphins5-87700.4582Miami gets to host in-state rival Jacksonville and division rival Buffalo the next two weeks. Unfortunately, it's another meaningless december for the Dolphins.
Minnesota Vikings7-67610.6561I thought the Vikings were done, but Adrian Peterson took over against the Bears.
San Diego Chargers5-87610.3752Keep Norv!
New Orleans Saints5-867-10.4582Drew Brees leads the league in both passing touchdowns and interceptions.
Buffalo Bills5-867-10.5422One loss away from clinching their 7th consecutive losing season. They get to expand their internationl reach in Toronto this weekend.
Carolina Panthers4-96510.3541That's the type of team Carolina could be. I don't think Ron Rivera can save his job, but his team was well-prepared against Atlanta.
Cleveland Browns5-86510.6461Cleveland won by 23 points. That's kind of a big deal, since the new Browns have only won by so many points once before.
Tennessee Titans4-956-10.4582Titans did a great job against Andrew Luck, but could not come away with the win. Next up? Mark Sanchez.
Detroit Lions4-95500.5632Only interesting thing over the next three weeks is whether Calvin Johnson can break Jerry Rice's record.
Philadelphia Eagles4-95410.5632Keep Andy!
Arizona Cardinals4-945-10.5312From 4-0 to 4-12.
Oakland Raiders3-104400.3331This was going to be a one step backwards type of season with a new regime; the question is will they ever take two steps forward?
Jacksonville Jaguars2-113300.5211Fought valiantly for a bad team that's been killed by injuries and lacks talent just about everywhere. Of course, their opponent was the Jets.
Kansas City Chiefs2-113300.5631Chiefs-Raiders this weekend with the #1 pick on the line.
{ 2 comments }

You’re probably hearing a lot right now about how Matt Schaub is not a primetime player — literally. Schaub and the Texans struggled in embarassing losses on Sunday Night Football to the Packers earlier in the season and on Monday Night Football two days ago to the Patriots. Schaub posted terrible numbers in a defensively-driven 13-6 win over the Jay Cutler/Jason Campbell Bears.

For his career, Schaub is 2-5 (0.286 winning percentage) in night games and 41-31 (0.569) in day games. Among the 24 quarterbacks studied (more on that below), that drop in winning percentage is the largest such decline. You might think this is due to facing better defenses in night games, but that’s not really the case.

Schaub has averaged 7.8 Adjusted Yards per Attempt during day games and 6.0 AY/A during night games; that difference of 1.8 AY/A is the second largest among the twenty-four quarterbacks.

So yes, there is no debate: Schaub has been noticeably worse during night games in his career.

The table below shows all quarterbacks who have started a game this season and that have started at least five night games in their career. The data consist of all games throughout their career in which they were the starter. To make it a little easier to read, I’ve shaded the day and night categories differently:

QBD_W/LD_WIN%D_Y/AD_AY/AN_W/LN_WIN%N_Y/AN_AY/AY/A_DIFFAY/A_DIFFWin%_Diff
Jason Campbell28-310.4756.936.653-90.255.754.77-1.18-1.88-0.225
Matt Schaub41-310.5697.937.792-50.2866.946-0.99-1.79-0.284
Jay Cutler37-280.5697.36.8413-140.4817.16.08-0.2-0.76-0.088
Joe Flacco46-210.6877.116.912-70.6326.646.19-0.47-0.71-0.055
Ben Roethlisberger67-270.7137.947.7929-140.6747.857.14-0.09-0.65-0.038
Matt Ryan47-190.7127.197.037-50.5836.636.4-0.56-0.63-0.129
Carson Palmer48-580.4537.256.745-100.3336.556.27-0.7-0.47-0.119
Matt Cassel25-290.4636.596.114-50.4446.355.65-0.24-0.46-0.019
Matt Hasselbeck75-720.516.886.4210-60.6256.96.220.02-0.20.115
Aaron Rodgers40-200.6678.218.6814-70.66788.49-0.21-0.190
Alex Smith31-320.4926.616.078-50.6156.325.91-0.29-0.160.123
Sam Bradford13-200.3976.215.791-40.26.335.710.12-0.08-0.197
Michael Vick43-380.536.976.5515-80.6527.066.520.09-0.030.122
Mark Sanchez29-200.5926.645.828-90.4716.425.83-0.220.01-0.121
Tony Romo35-270.5657.77.6720-120.6258.177.740.470.070.06
Eli Manning61-390.617.136.5424-190.5586.966.68-0.170.14-0.052
Matthew Stafford16-210.4326.876.511-50.1677.476.90.60.39-0.266
Peyton Manning120-620.6597.587.3940-180.697.77.790.120.40.03
Tom Brady112-300.7897.397.4938-140.7317.557.90.160.41-0.058
Byron Leftwich21-240.4676.5163-30.56.656.470.140.470.033
Philip Rivers51-350.5937.87.5320-100.6678.18.130.30.60.074
Drew Brees79-620.567.397.1823-110.6767.77.840.310.660.116
Charlie Batch16-270.3726.725.789-30.757.738.221.012.440.378
Chad Henne12-170.4146.35.172-30.48.057.811.752.64-0.014

[continue reading…]

{ 3 comments }

I’ve noted a few times this year that Calvin Johnson, in his pursuit of Jerry Rice’s single-season receiving record, has quite an advantage on his side. The Lions have attempted more passes through 13 games of any team ever, and seem likely to break the pass attempts record.

Obviously it’s easier to gain more receiving yards when your team is throwing the ball nearly every play. That’s why when I came up with my Greatest WR Ever series, I looked at receiver performance per pass attempt.

I don’t have time for a nuanced analysis of wide receiver, but let’s just look at a simple statistic: receiving yards per team pass attempt. That’s what the table below shows, along with each player’s rank in receiving yards (the far left column). Brandon Marshall has 1,342 receiving yards while the Bears have only attempted 444 passes this year (including sacks). That means he’s averaging more than three yards per team pass attempt, which is incredible. Of course, it also speaks to the lack of other weapons in Chicago.

Ryds RkPlayerTmRecRydsTDTMATTYds/AttY/A Rk
2Brandon MarshallCHI101134294443.021
7Vincent JacksonTAM56114584422.592
4Andre JohnsonHOU82120934712.573
1Calvin JohnsonDET96154656182.54
6A.J. GreenCIN791151104782.415
5Demaryius ThomasDEN74119785032.386
12Steve SmithCAR6099924252.357
9Wes WelkerNWE95111645192.158
3Reggie WayneIND94122045692.149
8Roddy WhiteATL77114055352.1310
11Victor CruzNYG76100494792.111
14Brian HartlineMIA6292514422.0912
28Michael CrabtreeSFO6676153831.9913
13Julio JonesATL6399775351.8614
22Dwayne BoweKAN5980134361.8415
10Dez BryantDAL75102895671.8116
45Sidney RiceSEA4565873651.817
26Steve JohnsonBUF6177654321.818
24Davone BessMIA6177814421.7619
19Anquan BoldinBAL5882844821.7220
35Jeremy KerleyNYJ5272824351.6721
31Mike WilliamsTAM4673674421.6722
20Cecil ShortsJAX4382475001.6523
39Greg OlsenCAR5469154251.6324
25Randall CobbGNB7177774841.6125
15Marques ColstonNOR6588985591.5926
42Percy HarvinMIN6267734291.5827
23Eric DeckerDEN6479085031.5728
29Torrey SmithBAL4375374821.5629
18Tony GonzalezATL8183175351.5530
16Jason WittenDAL9288015671.5531
27Malcom FloydSDG5477555031.5432
17Lance MooreNOR5384845591.5233
32Josh GordonCLE4273254871.534
21Miles AustinDAL5581955671.4435
30Rob GronkowskiNWE53748105191.4436
34Mike WallacePIT5972885091.4337
47Hakeem NicksNYG5065234791.3638
44Jordy NelsonGNB4665864841.3639
59Brandon LaFellCAR3457744251.3640
72Golden TateSEA3749273651.3541
40Heath MillerPIT6167975091.3342
52Jermaine GreshamCIN5563654781.3343
70Vernon DavisSFO3850653831.3244
53Owen DanielsHOU5262264711.3245
49Nate WashingtonTEN3964844991.346
33Brandon MyersOAK7072845611.347
38DeSean JacksonPHI4570025411.2948
36Jimmy GrahamNOR6471085591.2749
58Chris GivensSTL3658434641.2650
{ 13 comments }

NYT Fifth Down: Post-week 14

This week at the New York Times, I take a look at how three defensive stars from the 2011 Draft have dominated the league and helped make their teams Super Bowl contenders.

The 2011 N.F.L. draft class was initially talked up for its star potential at quarterback: Cam Newton (the first overall pick), Jake Locker (8), Blaine Gabbert (10), Christian Ponder (12), Andy Dalton (35) and Colin Kaepernick (36).

Twenty months later, the  most dominant players have been guys named Smith, Miller and Watt. Those three are the front-runners for the defensive player of the year award:

Aldon Smith San Francisco took Smith, a Missouri linebacker, with the seventh pick in the 2011 draft. As a rookie, he was a role player who participated in fewer than half of his team’s snaps but recorded 14 sacks as the team’s designated pass rusher. This year, Smith is a full-time player and continues to be a dominant force. After sacking Miami’s Ryan Tannehill twice on Sunday, he has 19.5 sacks, the most of any player through 13 team games since the sack became an official statistic.

Smith has recorded more sacks in his first two seasons than Reggie White, Derrick Thomas or anyone else who has entered the league since 1982, the year the N.F.L. began officially tracking the statistic. Against the Bears on “Monday Night Football,” Smith recorded five and a half sacks against Jason Campbell, the most by a player in a game since 2007. He is within reach of Michael Strahan’s single-season record of 22.5, set in 2001. But as good as Smith has been, he is arguably just the third-best defensive player from his draft class.

Von Miller The Denver Broncos selected Texas A&M’s Miller with the second overall pick. He had an eye-opening rookie season that was somewhat overshadowed by Tebow Time, but he helped transform the Bronco defense and rightfully earned defensive rookie of the year honors. In 2011, Pro Football Focus rated Miller as the second-best defensive player in the league, and ranked him as the top linebacker against the run and the best pass-rushing 4-3 outside linebacker.

He has only gotten better in 2012. Miller has recorded a sack in each of the team’s last six games, all wins, and now has 16. More impressively, according to Pro Football Focus, Miller’s 16 sacks and 45 quarterback hurries are more than triple the numbers produced by the second-best 4-3 outside linebacker. He ranks as the best pass-rushing linebacker and the best run-stopping linebacker in the N.F.L., and neither race is particularly close. Miller is arguably the best all-around linebacker in the league and perhaps one of the three or four best pass rushers in the N.F.L., too. But Miller still isn’t the most highly regarded member of the 2011 draft.

J.J. Watt The presumptive favorite for the defensive player of the year award remains Houston’s Watt. With an 11-2 record, the Texans are tied for the best record in the N.F.L., and Watt, drafted out of Wisconsin at No. 11,  is a huge reason for that. According to Football Outsiders, entering Week 14, Watt led the league with 41 “Defeats” (a turnover, a tackle for loss or a play that prevents a third- or fourth-down conversion); the next-closest player was Miller with 33. According to an e-mail conversation Monday with Aaron Schatz  of Football Outsiders, who has been tracking the metric since 1996, only linebackers Ray Lewis (45) and Derrick Brooks (42) have recorded more “Defeats” in a full season, both doing so in 1999.

Watt’s production is remarkable for any player, let alone a 3-4 defensive end. Generally, defensive ends in a 3-4 scheme are not expected to fill up a stat sheet; they are supposed to absorb blockers to enable the linebackers behind them to achieve the glory. But Watt has recorded 16.5 sacks this season and became the first player to officially record 15 sacks and 15 passes defended in the same season. Pro Football Focus ranked Watt just ahead of Miller, and says he’s more than twice as valuable as the next best 3-4 defensive end in football, the Jets’ Muhammad Wilkerson.

Looking for a darkhorse? To identify the  man who probably should win the underrated player of the year award — watch a Bengals game. Defensive tackle Geno Atkins was taken in the same draft as Ndamukong Suh but has delivered  more production with a fraction of the hype. Atkins was at it again on Sunday against the Cowboys, delivering a sack and two other tackles behind the line of scrimmage, to go with two additional hits and six hurries against Tony Romo.

You can read the full article here, which notes that Calvin Johnson and Adrian Peterson are both chasing the 2,000-yard mark and highlights one really, really sad bit of Lions trivia.

{ 1 comment }

Checkdowns: My very first football article

Because I am an enormous narcissist, I wondered if I could find the very first article I ever wrote. And I did. While I doubt anyone visiting the site today wants to read an article by a first-time writer from the summer of 2002, if you do, here is my article discussing the fantasy relevance of a defense when ranking running backs. Here is the intro:

Being the most important position in fantasy football, running backs are analyzed and examined from just about every angle. Most fantasy footballers can tell you who slumped in the 2nd half, who had a great ypc, and who had a ton of “fluky” TDs last year that won’t likely happen again. One factor a lot of owners look into is the defense of a RB. Logic dictates that the RBs on good defenses are like gold mines: see Eddie George the past few years, Jamal Lewis and A-Train when their teams Ds had breakout seasons, and the original superstar of modern fantasy football, Emmitt Smith. 4 straight years as the number 1 RB, and his team’s D was in the top 5 all 4 years. Teams with great Ds are notorious for pounding the ball late in game, running a lot early in games(so as to not throw interceptions, and win the battle of field position and win it with your defense), and basically pad your RBs stats. While some put more weight than others on the importance of a strong D(some view it as very important, others as a deciding factor between 2 backs they rate similarly), it appears the correct weight to put on a defense when evaluating a RB is 0. Zilch. Nothing. Meaningless. Let’s take a look at last year:

RBYardsDPADPYADRYATDsYearDTR
Holmes15552313278200121
Martin15131252810200115
S. Davis1432133205200112
Green1387515169200112
Faulk138271031220017
Alexander131818231514200119
Dillon131514141110200113
Williams12452720146200120
Tomlinson123616191910200118
Hearst120691894200112
Avg1359141416915


Yards is the rushing yards, DPA is the POINTS ALLOWED RANK by that RBs defense, DPYA and DRYA are the rank that RBs team fared in Passing and Rushing yards allowed respectively, and TDs are rushing TDs for that RB. DTR is the average of the 3 defensive categories. The top 2 RBs last year were on teams with defenses who were in the bottom 5 of the league against the run. Using “common theory’, one would figure that teams that can’t stop the run, can’t control the clock, get behind early, and have to pass more. Those who backed off on Holmes and Martin due to their poor Ds(and Stephen Davis included) missed out. On average, the top 10 rushers in the league had well, average defenses. Middle of the pack in terms of points allowed, rushing yards allowed and passing yards allowed. Is this a one year trend?

I think it was Doug Drinen who once said if you don’t look at something you wrote five years ago and cringe, then you aren’t improving as a writer. For ten years old, this article seems to hold up okay although it could certainly use some editing. Fortunately, the conclusion is cringe-inducing enough for me to be convinced that I have improved from my first piece to my last.

{ 0 comments }

Best Games by Fantasy Defenses

Richard Sherman exhibits the proper form for 'You Mad Bro?' in sign language.

Bill Barnwell wrote yesterday about the dominant fantasy performance by the Seahawks defense against Arizona on Sunday. The Seahawks scored two touchdowns, forced 8 turnovers, recorded three sacks, and pitched a shutout. That made me wonder: which defense produced the best fantasy in NFL history?

I used Footballguys.com’s scoring system in the Footballguys Players Championship to calculate every performance by a fantasy D/ST since 1940. Here it is:

    Team Defense/Special Teams

  • 1 point – Every sack
  • 2 points – Every team takeaway (interception or fumble recovery)
  • 6 points – Every TD (via interception return, fumble return, punt or kickoff return, blocked FG return, missed FG return, blocked punt return)
  • 5 points – Every safety
  • 12 points – Every shutout
  • 8 points – Allowing between 1- 6 points
  • 5 points – Allowing between 7 – 10 points

Because I decided to use the official scoring designation for every play and chose not to rewatch every game in NFL history, there is one error that will come up in every few hundred games. Occasionally, an offense will score a touchdown on its own fumble recovery and that goes down in the gamebooks as a fumble recovery just like a defensive touchdown. So, be warned, these are unofficial fantasy scores.

As it turns out, Seattle’s game against Arizona comes in tied for 10th place. Incredibly, the best performance by a fantasy defense — a whopping 52 points — came in a Steelers-Browns game but wasn’t delivered by Pittsburgh. The came in the 1989 season opener, and after losing 41-10 the following week, Pittsburgh rebounded to finish 9-7 and make the playoffs. In 1950, the New York Giants also scored 52 fantasy points against the Steelers. New York scored 18 points in that game — 2 safeties, two fumble return touchdowns — and forced 9 turnovers and 7 sacks. The table below lists the best performances by a fantasy defense:
[continue reading…]

{ 5 comments }
Previous Posts