Today’s another fun day for all of us at Football Perspective. I’m fortunate to have a smart community of football fans who like to stop by every day. I’m also not the only one to notice that, as a lot advertisers have reached out to me over the last several months because of you guys.
I’m not a fan of most advertising, so I’ve always turned them down. I don’t want you guys to be annoyed when you come here, because I don’t like being annoyed when I’m on somebody else’s site. But after speaking with the folks at FanDuel, we were able to set up something that I think you guys will really enjoy.
FanDuel is fantasy football with a twist: you compete for real money by selecting any player you want each week under a salary cap format. Each player has a price, so the goal is to figure out who are the undervalued players. Instead of drafting a team for a season, you draft a team for a week, as frequently or infrequently as you like (i.e., you can enter every week, or play in week 1, week 3, and then every week the rest of the year starting in week 10 — and not be behind the curve). You can compete in games for as little as $1 or as much as $535 per game. Once you play around with the site, you’ll see all the different options: head-to-head games, 50/50 games, 3-man, 5-man, 10-man, 20-man, or big tournament games.
That’s cool, but what’s really cool is that FanDuel likes you guys. This is a big company — this NFL season, they’ve said that they’ll be paying out over $90 million to their players — but they’ve kept their eyes on us, too. So FanDuel is offering a special 50% deposit bonus to Football Perspective readers. Click here to sign up by clicking the orange “Play Now” button, and the promo code PERSPECTIVE will be entered for you.
But even if you don’t want to spend any money, there’s another cool offer on the table: FanDuel has a free game with a $1500 prize pool for all of us to play on opening weekend. I’ll be in the field competing as ChasePerspective.
You can click here to pick your team for the free game. When you’re finished, click Enter on the bottom of the page. If you didn’t sign up before building your team, you’ll be directed to register a FanDuel account. When you sign up, be sure to type the promo code PERSPECTIVE and your team will be entered into the league. You can edit your team until the first game starts, and then watch the live scoring on FanDuel during the games to track how your team performs against the rest of the field.
Now, the fun stuff: whom should you select? Here are my thoughts:
We have to work within the confines of a $60,000 salary cap and have to fill nine positions: a QB, two RBs, three WRs, a TE, a K, and a D. That’s $6,666 per position, a good baseline to keep in mind. Normally, I’d just go ultra cheap at kicker and defense, but FanDuel doesn’t make things so simple.
At kicker, Phil Dawson (he’s now in San Francisco) and Stephen Gostkowski are the two most expensive kickers at $5400, while just about every other kicker is $5,000. I want a kicker who plays for a team that should be in a close game but will also have trouble getting into the end zone. At a cost of $5K, Robbie Gould fills that description, as the Bears host the Bengals. Chicago will be breaking in a new offense and is up against a tough defense — that could be a three field goal game for Gould.
On defense, it’s all about matchups and home field. The Colts are home against the Raiders, and while Chuck Pagano’s defense was terrible last year, hosting Oakland and Matt Flynn seems like a good matchup. Indianapolis only costs five grand, which leaves me with $50K for the other seven spots, or $7,143 per player.
My next thought is to first find an undervalued player at quarterback and tight end before looking at the backs and receivers. At QB… actually, let’s take a quick break here and review the scoring system. It’s fairly typical — one point per 25 yards passing, 4 points per passing touchdown, 1 point per 10 yards rushing/receiving, and 0.5 points per reception. Some fantasy leagues give 6 points per passing touchdown and one point per 20 yards passing. Those leagues are more passer-friendly; this sort of system is more favorable to running quarterbacks.

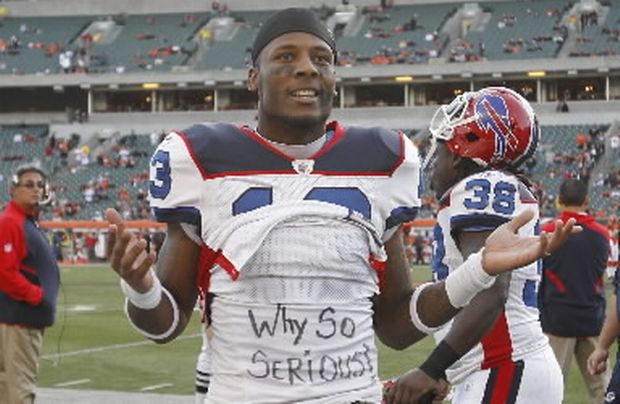
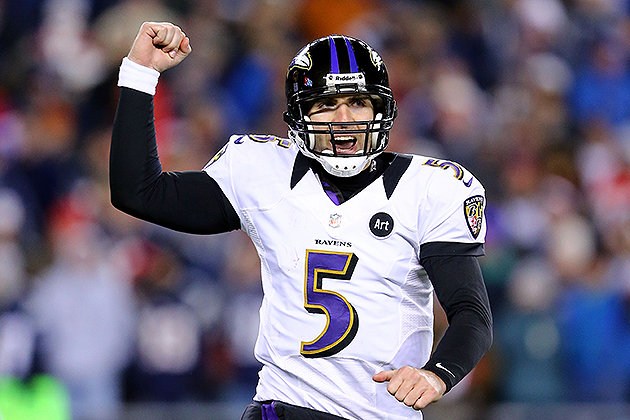
How can you not pick this guy?
I am pretty bullish on Michael Vick as a fantasy player, at least unless or until he gets benched or hurt. But for one week, the risk is low, and I could easily see him rushing for 50 yards and a touchdown in week one. At $8,100, he’s the 12th-most expensive quarterback, so it’s not like he’s an outright steal. But I think that’s good value, so I’m taking him.
At tight end, I think a lot of people will take New England rookie Zach Sudfeld because he only costs $4500. In large leagues, I think it’s smart to zig when everyone zags: you don’t win your March Madness bracket by doing what everyone else does. The way to win is to have a unique lineup and cross your fingers, not to have a common lineup, cross your fingers, and then hope you’re the best of that group. Still, at $4500, I can’t pass up on the player who may well be Tom Brady’s #2 target in week one against a bad Buffalo defense.
This leaves me with $37,400 for two running backs and three wide receivers, or $7,480 per position. I have avoided it so far, but the Atlanta/New Orleans game screams fantasy paradise, so it’s time to get in on that action. Julio Jones costs $8K and Roddy White $7,100, so I’ll go the cheaper route and hope the torch isn’t passed just yet.
Steve Johnson seems crazy undervalued to me: he’s going against the Patriots, one of the best matchups of the day (the Patriots have given up over 9,500 gross passing yards the last two seasons!). Johnson’s the Bills #1 wide receiver and has three straight 1,000-yard seasons. I know he’s been banged up and the quarterback situation is up in the air, but whether it’s EJ Manuel or Kevin Kolb, Johnson will be able to produce. For $5,900, I’ll gladly take him.
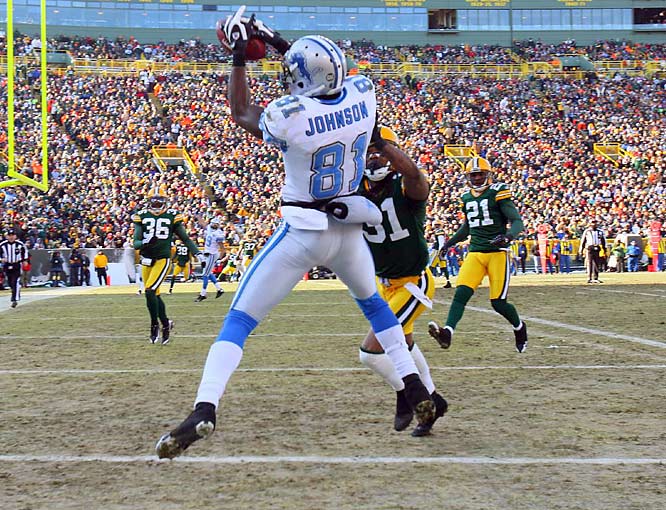
Let’s switch over to running back. Ahmad Bradshaw sticks out to me because of the probable Game Script: for the same reason I like the Colts D, I like having Bradshaw, who should be positioned for 20 carries. That makes him a bargain at $6K. That leaves me with $18,400. As it turns out, picking Calvin Johnson and Adrian Peterson costs…. $18,300. I guess my work here is done.
So that’s how you enter a FanDuel contest. If you want to sign up and get a 50% first-time deposit bonus, click here. Or, if you just want to enter the free contest and compete again me and your fellow readers, click here. In both cases, the promo code is PERSPECTIVE.